

SPE-131350-MS
.pdfSPE 131350 |
11 |
|
|
Figure 8 - Principal types and evolution paths of kerogen are shown on this van Krevelen diagram: Types I, II, and III are the most frequent. Kerogens of intermediate composition also occur (after Tissot and Welte, 1984).
The critical parameters related to whether or not a given rock will be a good source rock is the organic richness (generally recorded as wt% Total Organic Carbon – TOC), the current and past maturity level of the formation (generally referenced as Vitrinite Reflectance, Ro), and the organic matter type (whether the primary thermogenic product will be oil, gas, or a mixture). During the deposition of these organic-rich muds, a variety of geologic and biologic processes contribute to the concentration of organic matter ultimately preserved in the rock, as described previously.
Figure 9 - Schematic of maturation of a Type II (oil-prone kerogen) compared to coal rank. Also, shown are the respective maturity in LOM units (Level of Organic Metamorphism; Hood et al., 1975) and corresponding vitrinite reflectance (Ro).
During the exploration phase for hydrocarbons, the location (depth and lateral extent) of these organic-rich formations is critical for understanding the complete hydrocarbon system that may, or may not, be present in a sedimentary basin. The current and past depth of burial and heat flow history provides critical information on the timing of generation and expulsion of hydrocarbons to conventional traps. The principal generation windows for oil-prone kerogen (Type I and Type II) ranges from Ro=0.5 (for early generation) through peak generation Ro=0.8, to overmature Ro>1.1. Above Ro=1.1, any residual oil or oil-prone kerogen will

12 |
SPE 131350 |
|
|
likely be cracked to gas. The current targets for shale-gas reservoir exploration are overmature oil-prone source rocks; thus, unconventional shale-gas reservoirs are simply highly mature organic-rich rocks that have gone through primary thermogenic maturation, but have retained sufficient residual gas to be of economic interest. The key may be how and where that gas is stored, as described below.
Why Total Organic Carbon (TOC) is Important in Shale-Gas Rocks
Because of the strong vertical heterogeneity observed in source rocks (Figures 3, 7), it is expected that these same variations exist in the overmature expression of these source rocks as shale-gas reservoirs. Examination of dozens of shale-gas formations worldwide clearly indicate that the total porosity and gas content (gas-filled porosity or bulk-volume gas BVG) is directly associated with the TOC content of the rock (Figure 10). Some reasons behind these relations will be discussed later in this paper, but sufficient to state that high local TOC is a critical factor to assess when evaluating potential shale-gas reservoirs because it relates to both porosity and gas saturation.
|
10 |
|
|
|
|
|
|
|
|
|
|
|
9 |
|
|
|
|
|
|
|
|
|
|
|
8 |
|
|
|
|
|
|
|
|
|
|
(wt%) |
7 |
|
|
|
|
|
|
|
|
|
|
6 |
|
|
|
|
|
|
|
|
|
|
|
5 |
|
|
|
|
|
|
|
|
|
|
|
TOC |
|
|
|
|
|
|
|
|
|
|
|
4 |
|
|
|
|
|
|
|
|
|
|
|
|
3 |
|
|
|
|
|
|
|
|
|
|
|
2 |
|
|
|
|
|
|
|
|
|
|
|
1 |
|
|
|
|
|
|
|
|
|
|
|
0 |
|
|
|
|
|
|
|
|
|
|
|
0 |
2 |
4 |
6 |
8 |
10 |
12 |
14 |
16 |
18 |
20 |
a |
|
|
|
|
Dry (Total) Porosity |
|
|
|
|
||
|
14 |
|
|
|
|
|
|
|
|
|
|
Porosity |
12 |
|
|
|
|
|
|
|
|
|
|
10 |
|
Non-Preserved Samples |
|
|
|
|
|
||||
8 |
|
|
|
|
|
|
|
|
|
|
|
-Filled |
|
|
|
|
|
|
|
|
|
|
|
6 |
|
|
|
|
|
|
|
|
|
|
|
Gas |
4 |
|
|
|
|
|
|
|
|
|
|
AR |
|
|
|
|
|
|
|
|
|
|
|
2 |
|
|
|
|
|
|
|
|
|
|
|
|
|
|
|
|
|
|
Preserved Samples |
|
|||
|
0 |
|
|
|
|
|
|
|
|
|
|
|
0 |
2 |
4 |
6 |
8 |
10 |
12 |
14 |
16 |
18 |
20 |
b |
Dry (Total) Porosity |
Figure 10 – a) Relation between Total Porosity (p.u.) and TOC (wt%); b) relation between Total Porosity (p.u.) and As-Received Gas-Filled Porosity (p.u.) for preserved and non-preserved samples. Preserved samples are recommended.
Analytical Characterization of Shale-Gas Rocks
Numerous geochemical and petrophysical techniques have been developed to characterize organic-matter-rich source rocks. Although most techniques were developed to characterize thermally mature source rocks in the oil-generation window, the same techniques can be applied, sometimes with modification, to the shale-gas class of unconventional reservoirs that currently exhibit maturities much higher than the onset of overmaturity (i.e., Ro>1.1). Typical sample analytical techniques include: TOC, X-ray diffraction (XRD), adsorbed gas analysis, vitrinite reflectance (Ro), detailed core description, thin section petrography, and electron microscopy. These results are combined with a full suite of well logs, including high resolution and borehole imaging logs, to best characterize these heterogeneous formations. Characterization of porosity, fluid saturation, and permeability derived

SPE 131350 |
13 |
|
|
from core can be tied to log response, but several studies have shown that the results obtained from different commercial core analysis laboratories can vary significantly (as discussed later in this paper; see also Sondergeld et al., 2010b). Thus, the “ground truth” characterization easily available for conventional sandstone reservoirs, is somewhat less certain in these mudrocks.
Mineralogical variation in Shale-Gas Reservoirs - Mineral composition in shale-gas reservoirs varies widely. Figure 11 is a ternary plot based on quartz, total clay, and total carbonate with the compositional fields outlined for the Barnett and Eagleford plays in North America, contrasting with the composition of a clay-rich gas-bearing mudstone. As can be seen, the compositional variations span nearly the entire compositional field of this plot. Current producing plays tend to lie below the 50 % clay line. The shale-gas plays that contain greater than 50 wt% quartz or carbonate tend to have a more brittle character that responds well to current well stimulation practices.
Total Clay
|
|
|
0.00 |
1.00 |
|
|
|
|
|
|
|
|
|
Clay-rich gas-bearing mudrock |
|
||
|
|
|
0.25 |
|
|
|
|
|
Barnett |
0.50 |
|
|
|
|
|
|
|
|
|
|
|
Eagleford |
|
|||
|
|
|
|
|
|
|
||
0.75 |
|
|
|
|
0.25 |
|
|
|
1.00 |
|
|
|
|
|
|
0.00 |
|
0.00 |
0.25 |
0.50 |
0.75 |
1.00 |
|
|||
Quartz |
|
|
|
|
Total Carbonate |
|
||
Figure 11 – Mineral composition is quite variable in each |
Figure 12 - Recrystalized biogenic silica is abundant in this |
|||||||
|
|
shale-gas reservoirs. |
|
|
Barnett sample. The porosity in the organic-matter is discussed |
|||
|
|
|
|
|
|
|
|
later in this paper. |
From a stimulation perspective, not all quartz is created equal in shale-gas reservoirs. The most effective quartz component appears to be recrystalized biogenic opaline silica (Jarvie et al., 2007) that forms a continuous framework of quartz cement, as shown in Figure 12.
Detrital quartz, on the other hand, appears to be less effective. Thyberg et al. (2009) provide evidence that extra-basinal detrital quartz is cemented by silica from smectitic-clay illitization during diagenesis according to the reaction:
Smectite + K+ = Illite + Silica + H20 (Boles and Franks, 1979) .
Thyberg et al. (2009) show evidence that such a reaction increases the brittle behavior of shales, but to date we have not observed this play style for enhancement of brittle behavior in shale-gas reservoirs. Extra-basinal detrital quartz may be more effective where it forms interbedded tight-gas sandstone plays associated with sediment entry points into a basin.
Mineralogical variation in shales not only occurs at the meter scale, but also occurs down at the mm to cm scale. Figure 13 is a thin section photomicrograph from a mudstone illustrating mm-to-cm scale thin beds of clay-rich and carbonate-rich end-member lithologies, spanning the clay-rich compositional field in Figure 11. Vertical lithological heterogeneity in shales appears to generally exceed that found in many sandstones.
Because the organic matter that becomes kerogen is deposited at the same time as the inorganic rock mineral grains, it is important to keep in mind that the volume occupied by the kerogen occupies a much larger volume percent (vol%) than is indicated by the weight percent (wt%) measurement; this is because of the low grain density of the organic matter (typically 1.1-1.4 g/cc) compared to that of common rock-forming minerals (2.6-2.8 g/cc). The impact of this is illustrated in Figure 14, which shows various scale scans of photomicrographs of relatively low maturity Woodford Shale (Ro=0.58, LOM=8). In this case the TOC of the sample was 20.9 wt%, but the corresponding volume percent of the kerogen is closer to 40% of the rock. Thus, relatively small amounts of wt% TOC have about double the impact on a volume % basis. This is important to remember because most well logs respond to volume percent quantities, as will be discussed below.

14 |
SPE 131350 |
|
|
|
Woodford Formation |
|
TOC = 20.9 wt% HI=328 Tmax = 436°C |
Transmitted Light |
Thin section Scan |
Fluorescent Light
500 μm
Apply threshold |
|
Fluorescing |
|
kerogen |
|
(Tasmanites |
|
cysts of |
~40 % Kerogen |
marine algae) |
Figure 13 - Large-scale |
|
photomicrograph showing detailed |
Figure 14 – Woodford shale thin section scan showing kerogen layers; |
bedding and composition variations |
note that 20 wt% TOC corresponds to about 40 vol% kerogen. |
on the sub-centimeter scale. |
|
Well Log Response in Shale-Gas Rocks
Many of the well log techniques developed for mature oil-prone organic-rich rocks are readily applicable to the “overmature” shale-gas formations (for a more discussions of well log response in organic-rich formations see Passey et al., 1990, and Sodergeld et al., 2010b; Spears and Jackson, 2009). The main differences relate to the fluid type (gas instead of oil), distribution of porosity (occurrence of pores within the organic matter in addition to intergranular matrix porosity), and bulk rock composition (the presence or absence of brittle minerals in the rock matrix).
Gamma-ray and Spectral Gamma-ray – For most fine-grained rock evaluation the gamma-ray is a critical well log to help differentiate shales (seals or source rocks) from conventional reservoir lithologies, such as sandstone or carbonate. For shale-gas plays, the source, seal, and reservoir are often contained completely within the fine-grained rock lithofacies and the gamma-ray curve may or may not be as useful as in conventional reservoirs. If the shale-gas of interest is deposited under marine conditions (primarily Type II kerogen), the uranium content continues to be useful given its association with organic matter, and the uranium component can be a good indicator of organic richness. In lacustrine (or lake) settings, there is generally a paucity of uranium in these systems, and more often than not there is no relation between uranium and TOC (Bohacs and MiskellGerhardt, 1998; Bohacs, 1998); in these cases, the total gamma-ray curve remains a fairly good indicator of overall clay content in the rock (Bhuyan and Passey, 1993) but may not indicative of high TOC or the reservoir facies of interest. Figure 15 shows how the base of a parasequence is organic rich (decreasing upward), and this same observation can be seen in the total gamma-ray response.
Gamma Ray
Exshawxs
< 3m>
Wabamonaba on |
0 5 10 15 20 25 30 |
|
TOC (wt%) |
Figure 15 – Core photograph of Exshaw flooding surface;1 corresponding GR and measured TOC profile. Gamma-
ray scale is 0 to 150 GAPI. See also Figure 7b.
Resistivity – The resistivity of a rock is directly related to those components that are electrically conductive. In conventional reservoirs, formation water is the primary conductor of electricity, at least when the formation waters are brackish to saline, allowing for ionic conduction. Low resistivity is observed when the amount of saline water-filled porosity is high – the larger the

SPE 131350 |
15 |
|
|
volume of formation water (Bulk Volume Water), the lower the resistivity of the fluid-filled rock. Hydrocarbon fluids (oil or gas) are non-conductive, and when they are present in sufficient quantities, they displace the amount of water in a given formation, resulting in resistivity values higher than the same rock fully filled with electrically conducting formation water (Archie, 1942). There are many variants to the interpretation of resistivity in conventional reservoirs (e.g., clay conductivity and shaly sand analysis; thin-bed effects due to interbedded shales; Waxman-Smits, 1968; Worthington, 1985; Passey et al., 2006) but these are beyond the scope of the current paper, yet may play second-order roles in the quantitative interpretation of shale-gas reservoirs.
Many shale-gas reservoirs contain relatively minor amounts of clay (20-30 wt%), whereas others may contain as much as 70 wt% clay. The importance of additional clay conductivity on the interpretation of fluid saturation depends on the relative conductivity of the clay to that of the formation water; in general, if the salinity of the formation water is greater than the salinity of sea water (e.g., 35 kppm NaCl equivalent), then the relative impact of excess conductivity due to clay minerals is small. Moreover, the amount of water-filled porosity (i.e., bulk volume water or BVW) plays a role on the impact of clay conductivity, because with decreasing amount of conductive formation water (i.e., low porosity), the relative impact of clay conductivity to that of the formation water will increase.
Other minerals (organic and inorganic) also play a role in the overall conductivity of the rock (Anderson et al., 2008). Pyrite is commonly present in organic-rich intervals of shale-gas formations (due to the reducing conditions that enhanced organic matter preservation, as discussed in the first section) and may play a role in decreased resistivity response if the volume is sufficient, In general, most organic-rich intervals contain some pyrite, but overall, the resistivity remains relatively high in the TOC-rich intervals. As with organic matter, the matrix density of the rock components must be factored in when determining the volume percent occupied by that component. Due to the high density of pyrite, a rock containing 10 wt% pyrite may contain only 7 vol%, whereas with low density organic matter, 10 wt% TOC may correspond to about 20 vol% kerogen.
Finally, in some shale-gas reservoirs that are at very high maturities (Ro>>3), the overall rock resistivity can be 1-2 orders of magnitude less than is observed in the same formation at lower thermal maturities (Ro between 1 and 3). It was thought that perhaps the carbon in the organic matter is recrystalizing to the mineral graphite, which is electrically conductive, but preliminary studies indicate that pure mineral graphite (as indicated by XRD) is not present in abundance at these thermal maturities.. Thus, it is likely that a precursor to graphite is forming, and further studies are warranted. It is sufficient to state that in extremely high maturity organic-rich rocks (Ro>3), the rock may be much more electrically conductive due to other mineral phases being present rather than solely formation water, clay, and pyrite (as usually considered).
Density – Due to the low grain density of organic matter (or kerogen) the presence of organic matter can have a significant impact on the bulk density of the sample, and, consequently, on the bulk density measured by well log tools (Meyer and Nederlof, 1982; Passey et al., 1990). If there are no large local variations in other parameters that can affect the bulk density, then the density log can be used to build fairly robust proxies for TOC. One advantage of the density log is its relatively fine vertical resolution (~ 1 ft) that can be used to differentiate subtle and closely spaced vertical variations in TOC. This is extremely valuable when combined with high-resolution resistivity logs (as in the modified logR approach described below).
(g/cc) |
3.4 |
|
|
|
Assumes kerogen density = 1.1 g/cc |
|
|||||
3.2 |
|
|
|
|
|||||||
|
|
|
|
|
|
|
|
|
|
||
3.0 |
|
|
|
|
|
|
|
|
|
|
|
Density |
|
|
|
Si |
|
|
|
|
|
|
|
|
|
|
|
|
|
|
|
|
|
||
|
|
|
|
d |
|
|
|
|
|
|
|
|
|
|
|
e |
|
|
|
|
|
||
|
|
|
|
|
ri |
|
|
|
|
|
|
|
|
|
|
|
ti |
|
|
|
|
|
|
2.8 |
|
|
|
|
c |
Mu |
|
|
|
|
|
|
|
|
|
|
|
d |
|
|
|
||
|
|
|
|
|
|
|
s |
|
|
|
|
|
|
|
|
|
|
|
t |
|
|
|
|
|
|
|
|
|
|
|
o |
|
|
|
|
|
|
|
|
|
|
|
n |
|
|
||
Grain |
2.6 |
|
|
|
|
|
|
|
e |
|
|
|
|
|
|
|
|
|
|
|
|
||
2.4 |
|
Ill |
|
|
|
|
|
|
|
|
|
|
|
i |
|
|
|
|
|
|
|
||
|
|
|
|
ti |
|
|
|
|
|
|
|
|
|
|
|
c M |
|
|
|
|
|
|
|
Dry |
|
|
|
|
u |
|
|
|
|
|
|
|
|
|
|
d |
|
|
|
|
|
|
|
2.2 |
|
|
|
st |
one |
|
|
|
|
|
|
|
2.0 |
|
|
|
|
|
|
|
|
|
|
|
0 |
5 |
|
10 |
|
|
15 |
|
|
20 |
25 |
TOC (wt%)
Figure 16 – Relation between TOC and dry grain density for samples from an illite clay-rich organic-rich mudstone . Also, shown are the theoretical limits for siderite-rich and illite-rich mudstones assuming the kerogen grain density is 1.1 g/cc,

16 |
SPE 131350 |
|
|
Sonic – Similar to the density log response, the P-wave log can be calibrated to TOC content due to the low P-wave velocity (high transit time) of organic matter, given the previous caveats about no significant local variations (such as changes in porosity or mineralogy) that can affect sonic response. Most work to date has focused on the compressional (P) wave, but there is also a likely impact on the shear (S) wave response (Zhu et al., 2010). In general, the use of the sonic log for determining TOC is enhanced when combined with other logs.
Neutron – General observations are that the neutron log is a poor indicator of organic matter as a single stand-alone tool. This tool is affected not only by the hydrogen in the organic matter, but also by the hydrogen in the hydroxyl (OH-) in the clay minerals (see Figure 20), as well as by the hydrogen in the formation water and any liquid or gaseous hydrocarbons present. For some silica-rich shale-gas formations, the use of the standard neutron/density overlay has proven useful for recognition of intervals that contain higher gas volumes; this technique has limited application when the formation is not clay rich, due to the increase in hydroxyl (OH-) ions resulting in a larger neutron/density separation that may mask the “gas crossover”.
NMR – Published applications of use of NMR logs for unconventional reservoirs evaluation are limited (e.g., Jacobi et al, 2009; Merkel and Gegg, 2008). In water-saturated low TOC shale-gas intervals, there is good agreement between total NMR porosity and total porosity measurements of core (using crushed rock methods). Further work is warranted to fully understand the response in organic-rich, and presumably, gas-bearing intervals.
Calibration of Logs to Total Organic Carbon Content
As has been shown for Type II (oil-prone) source rocks in the oil-maturity window (Ro=0.5-1.1), the presence of the organic matter and the presence of generated hydrocarbon fluids can have a large response on the resistivity log (Passey et al., 1990). At the time that work was done, the focus was entirely on the oil-mature window and limited data existed for overmature shale-gas rocks (i.e., Ro>1.1). Active exploration of shale-gas plays has allowed acquisition of the data required to calibrate the logs to many of the critical controls for successful shale-gas plays.
Immature Source Rock (Ro<-0.5)
Organic Matter |
|
Matrix |
Water |
|
|
Immature |
|
Source |
|
Mature Source Rock (Ro=1.0)
Organic Matter |
HC |
|
|
Matrix |
|
Mature Source |
Water |
Figure 17 – Well log response ( logR and GR) response for immature (Ro=0.5) and mature (Ro-1.0) Devonian age Duverney formation in Canada. Note that the parasequence-set scale packages are identifiable in the TOC profiles (black arrows).
Combined porosity/resistivity methods (e.g., logR method) – As described in the Passey et al.(1990), the original calibration of the logR technique (using either sonic-resistivity or density-resistivity combinations) was for source rocks in the oil maturity window (Ro = 0.5–0.9 or LOM 6-10.5). No rock calibration was available at that time to included rocks in the overmature or “gas” window (Ro > 1.0; see Fig. 9). As previously published, a parametric fit was made for TOC from logR separation as a function of LOM (maturity); the lines for maturities greater than LOM=10.5 (Ro>0.9) were numerical extrapolations of the lower maturity

SPE 131350 |
17 |
|
|
calibration lines. Recently acquired TOC data from shale-gas formations worldwide indicate that for overmature intervals (LOM>10.5 or Ro>0.9) the calibration to TOC is the blue line (Figure 18). Use of the original Passey et al., (1990) “calibration” lines for rocks with maturity values LOM>10.5 (or Ro>0.9) will result in underestimation of the actual TOC. Sondergeld et al. (2010b) propose using a correction multiplier to obtain accurate log-derived TOC using the logR technique for overmature shalegas formations, which is approximately equivalent to using the blue calibration line shown in Figure 18.
Figure 18 – Revised relation of logR to TOC indicating possible upper limit for rocks with LOM> 10.5 (Ro>0.9)
A comparison of logR-derived TOC with high-frequency measured TOC is shown in Figure 19a; the green shading represents the TOC from standard logR (sonic/resistivity) using the blue calibration line illustrated in Figure 18; the cyan curve in Figure 19a is TOC from the logR density/resistivity pair, and the orange line is from high-resolution density/resistivity logs, providing more detailed vertical variability of TOC, and comparable with the borehole electrical image log (Figure 19b).
Elemental and Mineralogic Logs – These logs can determine reasonable values for total clay, carbonate, and quartz (at least within ± 5-10 wt%), but none of these parameters are directly related to organic richness of shalegas reservoirs. But, the total silica or total carbonate content is likely related to geomechanical properties of the rock. Moreover, these logs appear to be useful in identifying pyrite and/or siderite intervals, and these intervals are commonly associated with sequence-stratigraphic surfaces in distal environments where clastic input is minimized (Figure 4). Further analysis is warranted in using these logs for recognition of significant stratigraphic surfaces.
Borehole image logs – High-resolution borehole electrical images are useful for identifying closely spaced vertical variations in resistivity, which can be tied to variations in organic richness (possibly due to higher gas saturation in these intervals (Figure 19b). From this image, individual parasequences are readily identified -- high TOC and resistive (bright) at the base, and low TOC and conductive (darker) upward. Care must be used when interpreting borehole electrical images because tight (low porosity) carbonate or siliciclastic beds and siderite concretions appear resistive (bright).
The use of water-base mud is required for standard highresolution electrical images. It may be possible to identify similar features using oil-base imaging logs, but the vertical resolution is likely to be coarser than for water-base-mud electrical imaging wireline logs.
Figure 19 – a) Log-derived TOC using the logR approach showing comparison with high-frequency TOC core measurements. b) Static borehole electrical image log for the same interval as (a). Note the high-frequency variations in vertical properties and the parasequence expression (bright at base, darker upward).

18 |
SPE 131350 |
|
|
Porosity in Shale-Gas Rocks
The nature of the porosity within overmature organic-rich formations may provide some insight into how they work, and into why analytical procedures for characterizing the porosity and fluids may vary. Within conventional siliciclastic reservoirs (e.g., sandstones), there is a clearer differentiation between intergranular porosity (between detrital grains) and secondary porosity within grains (intragranular porosity), such as microporous rock fragments, diagenetic clays, and partially dissolved detrital grains (feldspar, rock fragments). Once detrital clays and other very small particles are introduced, then the clear differentiation between what is fluid-filled porosity and what is solid is more complicated. The common clay minerals found in detrital systems are kaolinite, chlorite, illite, and mixed-layer illite-smectite (Figure 20). All clays have hydroxyls (OH-) as part of their crystal structure; although the neutron log is affected by the hydroxyl, it is important to recognize that this is not water, or part of the total porosity of the rock. Only illite is inherently radioactive, although trace amounts of thorium can be found substituting in the crystal structure of montmorillonite-family clays. Because of the very small grain size of clays, a large amount of surface water is associated with clay minerals, either as adsorbed water, double-layer water containing electrically conducting cations, or as strongly held capillary-bound water (but beyond the standard “double-layer” of water) (Eslinger and Pevear, 1988). Sometimes, all these are collectively referred to as “clay-bound water” but their quantitative measurement and differentiation is problematic and imprecise, especially if one chooses to use water saturation (Sw) as an indicator of volumes of water.
Kaolinite - Al4[Si4O10](OH)8 Chlorite - (Mg,Al,Fe)12[(Si,Al)8O20](OH)16
Illite - KAl4[Si7AlO20](OH)4 |
Smectite - (Ca,Na)(Al,Mg,Fe)4[(Si,Al)8O20](OH)4• nH2O |
Figure 20 – Four major clay types encountered in sedimentary rocks. Also, shown are their chemical formulae.
Most siliciclastic grains are water-wet indicating that there is a very thin layer (or double-layer) of water on the grain surfaces; for sandstones, the volume of this water is largely negligible compared to the volume of void space (the pore space) between grains. In fine-grained rocks, such as mudstones, the particle size is orders-of-magnitude smaller, and, thus, the surface area is orders of magnitude larger (Table 1, and Figure 21). In clay-rich rocks, the water related to the clay surfaces is significant relative to the total porosity; moreover, for some types of clays (the smectites/montmorillonites), there exists interlayer water that some consider part of the total porosity system, and others consider part of the crystal structure. The nature and bonding mechanisms for the surface water has been studied for decades, and is still a point of scientific discussion, the details of which are beyond the scope of the current paper (see Feibelman, 2010 for a discussion of the binding mechanisms related to the first layer of water on kaolinite).
Table 1 - Surface area of common clay minerals (and fine grain sandstone)
Clay Type |
Internal Surface |
External Surface |
Total Surface |
|
Area (m2/g) |
Area (m2/g) |
Area (m2/g) |
Smectite |
750 |
50 |
800 |
Illite |
0 |
30 |
30 |
Chlorite |
0 |
15 |
15 |
Kaolinite |
0 |
15 |
15 |
Fine Quartz Sand |
0 |
0.02 |
0.02 |

SPE 131350 |
19 |
|
|
Clay Surface
|
|
|
|
|
Kaolinite has only |
Smectite has both internal |
|
|
|
|
|
external surface area |
and external surface area |
|
|
|
|
|
(15 m2/g)* |
(800 m2/g)* |
- |
- |
|
|
|
|
External |
- |
|
|
|
|
|
|
+ |
+- |
+- |
|
Internal |
||
- |
- |
|
||||
+ |
+- |
|
- + |
|
|
|
- |
- |
|
|
|
||
|
+ |
+ |
- |
+ |
Na+ |
|
|
|
|
||||
- |
- |
|
- |
|
|
|
|
|
|
|
|
||
- |
+ |
|
|
|
|
|
|
Adsorbed H2O |
|
||||
|
|
|
||||
|
a |
|
|
|
|
15 nm |
|
|
|
|
|
b |
|
|
|
|
|
|
|
|
Figure 21 – a) Schematic of “adsorbed” surface water and double-layer of water. b) Schematic and SEM images showing that kaolinite has only external surface area and smectite has both external and internal surface area. The TEM (transmission electron microscope) image of the smectite shows that the collapsed layer (without water) is 10 angstroms, 1.0 nm).
For all clays, there exists yet another contributor to the confusion about definitions of porosity: the hydroxyl ion (OH-) that occupies crystal lattice sites in the octahedral layer of most clays (Figure 22), but this ion is not actually liquid water and does not conduct electricity via ionic conduction. The hydrogen in the hydroxyl is, however, detected by the standard neutron logging tools and is the cause of the routine neutron-density separation noted in clay-bearing shales or mudstones.
In addition, interparticle porosity exists between clay grains, analogous to intergranular porosity in sandstones, but in clay-rich rocks, the pores are much smaller, due to the smaller grain sizes. The clay integranular pores are very small (likely with dimensions of 10’s of nanometers), and although the dimensions are orders of magnitude greater than the surface water, capillary forces are likely great. The question arises if this capillary-bound water is part of the total porosity of the rock, or included as part of the “fuzzy” (poorly defined) clay-bound water term. The issue is compounded when porosity measurements are made on non-preserved rock samples.
Tetrahedral Sheet
Octahedral Sheet
Tetrahedral Sheet
Interlayer
Cations & Water
Tetrahedral Sheet
Octahedral Sheet
Tetrahedral Sheet
H2O |
OH- |
Ca2+, Na+ |
O2- |
Al3+, Fe3+,Fe2+, Mg2+ |
Si4+, Al3+ |
|
|
Occasional |
Figure 22 – Crystallographic structure of Smectite showing the occurrence of (OH-) ions and interlayer water (after Grim, 1968).
Quantification of Porosity (comparison of various labs)
The method commonly used to measure porosity of gas shales is to crush the rock to a specific particle size and measure the grain volume of the crushed rock samples using a He pycnometer; it has been reported, however, that for dried samples, the measure of total porosity may depend on the molecule used for the measurement (Bustin et al., 2008). For crushed-rock porosity determination, the bulk volume of the intact sample is found prior to crushing, using volume displacement method in which the
20 |
SPE 131350 |
|
|
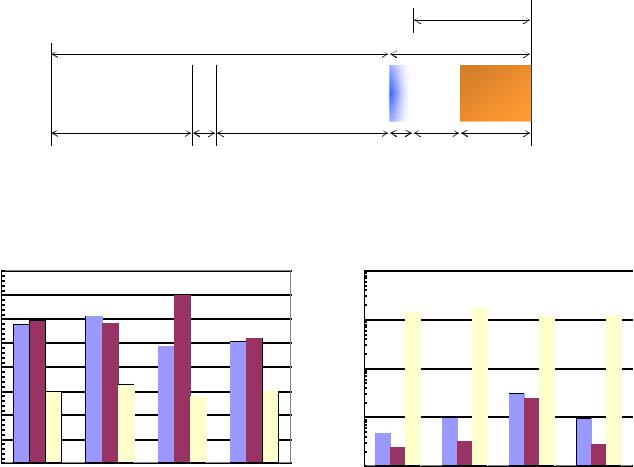
sample is immersed in a fluid such as mercury. The details of the method are described in Luffel et.al. 1992, and Luffel and Guidry, 1992. We have observed significant disparities in the porosity values reported by different laboratories that use this method to measure porosity as shown in Figure 24a (see also Sondergeld et al, 2010b). The sample splits sent to the different laboratories were from the exact same sample depths to eliminate vertical variability. Some of the observed differences may be attributed to handling of these samples such as crushing the rock to different sizes and exposure of the samples to different environments.
As shown in Figure 23, a typical shale-gas rock volume is composed of matrix made up of inorganic minerals and organic matter, along with pore space between these components. One of the sources of disparity in the porosity values reported by different laboratories is likely because of the way the term “porosity” is defined and used. Some laboratories report a “total (dry) porosity” which is the pore space that holds the hydrocarbons, mobile water, and irreducible water composed of capillary and surface claybound water; whereas others report an “effective” or “humidity-dried” porosity that does not include the pore space occupied by the surface (or interlayer) “clay-bound” water. Unfortunately, the measurement of the “clay-bound” water may not be very accurate or precise due to variable definitions or conditions under which it is measured (e.g., temperature, humidity), rendering the term difficult to transform from a quantitative “effective” porosity to a quantitative “total” porosity. It is widely accepted that core analysis of conventional rocks must be carried out at reservoir stress since rock properties measured in absence of stress are quite different from measurements at reservoir stress. The crushed-rock methods used for shale-gas formations (Luffel et al., 1992) provide fast results for porosity measurements. Recall that porosity measurements carried out in the absence of reservoir stress can be different from in-situ porosity. The same holds true for gas-filled porosity measurements that are also carried out on crushed rocks in the absence of reservoir stress.
Effective Pore space
Shale Matrix |
|
Total Pore space |
|
||
|
|
|
Non-clay minerals |
Organic |
Clay minerals |
|
Clay- |
|
|
Mobile |
|
Hydrocarbons |
|
|
|
|||||||
|
matter |
|
|
bound |
and |
|
|
||
|
|
|
|
water |
capillary |
|
|
||
|
|
|
|
|
|
|
bound |
|
|
|
|
|
|
|
|
|
water |
|
|
Figure 23 – Schematic of a clay-rich organic-rich rock solid, water, and hydrocarbons (modified after Eslinger and Pevear, 1988). Note that structural hydroxyl (OH-) “water” is not considered here because it is not part of the total porosity of the rock, even though it affects the response of the neutron log.
|
16 |
|
|
|
1.00E-03 |
|
14 |
|
|
|
|
Reported Porosity (p.u.) |
12 |
|
|
received permeability(mD) |
1.00E-04 |
10 |
|
|
|
||
8 |
|
|
1.00E-05 |
||
6 |
|
|
|
||
4 |
|
|
1.00E-06 |
||
|
|
|
|
||
|
2 |
|
|
As- |
|
|
|
|
|
|
|
|
0 |
|
|
|
1.00E-07 |
|
1 |
2 |
3 |
4 |
|
Sample #
1 |
2 |
3 |
4 |
Sample #
Figure 24 – a) Comparison of “crushed rock” porosity values from three different commercial laboratories.
b) As-received permeability values reported by the same commercial laboratories on splits from the same samples.