

Biomedical EPR Part-B Methodology Instrumentation and Dynamics - Sandra R. Eaton
.pdfDIGITAL DETECTION BY TLSS IN EPR |
221 |
instantly. Raw data will be stored, permitting sophisticated off-line analysis. Specialized software for this analysis will be developed with plug-in capabilities that facilitate sharing of analysis programs.
At the present level of digital technology, Class 3 digital receivers are a practical approach: namely conversion to an intermediate frequency carrier that can be sampled in a time-locked manner. State-of-the-art A/D chips are often available on so-called “development boards” that are very flexible and well-suited for use in EPR spectrometers. A possible disadvantage for Class 3 digital detection is the cost of frequency synthesizers as well as subtle issues of noise generated during the numerous multiply and divide operations that are necessary to create a specific frequency. However, the quality of frequency synthesizers is steadily improving and the costs are dropping.
Sampling rates and bandwidths of A/D converters are increasing. Sampling rates of 10 GSPS (gigasamples per second) at 8-bit resolution are within reach, if not already realized. In a recent search of the Internet, we found a report of a proof-of-concept device with 8 GSPS. Direct Class 4 EPR detection at X-band will be a reality, it is predicted, within the next five to ten years. This will eliminate the need to generate the intermediate and sampling frequencies, thereby reducing the need for frequency synthesizers, increasing the bandwidth, lowering the cost, and possibly reducing noise levels.
Direct Class 4 digital detection at higher microwave frequencies, Q-band and above, probably will remain out of reach for a decade or more. Class 3 digital detection will be required for spectrometers operating at these frequencies, possibly using an intermediate frequency as high as X-band.
7.REFERENCES
Bates, P.C. (1999) A Simple Method Measures the Coherence of Phase Locked Devices, RF Design, July 1999, p. 70.
Berliner, L.J., Eaton, G.R. and Eaton, S.S. (2000). Distance Measurements in Biological Systems by EPR, Biol. Magn. Reson. 19
Dell’Aera, S. and Riley, T. (2002) A Hybrid Fractional-N Synthesizer for Direct Modulation Applications, Appl. Microwave & Wireless, 14:7, 34-39.
Fantanas, C. (1992) Introduction to Phase Noise, RF Design, August 1992, pp. 50-57. Froncisz, W., Camenisch, T.G., Ratke, J.J. and Hyde, J.S. (2001) Pulse Saturation Recovery,
Pulse ELDOR and Free Induction Decay EPR Detection Using Time-Locked Subsampling. Rev. Sci. Instrum. 72, 1837-1842.
Galani, Z. and Campbell, R.A. (1991) An Overview of Frequency Synthesizers for Radars,
IEEE Trans. MTT, 39, 782-790.
Goldberg, B.-G. (1999) Analog and Digital Fractional-n PLL Frequency Synthesis: A Survey and Update, Applied Microwave and Wireless, 11:6,32-42.
Hyde, J.S. (1979) Saturation Recovery Methodology. In Kevan, L. and Schwartz, R. N. (eds), Time Domain Electron Spin Resonance, pp. 1-30. Wiley & Sons, New York.

222 JAMES S. HYDE ET AL.
Hyde, J.S. (1998) Saturation Recovery. In Eaton, S. S., Eaton, G. R., and Salikhov, K. M. (eds), Foundations of Modern EPR, pp. 607-618. World Scientific Publ., New York.
Hyde, J.S., Froncisz, W. and Mottley, C. (1984) Pulsed ELDOR Measurement of Nitrogen  in Spin Labels. Chem. Phys. Lett. 110, 621-625.
Hyde, J.S., Pasenkiewicz-Gierula, M., Jesmanowicz, A., and Antholine, W. E. (1990). Pseudo Field Modulation in EPR Spectroscopy. Appl. Magn. Reson. 1, 483-496.
Hyde, J. S., Jesmanowicz, A., Ratke, J. J., and Antholine, W. E. (1992) Pseudomodulation: A Computer-Based Strategy for Resolution Enhancement. J. Magn. Reson. 96, 1-13.
Hyde, J.S., Strangeway, R.A., Luglio, J., Mchaourab, H.S. and Froncisz, W. (1995) Noise in EPR Bridges with Multiple Time-Locked Microwave Frequencies, Bull. Magn. Reson., 17, 54-60.
Hyde, J.S., Mchaourab, H.S., Camenisch, T.G., Ratke, J J., Cox, R.W. and Froncisz, W. (1998). Electron Paramagnetic Resonance Detection by Time-Locked Subsampling. Rev. Sci. Instrum. 69, 2622-2628.
IFR Systems Product Brochure (2001) 2040, 2041, 2042 Low Noise Signal Generator www.ifrsys.com, 4, July 2001.
King, R.J. (1978) Microwave Homodyne Systems, Peregrinus Ltd. on Behalf of the Institution of Electrical Engineers, Herts, England.
Maas, S.A. (1993) Microwave Mixers,  Ed., Artech House, Boston, p. 280.
Murugesan, R., Afeworki, M., Cook, J.A., Devasahayam, N., Tschudin, R., Mitchell J.B., Subramanian,, S. and Krishna M.C. (1998). A Broadband Pulsed Radio Frequency Electron Paramagnetic Resonance Spectrometer For Biological Applications. Rev. Sci. Instrum. 69, 1869-1876.
Owen, D. (2001) Fractional-N Synthesizers, Microwave Journal, 44:10, pp. 110-121.
Pozar, D.M. (2001) Microwave and RF Wireless Systems, Wiley & Sons, New York, pp.
268-271. |
|
|
|
Schwieger, A. and Jeschke, G. (2001). |
Principles |
Of Pulse Electron Paramagnetic |
|
Resonance, Oxford University Press, New York. |
|
|
|
Smith, J.R. (1998) Frequency Synthesizers, |
in Modern |
Communication Circuits, |
ed., |
WCB McGraw-Hill, Boston, pp. 407-411.
Stavenick, P. (2002) Synthesizers Offer Submicrosecond Switching, Microwaves and RF, June 2002, pp. 98-102.
Stormont, R.S., Anas, M.C., Pelc, N.J. (1991) U.S. Patent No. 4,992,736, Serial No. 289456, issued Feb. 12, 1991.
Strangeway, R.A., Mchaourab, H.S., Luglio, J., Froncisz, W. and Hyde, J.S. (1995) A General Purpose Multiquantum Electronic Paramagnetic Resonance Spectrometer, Rev. Sci. Instrum., 66, 4516-4528.
Stremler, F.G. (1979) Introduction to Communication Systems, Addison-Weseley Publishing Co., Reading, MA, p. 225.
Subramanian, S., Murugesan. R., Devasahayam, N. Cook, J.A., Afeworki, M., Pohida, T., Tschudin, R.G., Mitchell, J.B. and Krishna, M.C. (1999). J. Magn. Reson. 137, 379-388.
Yates, W. (1982) Meeting Today’s Stringent Requirements: Synthesized Signal Generators, Electronics Products, Oct. 25,1982, pp. 71-74.
Zverev, A.I. (1967) Handbook of Filter Synthesis. Wiley & Sons, New York.
Chapter 8
Measurement of Distances Between Electron Spins Using
Pulsed EPR
Sandra S. Eaton and Gareth R. Eaton
Department of Chemistry and Biochemistry, University of Denver, Denver, Colorado 80208
Abstract: Distances between unpaired electrons ranging from ca. 15 Å to > 50 Å can be measured by pulsed electron paramagnetic resonance (EPR) techniques. Techniques are available to measure distances between two slowly relaxing centers or between a rapidly relaxing center and a slowly relaxing center. An overview of these methods is provided with an emphasis on recent examples that demonstrate the power of these techniques.
1.INTRODUCTION
Fundamental to current thinking about molecular biology is the relationship between structure and function, and the time-dependence of both. How do proteins fold, how do molecules assemble into multimolecular units, how do species cross membranes? Answers to these, and similar questions, require measurement of distances between sites in a protein and the time dependence of those distances. EPR provides a unique insight into distances between locations in biological systems and can be applied to any system with two paramagnetic centers, provided the distance falls within the ranges discussed below. There is no need to have single crystals, as for x-ray crystallography, and no limit on molar mass, as for NMR spectroscopy. Since the electron magnetic moment is much larger than the nuclear magnetic moment, much larger distances can be probed by EPR than by NMR. Samples do not need to be in solution; they may be suspensions or films. Some systems have two intrinsic paramagnetic centers. Alternatively, site-directed spin labeling can be used to place nitroxyl radicals at the locations one wants to study on a single molecule, or
223
224 |
SANDRA S. EATON AND GARETH R. EATON |
in an assembly of molecules, and the distance between the spin labels can be measured as a function of relevant parameters. Metal sites also can be introduced by site directed mutagenesis (Regan, 1993; Voss et al., 1995; Lu and Valentine, 1997; Lu et al., 2001). Some disadvantages of EPR for distance measurements are that distances must be studied one-by-one and that the probes have significant size and flexibility that may cause uncertainty in relating spin-spin distance to the distance between protein backbone atoms. However, molecular modeling and increased understanding of probe conformations hold promise for interpreting the interspin distances (Borbat et al., 2002), Also, the pulse methods discussed in this chapter require immobilization of the sample both to prevent motional averaging of small dipolar couplings and to make spin echo dephasing times as long as possible.
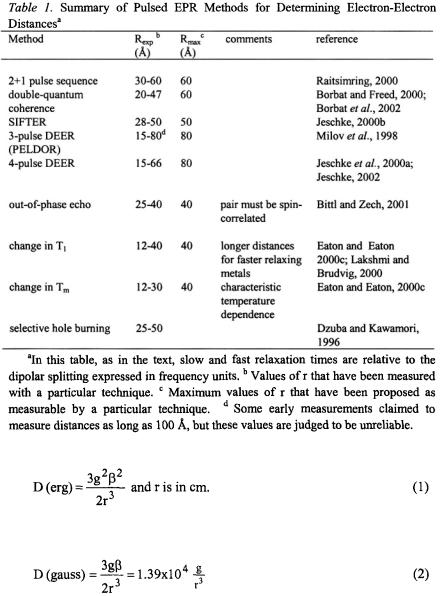
Many CW and pulsed EPR methods for measuring distances between unpaired electrons are reviewed in Biological Magnetic Resonance, vol 19 (Berliner et al., 2000). As discussed in the introductory chapter in that volume (Eaton and Eaton, 2000a), a range of CW methods can be used to determine distances up to about 20 Å, depending upon the linewidths in the spectra. Pulse methods are required to measure longer distances. Volume 19 includes discussions, with references to the literature through 1999, of distance measurements by saturation recovery (Eaton and Eaton, 2000c; Lakshmi and Brudvig, 2000), double quantum ESR (Borbat and Freed, 2000), the 2+1 pulse sequence (Raitsimring, 2000), and the out-of-phase echo (Dzuba and Hoff, 2000). This chapter provides an overview of distance measurements by pulse methods (Table 1), with an emphasis on recent examples that demonstrate the power of these techniques.
2.FUNDAMENTAL PRINCIPLES OF INTERACTION BETWEEN ELECTRON SPINS
Measurement of the distance between paramagnetic centers relies upon determination of the dipole-dipole interaction, which is a through-space interaction. A complete description of the dipolar interaction requires inclusion of g anisotropy. However, if it is assumed that the g values are isotropic, the dipolar splitting of an EPR signal can be expressed in terms of the parameter D, where D is the splitting of the signal, in the limit of strong exchange interaction, when the interspin vector is perpendicular to the external magnetic field and -2D is the splitting when the interspin vector is parallel to the external magnetic field (Luckhurst, 1976). In a randomly oriented sample, this results in a classic “Pake pattern” where, in the ideal
MEASUREMENT OF DISTANCES BETWEEN ELECTRON SPINS |
225 |
case, the value of D can be read from the splitting between the intense perpendicular turning points.
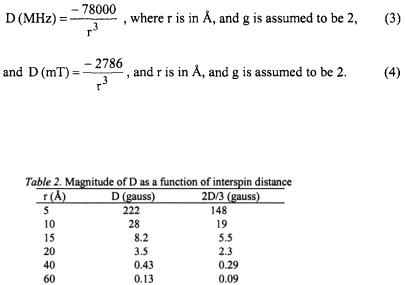
Conversion of units from erg to gauss gives
where r is in Å, the g value for one of the unpaired electrons is assumed to be 2.00 and the g value for the second unpaired electron is entered explicitly.
226 |
SANDRA S. EATON AND GARETH R. EATON |
D can also be given in the following units.
To calibrate our thinking about the ways in which dipolar couplings are measured, it is useful to consider the magnitude of D for various interspin distances as shown in Table 2.
When the exchange interaction is less than the separation between the resonance frequencies for the two paramagnetic centers (the weak exchange limit), the dipolar splitting that is observed for a Pake pattern is 2D/3, which is designated by some authors as d (Jeschke, 2002). When d is expressed in frequency units it is called the dipolar frequency. As discussed below, the weak exchange limit pertains at the distances currently measured by pulsed methods.
Electron-electron interaction also has an exchange contribution that depends upon the overlap of the orbitals that contain the unpaired electron (Coffman and Buettner, 1979; Eaton and Eaton, 1988). Measurement of a distance requires separation of the exchange and dipolar contributions. Since electron delocalization is strongly dependent on the electronic structure of the paramagnetic center, it is difficult to make generalized predictions concerning the distance dependence of the exchange interaction. Coffman and Buettner (1979) proposed a “limiting” function that predicted the longest distance at which exchange interaction of a particular magnitude would be observed. Other limiting functions for exchange interaction are discussed by Jeschke (2002). Depending upon the data that are considered, these models indicate that exchange interactions become much smaller than dipolar interactions at distances greater than 10 to 15 Å. As discussed below, pulse measurements currently are used for distances greater than about 15 Å so exchange interactions usually can be neglected in analyzing the spin-spin
MEASUREMENT OF DISTANCES BETWEEN ELECTRON SPINS |
227 |
interactions measured by pulsed techniques. Two types of systems that may not fit these generalizations are unpaired electrons in delocalized molecular orbitals (Eaton and Eaton, 2000a) and proteins that are optimized for electron transfer.
Nitroxyl radicals with normal isotopic abundance typically have frozensolution (powder) linewidths of 6-8 gauss. Replacement of hydrogen with deuterium narrows the lines by about a factor of two. Comparison of these widths with values of 2D/3 (Table 1) indicates that for distances greater than about 20 Å the dipolar interaction is small compared with typical spin label linewidths, which puts an upper limit on distances that can be measured by CW EPR. In contrast, typical values of the spin-echo dephasing time constant,  for nitroxyl radicals at temperature below about 80 K are about
 which corresponds to a spin packet linewidth of about 30 mG. Dipolar interactions that are small compared to CW linewidths are significant compared with spin-packet linewidth, which makes pulse techniques advantageous for measurements of longer interspin distances. In addition, the spin-lattice relaxation time,
  is much longer than
  in typical immobilized samples of nitroxyl radicals. Consequently, changes in either
 or
or  can be sensitive indicators of spin-spin interactions in distance regimes where CW lineshape changes are too small to detect.
3.DISTANCE BETWEEN TWO SLOWLY RELAXING CENTERS
A variety of pulse sequences have been developed to measure dipolar interactions between slowly relaxing centers. The dipolar coupling is proportional to  (eq. 1) so the dipolar frequencies observed in these experiments vary as
  Experiments that use a single microwave frequency include the “2+1” sequence (Raitsimring, 2000), single-quantum coherence (Borbat and Freed, 2000), and the SIFTER sequence (Jeschke, 2000b). A comparison of these techniques was provided by Jeschke (2002). To separate the excitation of the “observed” and “neighboring” coupled spins, pulse sequences have been developed that use two microwave frequencies. The terms 3-pulse DEER (double electron-electron resonance) and PELDOR (pulsed electron-electron resonance) are used by different groups to refer to the same experiment in which the amplitude of a 2-pulse spin echo is perturbed to varying extents by an additional pulse at a second microwave frequency, for which the timing relative to the other pulses is varied. These 3-pulse experiments (as in the 2+1 sequence) have an experimental deadtime that prevents observation of the rapid loss of coherence that is characteristic of short interspin distances. This deadtime is avoided in the 4-pulse DEER

228 |
SANDRA S. EATON AND GARETH R. EATON |
experiments (Jeschke et al., 2000a). Spiess and co-workers (Jeschke, 2002) have applied this tool to studies of synthetic polymers, but their results are directly transferable to biopolymers and assemblies of biomolecules. An important advantage of the DEER and double quantum coherence methods is that the modulation arises only from dipolar coupled spins so these measurements are less susceptible to interference from singly-labeled protein than CW measurements. Another very important aspect of the analysis of the data obtained by these pulse measurements is the development of methods to determine not just distances, but also distributions in these distances (Jeschke et al., 2002; Pannier et al., 2000).
A special case occurs for spin-correlated pairs as in light-induced radical pairs, for which a phase shifted “out-of-phase” spin echo signal can be observed (Bittl and Zech, 2002). The echo exhibits intensity modulation as a function of the time between the pulses. The frequency of this modulation is characteristic of the distance between the two centers.
4.DISTANCE BETWEEN A SLOWLY RELAXING CENTER AND A RAPIDLY RELAXING CENTER
Dipolar coupling between a slowly relaxing center and a more rapidly relaxing center, typically a metal ion, enhances the spin lattice relaxation for the slowly relaxing center (Eaton and Eaton, 2000c; Lakshmi and Brudvig, 2000). Long-pulse saturation recovery (see chapter 1) is the method of choice for measuring spin-lattice relaxation rates for the slowly relaxing center in the absence and presence of a rapidly relaxing metal, because the long pulses can mitigate the effects of competing spectral diffusion processes including nuclear spin relaxation and cross relaxation (Eaton and Eaton, 2000b; Harbridge et al., 2003). When the relaxation rate for the slowly relaxing center in the absence of interaction, and the relaxation rate for the metal are known, the interspin distance and relative orientations of the magnetic axes for the interacting spins are the only adjustable parameters and the effect of the metal on the saturation recovery curves for the radical can be simulated to determine the interspin distance (Zhou et al., 2000). When the relaxation rate for the metal is not known, distances can be determined by comparison of the relaxation enhancement with that for similar systems for which the metal-radical distance is known. The perturbation of the electron spin relaxation of the radical by the metal depends on the square of the dipolar matrix elements and therefore varies as
When the metal relaxation rate is comparable to the dipolar splitting expressed in frequency units, the electron spin relaxation of the metal is an
MEASUREMENT OF DISTANCES BETWEEN ELECTRON SPINS |
229 |
effective spin-echo dephasing mechanism for the slowly relaxing center, analogous to intermediate exchange in NMR (Eaton and Eaton, 2000c). The rate of 2-pulse spin echo dephasing is enhanced and echo amplitude at constant pulse spacing is decreased. These effects can be analyzed to determine the interspin distance.
5.SOME PRACTICAL CONSIDERATIONS
For most of the pulse techniques discussed in this chapter, spin concentrations in the range of 0.2 to 0.5 mM are optimal for distances up to about 50 Å. Lower concentrations can be used, but may require extensive signal averaging. As the target distance becomes longer, it becomes necessary to use increasingly low sample concentrations to ensure that the intramolecular spin-spin distance of interest is significantly shorter than the average random distance between spins in the sample. A fundamental limit will be the spectrometer sensitivity at these low spin concentrations. The spin echo dephasing time,  also contributes to limitations. As the interspin distance increases, the dipolar frequency decreases, which means that the period for the corresponding oscillation increases. The longer the period of the oscillation, the longer the time that is required between the pulses that form the echo or detect the coherence. The shorter the value of
  the more the echo intensity decreases as the time between the pulses is increased. Thus the echo intensity becomes smaller for the same long interspin distances that require low concentrations to minimize intermolecular interactions. In favorable situations, however, it seems feasible to measure distances as large as 80 Å. Measurements of shorter distances (closer to 20 Å) can be made more readily at lower concentrations than measurements of long distances, because the higher dipolar frequencies can be adequately defined with shorter interpulse spacings.
When a solvent crystallizes there is a tendency to form regions with locally-high solute concentration, which enhances intermolecular spin-spin interaction. To minimize solvent crystallization, solvents or solvent mixtures are selected that form glasses, or cryoprotectants such as sucrose or glycerol are added to water to decrease the tendency to crystallize.
Although each of the pulse methods was developed in a research lab using locally-available instrumentation, many of the methods now can be performed on the commercially-available Bruker Elexsys spectrometers. Realistically, a person who is exploring the use of one or more of these pulse methods for measuring distances would be well advised to take samples to a lab that has some experience with the method to obtain their initial results.
230 |
SANDRA S. EATON AND GARETH R. EATON |
6.RECENT EXAMPLES FOR DISTANCES BETWEEN TWO SLOWLY RELAXING RADICALS
6.1Spin-Labeled T4 Lysozyme (Borbat et al., 2002)
Eight double-cysteine mutants of T4L were spin-labeled with methanethiosulfonate spin label (MTSSL). Sucrose was added to the solutions as a cryoprotectant. Interspin distances were measured with the 6- pulse double quantum coherence sequence, which is essentially dead-time free. Due to limitations on the accessible temperature range for the spectrometer, experiments at Ku-band (17.35 GHz) were performed at ca. 200 K which is a local maximum in the temperature dependence of nitroxide  The short
  (300 to 350 ns) at this temperature limited the Ku-band experiments to samples with shorter distances. For the double quantum coherence experiments, optimal results are obtained when
  excites the full dipolar coupled spectrum, which requires high-power microwave amplifiers and resonators with large
  per square root of watt incident on the resonator. The higher
  that was available on the Ku-band spectrometer (about 30 G), relative to the
  available at X-band, was important for characterization of the shorter interspin distances. Experiments at X-band (9.2 GHz) were performed at 77 K where
  is about
  The available
  on the X-band system (about 11 G) was adequate for samples with interspin distances greater than 30 Å. Fourier transformation of the double quantum coherence signals gave the dipolar spectrum. Distinctive features in the shapes of the dipolar spectra permitted characterization of distribution widths and characterization of multiple conformations of the spin labels. Average distances between 29 and 47 Å with distribution widths of 1.0 to 2.7 Å were observed. It was shown that a relatively small number of these long distance constraints could define the three-dimensional conformation of the protein.
6.2Conformation of Doubly Spin-Labeled Peptide (Milov et al., 2001)
An analog of the antibiotic trichogin GA IV was prepared that contained two spin labels, 7 amino acids apart. The spin label was TOAC, which is an analog of the amino acid  and contains less flexible linkages than the more commonly-used MTSSL label. Three-pulse DEER was used to characterize the conformation of the peptide in glassy toluenechloroform solutions at 77 K. Experiments were performed at X-band with a bimodal resonator, using microwave frequencies separated by about 100