

Biomedical EPR Part-B Methodology Instrumentation and Dynamics - Sandra R. Eaton
.pdfDIGITAL DETECTION BY TLSS IN EPR |
201 |
Class 1, Fig. 1, is homodyne detection of the microwave signal followed by A/D conversion. See King (1978) for a discussion of homodyne detection. One can detect either dispersion or absorption, but not both, in the circuit shown by changing the phase of the reference arm microwaves at frequency  However, since the LNA establishes the noise floor, quadrature detection could be used without an SNR penalty. Signal processing, including phase sensitive detection if it is needed, is carried out in a computer after the A/D converter. The signal amplifier (Sig Amp) should have level gain and constant time delay over the frequencies described by
  where FT is a Fourier Transform of the output of the diode detector. Class 1 detection has been used extensively by us for saturation recovery EPR. The greatest technical difficulty has been design of the Sig Amp and the aa lowpass filter. They both should have a flat amplitude response and a linear phase response for many octaves. The Sig Amp is AC coupled and attenuates frequencies below the repetition rate of the saturating pulses. There can be a tendency for signal “droop” to occur in the time domain display from attenuation and phase shift of low frequencies. The lowpass response of the aa filter is determined by the sampling frequency
  and must attenuate frequencies beyond the Nyquist limit to prevent aliasing effects.
Class 2, Fig. 1, is superheterodyne detection. As in the case of homodyne detection, additional circuitry is required to detect both dispersion and absorption. The primary benefit of this scheme, relative to homodyne detection, is the flexibility gained in distributing gains between the LNA, IF amplifier, and signal amplifier. Level response across the chain of amplifiers and filters can be an engineering challenge. Selection of dispersion or absorption can be made in two ways, changing the phase of 
 or of
or of  which are functionally equivalent. A central rationale for the Class 2 circuit is reduced sensitivity to low frequency noise originating in the diode detector, compared with homodyne detection. This was a more serious problem, historically, prior to the introduction of LNAs. The image reject (IR) bandpass filter rejects noise at the IF image frequency. Use of an IR IF mixer is an alternative to IR filtering. Both methods can be used simultaneously. The choice between these alternatives involves tradeoffs that are determined by center frequency, bandwidth and required rejection of the image frequency band (see Section 5 of this chapter for additional details). The aa bandpass filter cuts off at the Nyquist limit
  as is also the case for Class 1.
Class 3, Fig. 1, is time-locked A/D detection of an intermediate frequency carrier, the primary subject of this article. It might be considered to be a modern version of superheterodyne detection. In this method, the information-of-interest is centered about the IF carrier. Since the A/D

202 |
JAMES S. HYDE ET AL. |
sampling frequency, |
is time locked to the carrier, changes in IF phase can |
be detected and both dispersion and absorption can be detected by digital signal processing. Both time-locked subsampling (TLSS) (i.e., four times in an odd number of IF cycles – say five) and time-locked oversampling (TLOS) (i.e., sampling many times per IF cycle) are possible. A significant benefit of this method is that the aa filter is bandpass and centered on the IF. If the IF is appropriately chosen, this filter can be relatively broad in absolute units but nevertheless narrow – say a Q of 10 – relative to the IF. This is a favorable situation for filter design.
A design that is closely related to Class 3 has been published by Murugesan et al. (1998) and by Subramanian et al. (1999) for use at 300 MHz. Data is converted to an IF of 50 MHz and oversampled using a high speed A/D converter that is not time-locked.
Class 4, Fig. 1, is direct digital detection of the microwave EPR signal, almost certainly using TLSS. It would appear to be technically feasible with current technology for a microwave frequency of 1 GHz and less, which might be practical for small animal in vivo EPR studies. EPR detection based on the Class 4 scheme has not yet been demonstrated. It can be expected to be more robust and less costly than the other classes of digital detection because fewer synthesizers and mixers are required.
A central rationale of each of these four schemes is broadband digital detection followed by digital filtering. The amplitude is uniform and the phase shift is linear across the bandwidth of interest. The aa filters for Class 3 and 4 may perform better than those for Class 1 and 2. Nevertheless, the homodyne scheme of Class 1 is better than the older analog methods employing phase-sensitive detection when using 100 kHz field modulation for experiments involving EPR of transient species. This is because filtering for adequate SNR is done digitally after A/D conversion.
Since nearly all EPR experiments can be characterized as producing a number of signals at the fundamental of a basic repetition rate and the harmonics of this rate, and the bandwidth can be large in Class 3 and Class 4 schemes, simultaneous capture of all harmonics is feasible. If the number of expected frequencies is small, for example, when using field modulation, it may be more convenient to process the digitized time series by cross correlation with the known sinusoidal waveform and a few of its harmonics, performing this operation at each field point, to arrive eventually at spectra corresponding to the first, second, third, etc. harmonics. Filtering by Gaussian smoothing, for example, provides a digital equivalent for each spectrum of the “time constant” in conventional phase-sensitive detection. This would seem to be an ideal way to investigate phase shifts arising from passage effects when using field modulation. If the number of harmonics is large, it may be more convenient to process the digitized time series by
DIGITAL DETECTION BY TLSS IN EPR |
203 |
taking a Fourier transform, which is, in fact, the cross correlation of the signal with cosines and sines at the fundamental and all harmonics. This is not unlike having thousands of phase-sensitive detectors available with consistent relative gains and perfect phasing. However, because all data are digitized, optimization of the digital filter for each spectrum can be done retrospectively. There are four possible spectra for each harmonic and two relevant phases: microwave phase corresponding to dispersion and absorption, and field modulation phase. Information regarding both phases is captured simultaneously for all harmonics when using Class 3 and Class 4 schemes.
2.TIME LOCKING AND SUPERHETERODYNE DETECTION – EPR INSTRUMENT-DESIGN BACKGROUND
All frequencies in a magnetic resonance instrument, whether NMR, MRI, or EPR, should in principle be phase locked to a single master oscillator. Departure from this rule can give rise to some degree of degraded instrument performance. The rationale for this design rule is that our instruments have extremely low noise and are becoming increasingly complex. If two frequencies in the system are not locked, they (or their harmonics) can beat as well as mix. The only general way to avoid this without analyzing every detail of instrument design and use is to lock all frequencies.
In the case of superheterodyne spectrometers, the microwave oscillator itself serves as the master oscillator. For detection, the RF is converted to an intermediate frequency. Since the phase and frequency of the IF are known, the IF becomes the surrogate “master oscillator.” If all frequencies are time locked to the IF, including for example, the sampling rate and the field modulation frequency or, in the case of pulse EPR, pulse timing frequencies, the rule is satisfied.
This technique works extremely well for CW EPR when used with low microwave power incident on the sample cavity. At higher power, superheterodyne EPR spectrometers become difficult to use. This stability problem seems to have its origin primarily in the fact that as the microwave power is increased, it is necessary to balance the microwave bridge ever more closely in order not only to avoid saturation of the IF amplifier, but also to satisfy the condition that the EPR microwave signal and its microwave carrier be much less than the local oscillator level at the IF mixer. (See Fig 1, Class 2.) This results in enhanced sensitivity to: i) microphonics in the low audio frequency range, noting that field modulation frequencies used in the early instruments were in this range, ii) klystron
204 |
JAMES S. HYDE ET AL. |
phase noise, noting that this was poor in the klystrons used in the immediate post-WWII period, and iii) thermal instability of the cavity and microwave circuit.
Homodyne detection using 100 kHz field modulation became the dominant EPR instrumental configuration beginning about 1960. Success was based on several technological advances: i) Microwave detector diodes exhibit noise with a dependence on frequency that varies approximately as 1/f. A rationale for superheterodyne detection had been that the intermediate frequency was high enough that this noise source was insignificant. Development of improved detector diodes permitted use of field modulation at frequencies as low as 100 kHz without serious impact from 1/f noise, ii) A second generation of klystrons had been developed with reduced phase noise, and iii) most mechanical structures, including microwave circuits at X-band, are acoustically “insensitive” at 100 kHz, eliminating much of the microphonics problem.
The hypothesis of this article, and indeed much of the work of the authors for the past five years, is that the pendulum for EPR spectrometer design is now swinging back to superheterodyne detection. This is based on rapid developments in digital technology including readily available high performance personal computers, advances in microwave synthesizers and high speed A/D converters with high vertical resolution. It is also based on an increased awareness in magnetic resonance system design of the need for locking every frequency in the system to a single master oscillator. We are convinced that this hypothesis is correct and that digital detection will eventually become dominant, both for CW and for pulse EPR. The shift from homodyne detection will be driven by increasing awareness of the benefits of digital detection.
3.TIME-LOCKED SUBSAMPLING DETECTION FOR CW EPR
Our paper, Electron Paramagnetic Resonance Detection by Time-Locked Sub-Sampling (TLSS) (Hyde et al., 1998), establishes feasibility for application to CW EPR using sinusoidal field modulation. This paper is reviewed here. Time-locked subsampling detection is in use in MRI scanners manufactured by GE Medical Systems as described in their patent (Stormont et al., 1991), and commercial reliability motivated the work that led to Hyde et al., 1998. Our paper was the first to use TLSS in EPR and the first to use it for detection of periodically modulated signals in any application, to the best of our knowledge. Another significant distinguishing characteristic is that the MRI application is pulsed, i.e., the incident RF is off

DIGITAL DETECTION BY TLSS IN EPR |
205 |
during detection; in CW EPR it is on, which introduces a number of complications. Our paper is also the first paper using TLSS in magnetic resonance, since no paper was written by GE scientists on this subject.
Figure 2. Microwave bridge with TLSS detection (see Hyde et al., 1998).
Figure 3. Block diagram ofthe frequency synthesizer array.
Figures 2 and 3 are schematics of the method used in Hyde et al., 1998. The microwave circuit diagram (Fig. 2) shows four signal inputs:  (the microwave frequency),
  (the intermediate frequency),
  (the A/D converter sampling frequency), and
  (the field modulation frequency). Three of these,
  and
and  are time locked, but the fourth frequency,
  is free running as illustrated in Fig. 3.
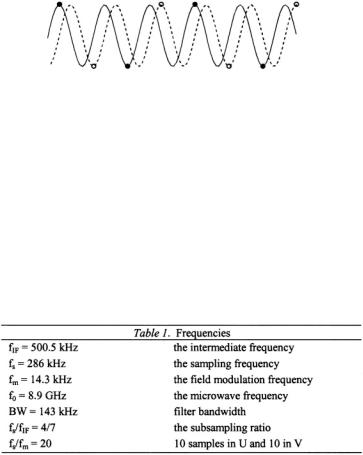
The novel aspect of TLSS is the use of a time-locked sampling rate that is four times in an odd number of cycles, typically 3, 5 or 7. Figure 4 indicates this main idea for three cycles (although seven were used in Hyde et al., 1998): the solid sinusoidal waveform is the real part of the IF carrier and the dotted waveform is the imaginary part. Every dot, both open and
206 |
JAMES S. HYDE ET AL. |
filled, is a sample point. One can see that there are four samples in three cycles. The filled dots sample the real waveform and the open dots the imaginary waveform. These digitized data go to a PC (Fig. 2), where the data points corresponding to the filled dots are separated from the points corresponding to the open dots. Thus I and Q, or absorption and dispersion, are in separate memory locations. The sign of every other data point in I is changed, and similarly for Q. We call this process of I and Q formation and sign reversal the “word shuffle.” It constitutes detection of the envelope of the IF carrier. To summarize, I and Q EPR signals at the field modulation frequency started out as periodic modulations of a microwave carrier that are translated to an IF carrier, and then separated and detected using time-locked sampling with subsequent manipulation by a PC.
Figure 4. TLSS detection, sampling four times in three cycles.
A carefully designed bandpass filter (Fig. 2) is required. This filter must have a bandwidth less than  consistent with the Nyquist condition. The usual filter for an A/D converter is a low pass filter cutting off at half the sampling rate. For TLSS, the filter is centered at the IF frequency and has a bandpass width of less than half the sampling rate. An appropriate A/D converter board for TLSS must have an input frequency response that is consistent with the desired IF and bandpass width.
There are a number of constraints on the choice of  and
and  If the A/D conversion rate and either the number of harmonics or the field modulation frequency are fixed, other parameters are predetermined. Table 1 shows the frequencies that were used in Hyde et al., 1998. Frequencies must be carefully selected such that ratios are terminated fractions, i.e.,
DIGITAL DETECTION BY TLSS IN EPR |
207 |
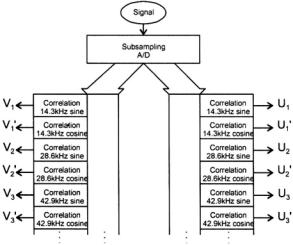
The essence of TLSS detection is broadbandedness followed by digital filtering with essentially perfect internal consistency between I and Q (which is the main claim in the GE patent (2). All information that can pass the input bandpass filter is preserved in broadband form until the process of cross-correlation is performed. All harmonics of field modulation are in essentially perfect internal consistency with respect to amplitude and phase (Fig. 5). If information is time varying because of, for example, signal decay, time constants can be extracted by suitable analysis in the PC if this information can pass the input bandpass filter. Digital filtering can be optimized retrospectively.
Figure 5. Schematic of information flow when using TLSS detection for SW EPR with field modulation.
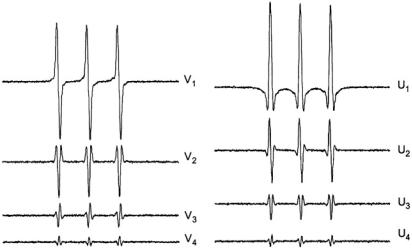
Figure 6 shows eight spin label spectra that were acquired simultaneously in a single sweep of the magnetic field using TLSS detection: dispersion and absorption, first four harmonics in phase. A field modulation amplitude of 1.5 G at 14.4 kHz was used along with an estimated microwave field intensity at the sample in the rotating frame of 0.2 G. The incident microwave power on the loop gap resonator was 1 mW. The peak-to-peak line width for the sample ( M TEMPO in
  at room temperature) using a low field modulation amplitude is 1.2 G. Under the conditions used to obtain Fig. 6, the modulation amplitude is close to the value that yields the largest possible first harmonic signals,
  The noise is about the same for both dispersion and absorption, and was independent of incident microwave power under the conditions used to obtain Fig. 6. The limiting noise source was not firmly established in Hyde et al., 1998, but it was felt that noise was determined by the noise figure of the low noise microwave amplifier (Fig. 2).
208 |
JAMES S. HYDE ET AL. |
Figure 6. Example of eight spectra of a nitroxide radical spin label produced using TLSS
detection in a single sweep of the magnetic field. The notation is defined in Fig. 4.
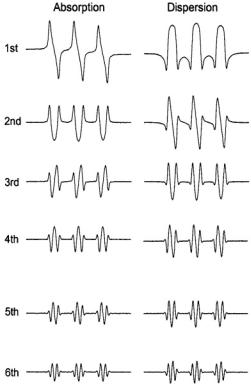
The overall SNR compared with conventional homodyne detection using 14.3 kHz field modulation frequency was about the same, extrapolated to estimates of the same effective integrating time constants. In unpublished work done at the time the work in Hyde et al., 1998 was carried out, the field modulation amplitude was increased. The amplitude of the higher harmonics (Fig. 7) increased, as expected. In the past, extreme overmodulation such as in Fig. 7 had always been avoided. Since pseudomodulation (Hyde et al., 1990, 1992) can be applied to a simulated spectrum to simulate these harmonics, and since they can now be collected experimentally using TLSS detection, data such as shown in Fig. 7 may turn out to be useful. These spectra are rich in information content.
DIGITAL DETECTION BY TLSS IN EPR |
209 |
Figure 7. Detected harmonics from a spin label using TLSS detection and severe overmodulation.
4.PULSE SATURATION RECOVERY USING TIMELOCKED SUBSAMPLING
Pulse EPR experiments can be divided into two broad classes: “driven” and “free precession.” The driven category is characterized by detection of the EPR pulse response using an observing CW microwave source. Saturation recovery (SR) is the most familiar type of driven pulse EPR. It involves measurement of the recovery of saturation arising from an intense microwave irradiating pulse using a weaker observing pulse. This subject is reviewed in the chapter 1 of this volume by Eaton and Eaton. See also Hyde (1979, 1998). There are other kinds of driven pulse EPR including: i) the response of the spin system when the observing power cannot truly be characterized as “weak,” ii) the response when the incident power is stepped up rather than down, iii) the response to a temperature jump as observed by
210 |
JAMES S. HYDE ET AL. |
an unchanging incident microwave power (so-called T-jump), iv) pulse electron-electron double resonance (ELDOR) where the transient response is induced by irradiating one transition and is observed by inspection of another transition, v) jumps in other experimental conditions such as pH, ionic strength, irradiating light level, potential across the sample, and more. The driven category can, alternatively, be labeled step-recovery. As a class, these experiments detect changes in  indirectly through changes in
  or
or  The time scale for these experiments is characterized by
Free-precession experiments include free induction decay (FID) and the many variants of spin echo (SE) EPR. The time scale for these experiments is characterized by transverse relaxation,  which is always shorter than
  Data collection in the ideal free-precession experiment is carried out in the absence of any microwave power incident on the sample, which eliminates several sources of noise or instability in the detection process. As a class, these experiments directly detect the time evolution of
  or
or  Freeprecession effects can occur in driven experiments, but can be suppressed by microwave phase modulation techniques (Huisjen and Hyde, 1974). The chapter by Freed in this volume gives additional information on pulse EPR. Berliner et al., 2000 contains extensive information on pulse EPR – see particularly Chapter 2, Relaxation Times of Organic Radicals and Transition Metal Ions, by Eaton and Eaton, in that volume. The recent monograph on pulse EPR by Schwieger and Jeschke (2001) provides a foundation for future progress in that field.
Froncisz et al. (2001) describes the first application of TLSS detection to pulse EPR. Two driven pulse experiments – saturation recovery and pulse ELDOR, and one free precession experiment – free induction decay, were described. The intermediate frequency,  was 187.5 MHz, the sampling frequency,
  was 250 MHz (i.e., three samples in four cycles), the overall bandwidth was 125 MHz, and the bandwidths for the separate I and Q channels were each 62.5 MHz. The apparatus employed four frequency synthesizers locked to a common 10 MHz clock. Reference 6 provides extensive technical detail. Experiments were conducted on nitroxide radical spin labels.
Figure 8a is a direct representation of the recovery of magnetization from strong saturation using a weak observing microwave power for 3.3 mM Tempo in 30% glycerol/water, not deoxygenated. It shows the temporal change of the microwave signal that is reflected from the resonator, noting that the microwave signal after translation to the subsampled intermediate frequency is actually displayed. Figure 8b is the conventional saturationrecovery display after signal processing. Namely, the sign of the extreme negative points in Fig. 8a is changed to positive and the resulting envelope is displayed. At this sample concentration, Heisenberg exchange is strong, and