

Biomedical EPR Part-B Methodology Instrumentation and Dynamics - Sandra R. Eaton
.pdf110 |
DEVKUMAR MUSTAFI AND MARVIN W. MAKINEN |
Hyperfine couplings of the vanadium center with  nuclei estimated on the basis of our EPR studies of nucleotide structure with
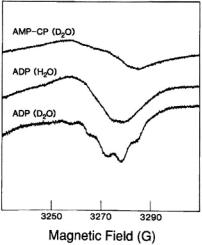
  as the paramagnetic probe have been amply confirmed through pulsed ESEEM and HYSCORE experiments (Dikanov et al., 1999, 2002). Fig. 9 shows the ligand hf structure underlying the
  absorption feature for a frozen solution containing excess ADP with respect to
  The resonance features in perdeuterated solvent
  exhibit a quintet pattern with 6.62 G interval spacings and approximate intensity ratio of 1:4: 6:4:1. Since ligand hfc produces a total of (2nI + 1) absorption lines, this hf pattern can be attributed only to n = 4 structurally equivalent (I = 1/2)
  atoms, in view of the stoichiometry of
  and ADP forming a complex with
  composition according to EPR titrations (Mustafi et al., 1992). This result demonstrates that
  is coordinated to the 5'- diphosphate groups of two nucleotides with the phosphate oxygens in the equatorial plane. Similar conclusions were drawn for
  complexed to adenosine
  and to ATP.
Figure 8. Stereo diagram showing how the ENDOR assigned structure of  is accommodated into a G-quartet. The structure of the vanadyl complex itself in monomers, quartets, and higher order aggregates was determined by ENDOR. The ENDOR based
  complex was then modeled into a G-quartet with use of the X-ray coordinates of
  (Kang et al., 1992). Reprinted from Jiang and Makinen (1995) with permission of the American Chemical Society.
As pointed out above, the  shf coupling of only equatorial ligands is observed as a broadening contribution to the EPR line width of
  complexes of nucleotides, and the weaker dipolar contributions of the axial solvent molecule are entirely masked. Assignments of tridentate triphosphate coordination to
  by ATP have been made recently on the basis of ESEEM investigations (Dikanov et al., 2002). While confirming our
ANGLE-SELECTED ENDOR |
111 |
estimates of  shf couplings for equatorially coordinated phosphate groups, obtained, for instance, through spectra as in Fig. 9, the authors state that we failed to consider the possibility of tridentate triphosphate coordination with ATP because
  solvent exchange did not result in a change in the EPR line width. As has been pointed out earlier, Albanese and Chasteen (1978) were the first to show that shf broadening by equatorial ligands dominates the lineshape, masking the dipolar contributions of axial solvent molecules. We know of no instance in which
  shf coupling from axial ligands has been observed in
  complexes structurally defined as tridentate triphosphate complexes by diffraction methods.
Figure 9.  shf structure associated with the
  absorption feature of the frozen solution EPR spectrum of
  complexed to ADP and adenosine
 (AMP-CP) in aqueous methanol (50:50 v/v) cosolvent mixtures. The nucleotide:vanadyl ratio was in excess of 2:1 to ensure saturation of
  with nucleotide ligand. Reprinted from Mustafi et al. (1992) with permission of the American Chemical Society.
3.2Nitroxyl Spin-Labels as Probes of Structured Solvent
3.2.1Assignment of conformation and structure on the basis of ENDOR constraints
The chemical bonding structure of nitroxyl spin-labels. Nitroxyl spinlabels are widely used in biophysical studies of macromolecules to characterize conformational changes and secondary structure (Hubbell et al., 1998; Langen et al., 2001), to measure inter-probe distances (Pfannebecker et al., 1996; Rakowsky et al., 1998; see Ch. 8 in this volume.), and to assess
112 |
DEVKUMAR MUSTAFI AND MARVIN W. MAKINEN |
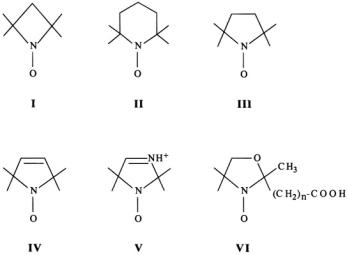
pH (Khramtsov and Weiner, 1988; Khramtsov and Volodarsky, 1998). Spinlabels are also used to determine the local concentration of molecular dioxygen in tissues by in vivo EPR imaging (Swartz and Halpern, 1998; see Ch. 11 and 12 in volume 23.). Structural formulas of nitroxyl spin-labels employed in biophysical studies are illustrated in Fig. 10. The diagram compares the variation in their cyclic structure as four-, five-, and sixmembered ring compounds, with heteroatoms in the ring, with totally saturated carbons, or with unsaturated olefinic bonds.
In general, spin-labels with saturated ring structures have interconverting conformers in solution, and their proton ENDOR spectra show only broadened, overlapping features (Mustafi et al., 1990c). Also, the fivemembered pyrrolidinyl spin-labels (III) consist of racemic mixtures because the C(3)-position, to which functional groups are covalently attached to the spin-label, constitutes a chiral center. Hitherto there has been only one investigation in which pyrrolidinyl spin-labels were resolved into their respective chiral enantiomers (Flohr and Kaiser, 1972; Ament et al., 1973). For p-nitrophenyl esters of 2,2,5,5-tetramethyl-1-oxy-pyrrolidine-3- carboxylic acid, that becomes the acyl moiety upon reaction with 
 to form an acylenzyme, rate-limiting deacylation was shown to be measurably different for the separated enantiomers of the spin-label probe. Also, through single crystal EPR studies, it was shown that the R(+)- acyl group was more favorably oriented for nucleophilic attack by the hydrolytic water molecule in the active site (Bauer and Berliner, 1979).
Figure 10. Schematic drawing of chemical bonding structures of four-, five-, and sixmembered nitroxyl spin-label compounds.
ANGLE-SELECTED ENDOR |
113 |
It is important in ENDOR studies that the spin-label is not associated with conformational equilibria and that the nitroxyl N–O group is structurally invariant with respect to the molecular x,y-plane of the spin-label within the thermal motion of the nonhydrogen atoms. For distance measurements, therefore, we have employed as ENDOR probes only derivatives of spin-label IV illustrated in Fig. 10. The atoms constituting the side chain attached at the olefinic C(3') position are essentially coplanar with the ring atoms according to X-ray data (Turley and Boer, 1972; Makinen et al., 1998) and exhibit no ENDOR detectable conformational variation dependent on solvent environment (Mustafi et al., 1990c, 1991).
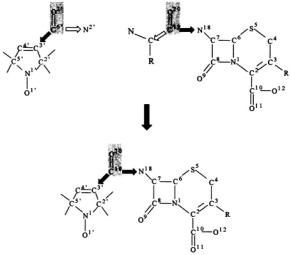
To assign the molecular conformation of the spin-labeled molecule on the basis of ENDOR-determined electron-nucleus distances, the coordinates of the constituent nonhydrogen atoms are constructed from X-ray defined molecular fragments, illustrated, for example, through Fig. 11 by construction of 7-N-(2,2,5,5-tetramethyl-1-oxypyrrolinyl-3-carboxyl)- cephalosporanic acid (SLCEP), a kinetically specific, spin-labeled cephalosporin substrate of class C  (Mustafi et al., 1997).
Figure 11. Illustration of the method of generating atomic coordinates for the molecular model of 7-N-(2,2,5,5-tetramethyl-1-oxypyrrolinyl-3-carboxyl)-cephalosporanic acid by joining molecular fragments of X-ray-defined molecules, in this case, 2,2,5,5-tetramethyl-1- oxy-pyrrolinyl-3-carboxamide (Turley and Boer, 1972) and cephaloglycin (Sweet and Dahl, 1970). Hydrogen atoms are added according to idealized parameters. See text for discussion.
Of importance in joining molecular fragments to generate coordinates of the spin-labeled molecule is to retain bond distances and valence angles for the atoms constituting the point of union that are reflective of their electronic

114 DEVKUMAR MUSTAFI AND MARVIN W. MAKINEN
structure in the resultant compound of interest. In this instance, since the bond distances and valence angles of the carboxamide group of the spinlabel are nearly identical to those of the acylamido linkage of cephalosporin derivatives at the 7-N-position (Mustafi et al., 1997), to generate coordinates for SLCEP requires simply to preserve the C(3')–C(6') and C(6')–O(2') bond distances and the valence angles around C(3') and C(6') in spin-label IV and to assign the same bond distance between C(6') and the N(18) of the cephalosporin moiety as in cephaloglycine (Sweet and Dahl, 1970). The procedure has been described previously (Wells and Makinen, 1988; Wells et al., 1990, 1994; Mustafi et al., 1993, 1997; Mustafi and Makinen, 1994, 1995; Makinen et al., 1998).
Analysis of molecular structure and conformation. A series of torsion angle search calculations are then carried out around all rotatable bonds within van der Waals hard-sphere space constrained by the ENDORdetermined electron-nucleus distances and their line width based uncertainties. ENDOR spectra of SLCEP are presented in Fig. 12 to illustrate how resonance assignments are made to extract electron-nucleus distances as computational constraints. For this molecule, H(18) (cf., atomic numbering scheme in Fig. 11) represents a classic example of a solvent exchangeable proton. In the top spectrum, the ENDOR features of H(18)
labeled |
were identified by their disappearance upon addition of an |
|
excess of |
or |
On the other hand, the features for H(7) |
labeled |
were |
assigned on the basis of their similarity to the H(6) |
proton in SLPEN (6-N-(2,2,5,5-tetra-1-oxypyrrolinyl-3-carboxyl)- penicillanic acid) (Mustafi and Makinen, 1995) and  in spin-labeled amino acids, which has been assigned by deuterium substitution (Mustafi et al., 1990b; Wells et al., 1990; Joela et al., 1991). The lower spectrum is of SLCEP to which one equivalent of
  has been added. Two line pairs not observed in the upper spectrum are identified and are assigned, therefore, to the parallel and perpendicular hfc components of the hydroxyl proton of the methanol molecule. These resonance features will be discussed later.
Table 4 summarizes the hf couplings extracted from ENDOR spectra of SLCEP, their corresponding electron-nucleus distances, and their line width determined uncertainties. Torsion angle analysis requires first determining the sterically accessible conformational space of the molecule through 0°- 360° of rotation around each rotatable bond. Appropriate radii of atoms for these computations are, for example, the parameters published by Marshall and co-workers, generally applicable to polypeptides and nucleic acid residues (Iijima et al., 1987).

ANGLE-SELECTED ENDOR |
115 |
Figure 12. Proton ENDOR spectra of SLCEP in different solvents to illustrate determination of electron-proton distances for assignment of molecular conformation. Solvent conditions are (I), 50:25:25 (v/v)  to which
  was added in 1:1 stoichiometry with respect to SLCEP and (II), 50:25:25 (v/v)
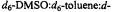
 to which
  was added in 1:1 stoichiometry. These spectra were taken with
  at setting B of the EPR spectrum. The line pairs labeled a and b are assigned to H(18) and H(7), respectively (cf., atomic numbering in Fig. 11). Because the
  and
and  resonance features appear in the spectra for setting B, H(18) and H(7) must lie in or close to the molecular x,y-plane of the spin-label (cf., Fig. 4). The spectra also identify a tightly bound methanol molecule forming a 1:1 adduct with spin-labeled cephalosporin through hydrogenbonding. Both parallel and perpendicular hfc components of the methanol hydroxyl proton are identified in spectrum II. Therefore, the hydroxyl proton must similarly lie in or close to the plane of the spin-label. To detect the proton resonances assigned to the hydrogen-bonded methanol molecule, as shown in spectrum II, solvents were dried before use. Reprinted from Mustafi et al. (1997) with permission of the American Chemical Society.
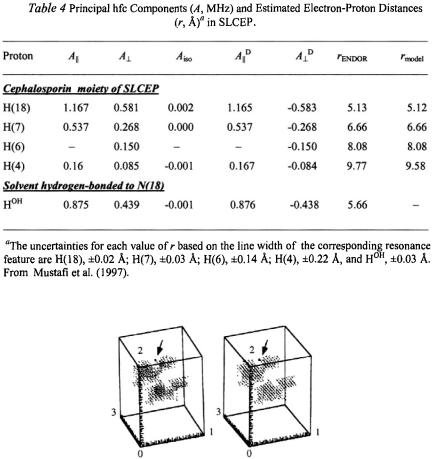
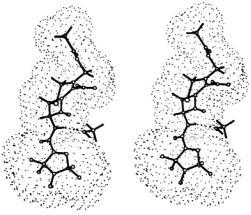
For SLCEP the low density dots in the angle map in Fig. 13 represent van der Waals hard-sphere allowed conformational space for 0°-360° of rotation around bonds (1) C(19)–N(18), (2) N(18)–C(7), and (3) C(3')–C(19) where 1-3 represent the coordinate axes of the angle map. Within hard sphere constraints, the torsion angle search calculations are then carried out to identify which conformers accommodate the ENDOR distance constraints and their respective uncertainties summarized in Table 4. In Fig. 13 an arrow points to a small family of conformers represented by high density dots that satisfy the ENDOR distance constraints. Only one small family of conformers is accommodated by the distance constraints within the line width determined uncertainties. From the electron-nucleus distances corresponding to these torsion angles, a stereo diagram of the ENDORdefined conformation of SLCEP is given in Fig. 14.
116 |
DEVKUMAR MUSTAFI AND MARVIN W. MAKINEN |
Figure 13. Stereo diagram of angle map showing conformational space accessible for SLCEP under van der Waals hard-sphere constraints alone (low density dots) and upon application of the distance constraints in Table 4 for H(18) and H(7) within van der Waals space (arrow pointing to a very small family of conformers). The axes 1-3 of the angle map correspond to 0°-360° of rotation around the three bonds (1) C(19)–N(18), (2) N(18)–C(7), and (3) C(3')– C(19) over which the search calculations were carried out, generally in 2° increments. See the numbering scheme of SLCEP in Fig. 11 for atom designations.
A single family of conformers accommodated by experimentally determined ENDOR constraints is not always the result. For instance, in the case of the analogous spin–labeled penicillin, two different families of conformers were identified compatible with ENDOR constraints (Mustafi and Makinen, 1995), of which one was exactly overlapping with the X-ray structure of amoxycillin (Boles et al., 1978) and benzylpenicillin (Fattah et al., 1993). Correspondingly more than two conformers of (2,2,5,5-
ANGLE-SELECTED ENDOR |
117 |
tetramethyl-1 -oxypyrrolinyl-3-methyl)methanethiolsulfonate (SL-MTS), a spin-label compound employed in protein structure analysis through cysteine mutagenesis (Bolin et al., 1998; Hubbell et al., 1998; Bolin and Millhauser, 1999), were identified (Mustafi et al., 2002) and two conformers of methyl N-(2,2,5,5-tetramethyl-1-oxypyrrolinyl-3-carboxyl)-L -tryptophanate were identified according to ENDOR spectra (Wells et al., 1990).
Figure 14. Stereo diagram of the ENDOR-determined conformation of SLCEP and the hydrogen-bonded methanol molecule representative of the small family of conformers identified in Fig. 13 that accommodate all ENDOR constraints. The dotted surface represents the solvent accessible surface of spin-labeled cephalosporin, calculated according to the LeeRichards algorithm (Lee and Richards, 1971). The hydrogen-bond between the pseudopeptide NH group and  is indicated by a broken line. Reprinted from Mustafi et al. (1997) with permission of the American Chemical Society.
If more than one conformer satisfies the ENDOR constraints, the relative occupancies of the conformers must be evaluated according to other physical criteria. For analysis of small molecules, we have found that a change in solvent resulting in alteration of dielectric constant may noticeably alter the relative amplitudes of ENDOR features, indicating shifts in conformational equilibria. Pertinent examples are SLMTS and spin-labeled methyl L- tryptophanate. In these cases, the change from methanol, a solvent of high dielectric constant, to chloroform/toluene, a solvent of low dielectric constant, not only removed the potential for hydrogen-bonding of polar groups with solvent but also favored almost total occupancy by the conformer of lower potential energy (Wells et al., 1990; Mustafi et al., 2002). A further criterion that can be invoked to rule out multiple conformers satisfying steric and ENDOR distance constraints are eclipsed torsion angle relationships observed through molecular graphics analysis. Conformers with eclipsed bonds are of high potential energy and are unlikely to be significantly populated. This criterion was invoked, for

118 DEVKUMAR MUSTAFI AND MARVIN W. MAKINEN
instance, in analysis of the conformers contributing to the ENDOR spectra of
N-(2,2,5,5-tetramethyl-1-oxypyrrolinyl-3-carboxyl)-L-phenylalaninal, |
an |
|
aldehyde transition-state substrate analog of |
(Jiang et al., |
|
1998). Lastly, a check is made to ensure that the conformers satisfying the distance constraints are spectroscopically compatible with the two different patterns of ENDOR shifts and their dependence on 
Ordinarily it would be preferable to resolve instances of more than one conformer accommodating distance constraints through computational methods involving potential energy minimization or trajectory calculations in which the dynamical motion is simulated. While detailed force-field parameters have been derived for nitroxyl spin-labels (di Matteo and Barone, 1999; Improta et al., 2000), they are largely applicable to only saturated spin-labels associated with interconverting conformers. However, recently force-field parameters have been derived for the 2,2,5,5-tetramethyl-1- oxypyrroline-3-carboxyl molecular fragment (Structure IV in Fig. 10) suitable for energy minimization calculations and molecular dynamics (MD) simulations (Van Zele et al., 2001). Their accuracy was tested by simulating MD trajectories of methyl N-(2,2,5,5-tetramethyl-1-oxypyrrolinyl-3- carboxyl)-L-tryptophanate in methanol and chloroform, solvents of high and low dielectric constant, respectively, in which different conformers had been observed and structurally defined by ENDOR. Importantly, the force-field parameters are compatible with a variety of computational program suites such as CHARMM (Brooks et al., 1983; MacKerell et al., 1998), AMBER (Weiner and Kollman, 1981; Pearlman et al., 1995), and GROMOS (Scott et al., 1999).
Table 5 compares the MD averaged and ENDOR-determined electronproton distances of the spin-labeled methyl L-trytophanate solute molecule in two different solvents. Not only was there close agreement of the electron-nucleus distances evaluated by both ENDOR and MD methods, as evident in Table 5, but also there was complete agreement between the number and types of conformers observed by MD and by ENDOR in each solvent. That is, two conformers were detected in methanol by ENDOR, termed conformers A and C, corresponding to the classical perpendicular and anti-perpendicular orientations of the indole side chain of the trytophanyl moiety, respectively (Wells et al., 1990). Only these two conformers were found as stable structures in MD simulations (Van Zele et al., 2001). The two MD averaged structures calculated from trajectories for each conformer are compared in Fig. 15. It can be seen in Table 5 that conformer C in chloroform is equivalent to conformer C in methanol within the root-mean-square fluctuations of the electron-nucleus distances. Not only was there good agreement between the ENDOR-determined and MDaveraged electron-nucleus distances, as summarized in Table 5, but there

ANGLE-SELECTED ENDOR |
119 |
was also good agreement of the MD-averaged and ENDOR-based values of the dihedral angles within each solvent system.