

Biomedical EPR Part-B Methodology Instrumentation and Dynamics - Sandra R. Eaton
.pdf160 |
FABIAN GERSON AND GEORG GESCHEIDT |
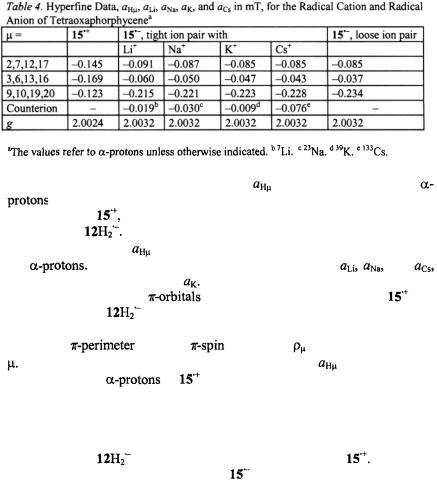
3.3Tetraoxaporphycene
The radical cation of tetraoxaporphycene (15) is isoelectronic with the radical anion of porphycene  considered in the previous section. This cation is one of the five distinct redox stages, namely the dication
  (isolated as
  salt), the radical cation
  the neutral compound 15, the radical anion
  and the dianion
  (Bachmann, et al., 1993; Bachmann 1996). They are interconvertible by reduction or oxidation with appropriate reagents, as indicated in the Reaction Scheme.
Figure 7. Radical ions of tetraoxaporphycene.  spectrum of the cation
  (top, left); solvent
  counterion
  temperature 243 K.

 and
and  ENDOR spectra of the anion
  (right, from top to bottom); solvent MTHF,counterion
 or
or  respectively, temperature 198 K.

 and
and 
 are the frequencies
  of the free proton and
 and
and  nuclei, respectively. (For the
  constant
  the low-frequency signal at 1.33 MHz was not observed, because of the low sensitivity of the apparatus in this region). Taken with a Bruker-ESP-300 spectrometer. Reproduced from (Bachmann, 1996) by permission of the author and from (Bachmann et al., 1993) by permission of J. Am. Chem. Soc.
SOLUTION ENDOR OF RADICAL IONS |
161 |
Figure 7 (top, left) shows the  spectrum of the radical cation
  generated from the dication with zinc in DMF. The
  and
and  spectra of the radical anion
  also reproduced in Figure 7 (right), were observed upon reaction of the neutral compound with the respective alkali metal in 2-methyltetrahydrofuran (MTHF), in which solvent, the radical anion is tightly ion-paired with its counterion

 or
or 
 signals were not detected, because of the low sensitivity of the apparatus in the frequency range 0–2 MHz.) The hyperfine data
 for
for  and a loosely ion-paired
  as well as
  and
and  for the tightly paired
  are listed in Table 4.
Assignments of the coupling constants |
to the three sets of four |
|
were guided by the results of Hückel-McLachlan calculations and, |
||
in the case of |
also by analogy to the corresponding values for the |
|
isoelectronic |
General-TRIPLE-resonance experiments indicate that |
|
all coupling constants |
have the same sign, which must be negative as for |
||
the |
They point to a likewise negative sign for |
and |
|
which should also be shared by |
|
||
|
The singly occupied |
(SOMOs) of the radical cation |
and |
the radical anion |
have vertical nodal planes through the heteroatoms |
||
(O and N, respectively) and can thus be considered as a MO of a 20-
membered |
with the |
population |
of 1/20 at each center |
|
In fact, the average value of the coupling constants |
observed for the |
|||
three sets of four |
in |
is –0.146 mT, which corresponds to such |
||
spin population. The deviations from an average are +0.001, –0.023, and +0.023 mT (Table 4), as compared with –0.005, –0.041, and +0.045 mT for the isoelectronic  (average value -0.141; Table 3). The
  distribution in the perimeter is thus more strongly perturbed by the N- or
NH-bridging in |
than by the corresponding O atoms in |
|
Loose ion pairs of the radical anion |
with its alkali-metal counterions |
|
occurred in 1,2-dimethoxyethane (DME) at low temperature. Upon warming, they became tighter, due to the decreasing polarity of the solvent.
162 FABIAN GERSON AND GEORG GESCHEIDT
In MTHF, a solvent of poor cation-solvating power, tight ion pairs were observed in the whole range of investigation (183–298 K), as indicated by the appearance of a hyperfine splitting from the alkali-metal nucleus. The counterion is situated on a twofold axis, above or below the molecular plane, where it contacts the lone-electron pairs of all O atoms. The small absolute values and the negative sign of the coupling constants of the alkali-metal nuclei, as well as the missing effect of the ion-pairing on the g factor (Table 4), are accounted for by the position of the counterion in a vertical nodal plane of the SOMO. (For the SOMO of  in contrast to that of
  such a plane does not pass through the O atoms but crosses the C9–C10 and C19– C20 bonds.) The ratio
  roughly corresponds to that of the atomic parameters calculated for a ns-spin population of+1 at the Li, Na, K, and Cs atoms (Morton and Preston, 1978), which confirms the similar structure of the ion pairs. The effect of the ion-pairing on the spin
distribution in |
is a slight increase in the |
populations |
at the |
centers |
and 3,6,13,16 and some |
decrease at |
|
this effect diminishes with the growing size of the counterion (Table 4).
4.REFERENCES
Atherton, N. M. (1973). Electron Spin Resonance, Halsted Press, London.
Atherton, N. M. (1979). Solution ENDOR, in Multiple Electron Resonance Spectroscopy,
Dorio, M. M. and Freed, J. H., eds., Plenum Press, New York, chapt. 4., 143–168. Ayscough, P. B. (1967). Electron Spin Resonance in Chemistry, Methuen & Co Ltd, London. Bachmann, R., Gerson, F., Gescheidt, G., and Vogel, E. (1992). Five Redox Stages of
Tetraoxaporphyrin: A UV/Visible/Near-IR, ESR, and MO-Theoretical Study, J. Am. Chem. Soc. 114, 10855–10860.
Bachmann, R., Gerson, F., Gescheidt, G., and Vogel, E. (1993). Tetraoxaporphycene: ESR/ENDOR, UV/Visible/Near-IR, and MO-Theoretical Study of Its Five Redox Stages,
J. Am. Chem. Soc. 115, 10286–10292.
Bachmann, R. (1996). ESR/ENDORund UV/VIS/NIR-Untersuchungen an porphyrinoiden Verbindungen, Ph.D. Thesis, Universität Basel.
Battersby, A. R. and McDonald, E. (1979). Origin of the Pigments of Life: the Type-III
Problem in Porphyrin Biosynthesis, Acc. Chem. Res. 12, 14–22. |
|
Battersby, A. R. and Frobel, K. (1982). Porphyrin Biosynthesis - Vitamin |
Heme, and |
Related Porphyrins, Chem. unserer Zeit 16, 124–134.
Biehl, R., Dinse, K.-P., and Möbius, K. (1971). ENDOR Investigation of Biphenyl and Terphenyl Anion Radicals in Solution, Chem. Phys. Lett. 5, 605–609.
Biehl, R., Plato, M., and Möbius, K. (1975). General TRIPLE Resonance on Free Radicals in Solution – Determination of Relative Signs of Isotropic Hyperfine Coupling Constants, J. Chem. Phys. 63, 3515–3522.
Carrington, A. and McLachlan, A. D. (1967). Introduction to Magnetic Resonance, Harper und Row, New York, and John Weatherhill Inc., Tokyo.
Das, M. R., Connor, H. D., Leniart, D. S., and Freed, J. H. (1970). An Electron Nuclear Double Resonance and Electron Spin Resonance Study of Semiquinones Related to Vitamins K and E, J. Am. Chem. Soc. 92, 2258–2268.
SOLUTION ENDOR OF RADICAL IONS |
163 |
Dax, T. G., Falk, H., and Kapinus, E. I. (1999). A Structural Proof for the Hypericin 1,6- Dioxo Tautomer, Monatsh. Chem. 130, 827–831.
Dorio, M. M. and Freed, J. H., eds. (1979). Multiple Electron Resonance Spectroscopy,
Plenum Press, New York.
Etzlstorfer, C. and Falk, H. (2000). Concerning the Association of Hypericin Tautomers and Their Hypericinate Ions, Monatsh. Chem. 131, 333–340.
Feher, G. (1956). Observation of Nuclear Magnetic Resonances via the Electron Spin Resonance Line, Phys. Rev. 103, 834–835.
Feher, G. (1998). The Development of ENDOR and Other Reminescences of the 1950’s, in Foundation of Modern EPR, G. R. Eaton, S. S. Eaton, and K, M. Salikhov, eds., World Scientific, Singapore and New Jersey, chapt. H.8., 548–556.
Freeman, D., Konstantinovskii, L., and Mazur, Y. (2001). The Structure of Hypericin in Solution. Searching for Hypericin’s 1,6-Tautomer, Photochem. Photobiol. 74, 206–210.
Gerson, F. (1966). Notiz über das ESR-Spektrum des Phenalenyl-Radikals, Helv. Chim. Acta 49, 1463–1467.
Gerson, F., Jachimowicz, J., Möbius, K., Biehl, R., Hyde, J. S., Leniart, D. S. (1975). Application of ENDOR Spectroscopy to Radicals of Low Symmetry: Radical Anion of 2- Phenylcycl[3.2.2]azine, J. Magn. Reson. 18, 471–484.
Gerson, F., Gescheidt, G., Häring, P., Mazur, Y., Freeman, D., Spreitzer, H., and Daub, J. (1995). Electron-Acceptor Properties of Hypericin and Its Salts: An ESR/ENDOR and Electrochemical Study, J. Am. Chem. Soc. 117, 11861–11866.
Gerson, F. and Huber, W. (2003). Electron Spin Resonance Spectroscopy of Organic Radicals, Wiley-VCH, Weinheim (Germany).
Hartmann, P. E. and Goldstein, M. A. (1989). Superoxide Generation by Photomediated Redox Cycling of Anthraquinones, Environ. Mol. Mutagen. 14, 42–47.
Hyde, J. S. and Maki, A. H. (1964). ENDOR of Free Radicals in Solution, J. Chem. Phys. 40, 3117–3118.
Hyde, J. S. (1965). ENDOR of Free Radicals in Solution, J. Chem. Phys. 43, 1806–1818. Hyde, J. S. (1974). Paramagnetic Relaxation, Ann. Rev. Phys. Chem. 25, 407–435.
Hyde, J. S. (1998). EPR at VARIAN: 1954–1974, in Foundation of Modern EPR, G. R. Eaton, S. S. Eaton, and K. M. Salikhov, eds., World Scientific, Singapore and New Jersey, chapt. K.1, 704, 707, 709.
Kevan, L. and Kispert, L. D. (1976). Electron Spin Double Resonance, John Wiley & Sons, New York.
Kurreck, H., Kirste, B., and Lubitz, W. (1984). ENDOR Spectroscopy – A Promising Technique for Investigating the Structure of Organic Radicals, Angew. Chem. Int. Ed. Engl. 23, 173–194.
Kurreck, H., Kirste, B. and Lubitz, W. (1988). Electron Nuclear Double Resonance Spectroscopy of Radicals in Solution, VCH Publishers, Weinheim (Germany).
Möbius, K. and Dinse, K.-P. (1972). ENDOR of Organic Radicals in Solution, Chimia 26, 461–470.
Möbius, K. and Biehl, R. (1979). Electron–Nuclear–Nuclear TRIPLE Resonance of Radicals in Solution, in Multiple Electron Resonance Spectroscopy, M. M. Dorio and J. H. Freed, eds., Plenum Press, New York, chapt. 14., 475–507.
Möbius, K. (1998). ENDOR in Liquids, in Foundation of Modern EPR, G. R. Eaton, S. S. Eaton, and K. M. Salikhov, eds., World Scientific, Singapore and New Jersey, chapt. H.9., 557–576.
Morton, J. A., ed. (1965). Biochemistry of Quinones, Academic Press, New York.
Morton, J. R. and Preston, K. F. (1978). Atomic Parameters for Paramagnetic Resonance Data, J. Magn. Reson. 30, 577–582.
164 |
FABIAN GERSON AND GEORG GESCHEIDT |
Muldner, H. and Zoller, M. (1984). Antidepressive Effect of a Hypericum Extract Standardized to an Active Hypericine Complex. Biochemical and Clinical Studies,
Arzneim. Forsch. 34, 918–920.
Rahimipour, S., Palivan, C., Freeman, D., Barbosa, F., Fridkin, M., Weiner, L., Mazur, Y., and Gescheidt, G. (2001 a). Hypericin Derivatives: Substituent Effects on Radical-anion Formation, Photochem. Photobiol. 74, 149–156.
Rahimipour, S., Bilkis, I., Peron, V., Gescheidt, G., Barbosa, F., Mazur, Y., Koch, Y., Weiner, L., and Fridkin, M. (2001b). Generation of Free Radicals by Emodic Acid and its
 Photochem. Photobiol. 74, 226–236.
Renner, M. W., Forman, A., Wu, W., Chang, C. K., and Fajer, J. (1989). Electrochemical, Theoretical, and ESR Characterizations of Porphycenes. The  Anion Radical of Nickel(II) Porphycene, J. Am. Chem. Soc. 111, 8618–8621.
Scheffler, K. and Stegmann, H. B. (1970). Elektronenspinresonanz, Springer-Verlag, Berlin. Schlüpmann, J., Huber, M., Toporowicz, M., Plato, M., Köcher, M., Vogel, E., Levanon, H.,
and Möbius, K. (1990). Liquid-Phase ESR, ENDOR, and TRIPLE Resonance of Porphycene Anion Radicals, J. Am. Chem. Soc. 112, 6463–6471.
Schmalbein, D. (1998). A Bruker EPR History, in Foundation of Modern EPR, G. R. Eaton, S. S. Eaton, and K. M. Salikhov, eds., World Scientific, Singapore and New Jersey, chapt. K.2.,721.
Seth, J. and Bocian, D. F. (1994). Electron Paramagnetic Resonance Studies of Metalloporphyrin Anion Radicals. Effects of Solvent, Counterion, Temperature, and Isotopic Substitution on the Jahn-Teller Active  Ground State, J. Am. Chem. Soc. 116, 143-153.
Suzuki, O., Katsumata, Y., Oya, M., Bladt, S., and Wagner, H. (1984). Inhibition of Monoamine Oxidase by Hypericin, Planta Med. 50, 272–274.
Toporowicz, M., Ofir, H., Levanon, H., Vogel, E., Köcher, M., Pramod, K., and Fessenden, R. W. (1989). Triplet State of Metalloporphycenes: Zinc-PCl, Palladium-PC2, PlatinumPC2, and Nickel-PC2, Photochem. Photobiol. 50, 37–43.
Vogel, E., Köcher, M., Schmickler, H., and Lex, J. (1986). Porphycene, a New Type of Porphyrin Isomer, Angew. Chem. Int. Ed. Engl. 25, 257–259.
Vogel, E., Sicken, M., Röhrig, P., Schmickler, H., Lex, J., and Ermer, O. (1988). Tetraoxaporphycene Dication, Angew. Chem. Int. Ed. Engl. 27, 411–414.
Wertz, J. E. and Bolton J. R. (1972). Electron Spin Resonance, McGraw-Hill Inc., New York.
Chapter 6
Electron-Electron Double Resonance
Lowell D. Kispert
Chemistry Department, The University of Alabama, Box 870336, Tuscaloosa, Al 35487
Abstract: Electron Electron Double Resonance (ELDOR) consisting of a strongly saturating continuous wave (CW) pump microwave source and a nonsaturating observing source, can be used in a field swept display to monitor saturationtransfer mechanisms such as Heisenberg Exchange, nitrogen nuclear relaxation, and rotational diffusion. 2D pulse ELDOR techniques known as DEER or PELDOR using two separate microwave frequencies or a similar “2 + 1” technique using a single frequency have been configured for probing dipolar interactions up to 8 nm. Spin-echo ELDOR techniques have been developed to study slow motions in a wide range of biological problems. Two-dimensional Fourier transform techniques permit all combinations of pump and probe frequencies with nanosecond time resolution making it possible to study the microscopic orientations of a system. Multiquantum ELDOR techniques have been developed to measure the transfer of magnetization and not a reduction factor as measured in a field swept ELDOR.
1.INTRODUCTION
ELDOR is an acronym that stands for electron-electron double resonance, and requires two microwave frequencies within one resonator; one is called a “pump” microwave source and another is the observing microwave source. In the CW mode, the observing microwave frequency that monitors the change in EPR intensity of a line is fixed at a nonsaturating power level. The “pump” microwave source set at a strongly saturating power level irradiates a portion of the EPR spectrum either the same line or a matching line related by a hyperfme coupling, and the effect on the spectrum is monitored by the observing source. The effect observed is due to a transfer of saturation between spins irradiated by the pump source and those spins detected by the observing source. At short times, this is directly
165
166 |
LOWELL D. KISPERT |
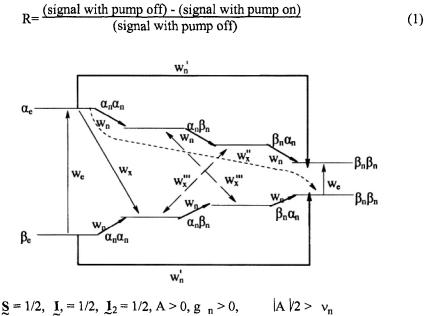
related to the transition probability between the spectral positions. “Saturation transfer” means that the z component of the population difference at the observing frequency is no longer at the Boltzmann population difference. In the CW mode the ELDOR effect is measured by the ELDOR reduction factor R given by
Figure 1. The eight level energy diagram for
and
In Figure 1, is given an eight level energy diagram showing the crossrelaxation pathways  and
and  that occur for a radical when there are two nonequivalent protons interacting with an unpaired electron.
  and
and  are the lattice-induced nuclear spin-flip and electron-flip transitions probabilities, respectively. These transition probabilities are related to relaxation times by the following relations:
 Applying a strong saturating pump source to the left most transition can be detected with a non-saturating observing source as a change in the right most line intensity. The change in intensity depends on the relative values of the cross-relaxation pathways
  and
and  whose magnitudes are dependent on a given relaxation or combination of relaxations. There are many mechanisms by which saturation of one line can be transferred to another line, resulting in both complexities in the ELDOR spectra and new tools to study mechanisms and their rates.
The theory of ELDOR was developed by Hyde et al. (1968) and Freed (1979, 1979a) who showed that a plot of  versus (pump
  is linear
ELECTRON-ELECTRON DOUBLE RESONANCE |
167 |
and the intercept yields the (saturation - transfer rate)/electron spin-lattice relaxation rate. Thus, the R factor is a measure of how competitive saturation transfer is with respect to the spin-lattice relaxation time  Values of
  are preferably measured by time domain methods. In general the ELDOR measurements provide a means to study a variety of dynamic processes that govern relaxation between the pumped and observed spins. For example, extensive ELDOR studies have been reported for nitroxide radical spin labels, which typically possess
  values between 0.3 and
 Over this range of times there are three saturation-transfer mechanisms that are effective. They are the Heisenberg Exchange (HE) - an intermolecular relaxation depending on concentration and two intermolecular relaxations; nitrogen nuclear relaxation and very slow rotational diffusion.
Irradiated organic crystals were also especially suited for CW ELDOR studies (Hyde et al., 1968a, Kispert, 1979). The CW reduction factors (R) recorded for radicals in organic crystals were found to be a measure (Kevan and Kispert, 1976) of the rate of intramolecule motion, hyperfine coupling anisotropy, intramolecular proton spin exchange, intramolecular admixture of nuclear spin states, quadrupole interaction, deuterium hyperfine couplings, resolution of small hyperfine couplings, spin-flip transitions, intermolecular spin diffusion; fluorine coupling anisotropy, hydrogendeuterium exchange, tunneling methyl groups, triplet states and excition motion.
Using pulsed ELDOR techniques to generate echo modulation, it is possible (Schweiger and Jeschke, 2001) to determine distances between two electron spins, measure polarization transfer to another region of the spectrum, measure weak couplings between electron spins, measure conformation statistics, measure broad distribution of distances, and measure end to end distances of spin-labeled polypeptides.
1.1Historical
The first application of dual microwave frequencies was published by Bowers and Mims, in 1959 on paramagnetic relaxation in nickel fluorosilicate followed soon after by Sorokin, Lahser and Gelles in 1960 who showed that individual cross-relaxation times for nitrogen centers in diamond could be determined. Subsequently Unruh and Culvahouse (1963) carried out pulsed ELDOR measurements on  in lanthanide crystals from 1.18 - 4.2 °K and determined the temperature dependence of the relaxation rates. Moran (1964) introduced continuous pumping into ELDOR technology and showed that static spin packets were distributed within an
168 |
LOWELL D. KISPERT |
inhomogeneous envelope. When the pump power was increased, forbidden transitions were observed.
Roughly eight years after the first CW ELDOR experiments were begun in solids, the first solution application of CW ELDOR was reported both in James Hyde’s laboratory at Varian (Hyde, Chien and Freed, 1968) and in Russia (Benderskii et al., 1968). Nechtschein and Hyde (1970) also showed that pulsed ELDOR was possible. Typically, ELDOR was applied in the CW mode (Bruno and Freed, 1974; Dorio and Freed, 1979), to study slow motions of nitroxide radicals, dynamics, and irradiation damage in organic crystals (Kispert, 1979), disordered matrices (Kevan, 1979), polymers (Dorio, 1979) and iron-sulfur proteins (Sands, 1979). The CW method proved useful in the study of similar systems until pulsed ELDOR (PELDOR) configured for probing dipolar interactions (Milov et al., 1981) and a spin-echo ELDOR technique for studying slow motions was developed independently by Hornak and Freed (1983) and by Dzuba et al. (1982, 1984), enable the technique to be especially useful in the study of a wide range of biological problems. Pulsed ELDOR techniques have considerable advantages over CW ELDOR methods. These advantages are.
1.The absence of the radiation fields including the absence of a dc field modulation during the rotational diffusion of the molecules and during the evolution time of the spins,
2.the direct measurement of relaxation rates rather than just their ratios as obtained by CW-ELDOR and
3.the cancellation of inhomogeneous broadening effects.
These features result in greater accuracy in the data analysis and eliminates the need to include the radiation fields in the analysis of the data. Later improvements (Gorcester and Freed, 1988a; Gorcester and Freed, 1986, 1988) with 2D FT ELDOR permitted two-dimensional displays and the possibility of all combinations of pump and probe frequencies displayed in a single 2D spectrum. This meant greater efficiencies in the data acquisition and removed the need to apply additional techniques to analyze the problem. The 2D ELDOR technique has required the development of new microwave and digital electronics to make it possible to obtain the broad band irradiation and detection at microwave frequencies with nanosecond time resolution.
Analysis of 2D-ELDOR spectra allows the coupling between different molecular orientations of a system to be determined. This gives rise to considerable insight into the microscopic details of the rotational process. In the rigid limit, 2D-ELDOR leads to the appearance of forbidden auto peaks (Gorcester et al., 1990) as well as the appearance of cross peaks, due to coherence transfer by the hyperfine interaction. If there are two nuclei, the 2D-ELDOR spectrum of polycrystalline samples can give information on
ELECTRON-ELECTRON DOUBLE RESONANCE |
169 |
their relative orientation. Further double electron-electron |
resonance |
(DEER) techniques were used (Pannier et al., 1998), 200; Pfannebecker et al., 1996; Larsen and Singel, 1993) or PELDOR (Milov et al., 1981, 1998) based on a solid-state concept where use is made of selective pulses at two well-separated microwave frequencies. This approach was applicable to systems such as bilabeled biomolecules with broad spectra  The “2 + 1” technique (Kurshev et al., 1988, 1989) is similar to the 3-pulse DEER technique except for its use of only a single frequency.
Further improvements were made (Borbat and Freed, 1997) in pulsed two-dimensional FT-ESR spectrometers with the design of multi-frequency spectrometers at 9.2 and 17.3 GHz, where the higher frequency gave 4 times the signal-to-noise ratio observed at 9.2 GHz.
A multiquantum ELDOR technique based on coherent effects was introduced (Mchaourab et al., 1991) which provided a signal that is a measure of the transfer of magnetization. Double quantum coherence (DQC) based upon allowed pathways (Borbat and Freed, 1999) has been suggested to have some advantages over DEER measurements: strong pulses (used to observe the allowed pathway) should yield signals at least an order of magnitude greater, an advantage when working with small amounts of bilabeled biomolecules or when attempting to measure distances up to 80 Å. This advantage has not been proven experimentally where DQC and DEER measurements were carried out on the same sample with the same spectrometer. It has however, been possible to measure EPR distances in a bilabeled biomolecule with DEER techniques as shown by Persson et al. (2000) as well as between two copper centers in azurin (Huber et al., 2002). Unpublished reports at conferences have reported preliminary results of DEER measurements on proteins with 450 residues and on DNA.
The most precise measurement of a dipolar coupling to date was a 51 Å shape-persistent biradical with a well-defined distance using a deadtime free single-frequency technique for refocussing (SIFTER) dipolar couplings (Jeschke et al., 2000a). These experiments were based on the solid-echo and Jeener-Brockaert sequences which are well established sequences in dipolar NMR spectroscopy of solids. For distances larger than 3 nm, SIFTER appears to provide better resolution than with DEER techniques. Similar precision has been possible with DEER for shape-persistent biradicals of phenylene-ethylnylene based biradicals (Jeschke et al., 2002a). Advanced techniques for extraction of distances from DEER is also discussed.
It is premature at this time to say much about the relative benefits of the various methods. To date only one paper has made any such comparisons (Persson et al., 2001) and even then for only a few methods.