The components of the electron transport chain can be purified from the mitochondrial inner membrane. Solubilization of the membranes containing the electron transport chain results in the isolation of four distinct protein complexes, and the complete chain can thus be considered to be composed of four parts: (I) NADH–coenzyme Q reductase, (II) succinate–coenzyme Q reductase, (III) coenzyme Q–cytochrome c reductase, and (IV) cytochrome c oxidase (Figure 21.4). Complex I accepts electrons from NADH, serving as a link between glycolysis, the TCA cycle, fatty acid oxidation, and the electron transport chain. Complex II includes succinate dehydrogenase and thus forms a direct link between the TCA cycle and electron transport. Complexes I and II produce a common product, reduced coenzyme Q (UQH2), which is the substrate for coenzyme Q–cytochrome c reductase (Complex III). As shown in Figure 21.4, there are two other ways to feed electrons to UQ: the electrontransferring flavoprotein, which transfers electrons from the flavoproteinlinked step of fatty acyl-CoA dehydrogenase, and sn-glycerophosphate dehydrogenase. Complex III oxidizes UQH2 while reducing cytochrome c, which in turn is the substrate for Complex IV, cytochrome c oxidase. Complex IV is responsible for reducing molecular oxygen. Each of the complexes shown in Figure 21.4 is a large multisubunit complex embedded within the inner mitochondrial membrane.
21.4 ● Complex I: NADH–Coenzyme Q Reductase
As its name implies, this complex transfers a pair of electrons from NADH to coenzyme Q, a small, hydrophobic, yellow compound. Another common name for this enzyme complex is NADH dehydrogenase. The complex (with an estimated mass of 850 kD) involves more than 30 polypeptide chains, one molecule of flavin mononucleotide (FMN), and as many as seven Fe-S clusters, together containing a total of 20 to 26 iron atoms (Table 21.2). By virtue of its dependence on FMN, NADH–UQ reductase is a flavoprotein.
Table 21.2
Protein Complexes of the Mitochondrial Electron-Transport Chain
Mass
Prosthetic
Complex
(kD)
Subunits
Group
Binding Site for:
NADH–UQ reductase
850
30
FMN
NADH (matrix side)
Fe-S
UQ (lipid core)
Succinate–UQ reductase
140
4
FAD
Succinate (matrix side)
Fe-S
UQ (lipid core)
UQ–Cyt c reductase
250
9–10
Heme bL
Cyt c (intermembrane
Heme bH
space side)
Heme c1
Fe-S
Cytochrome c
13
1
Heme c
Cyt c1
Cyt a
Cytochrome c oxidase
162
10
Heme a
Cyt c (intermembrane
Heme a3
space side)
CuA
CuB
Adapted from: Hatefi, Y., 1985. The mitochondrial electron transport chain and oxidative phosphorylation system. Annual Review of Biochemistry 54:1015–1069; and DePierre, J., and Ernster, L., 1977. Enzyme topology of intracellular membranes. Annual Review of Biochemistry 46:201–262.
FIGURE 21.5
682 Chapter 21 ● Electron Transport and Oxidative Phosphorylation
Although the precise mechanism of the NADH–UQ reductase is not known, the first step involves binding of NADH to the enzyme on the matrix side of the inner mitochondrial membrane, and transfer of electrons from
NADH to tightly bound FMN:
NADH [FMN] H 88n [FMNH2] NAD
(21.17)
The second step involves the transfer of electrons from the reduced [FMNH2] to a series of Fe-S proteins, including both 2Fe-2S and 4Fe-4S clusters (see Figures 20.8 and 20.16). The unique redox properties of the flavin group of FMN are probably important here. NADH is a two-electron donor, whereas the Fe-S proteins are one-electron transfer agents. The flavin of FMN has three redox states—the oxidized, semiquinone, and reduced states. It can act as either a one-electron or a two-electron transfer agent and may serve as a critical link between NADH and the Fe-S proteins.
The final step of the reaction involves the transfer of two electrons from iron–sulfur clusters to coenzyme Q. Coenzyme Q is a mobile electron carrier. Its isoprenoid tail makes it highly hydrophobic, and it diffuses freely in the hydrophobic core of the inner mitochondrial membrane. As a result, it shuttles electrons from Complexes I and II to Complex III. The redox cycle of UQ is shown in Figure 21.5, and the overall scheme is shown schematically in Figure 21.6.
Complex I Transports Protons from the Matrix to the Cytosol
The oxidation of one NADH and the reduction of one UQ by NADH–UQ reductase results in the net transport of protons from the matrix side to the cytosolic side of the inner membrane. The cytosolic side, where H accumulates, is referred to as the P (for positive) face; similarly, the matrix side is the N (for negative) face. Some of the energy liberated by the flow of electrons
(a)
O
e– + H+
O•
e– + H+
OH
CH3
H3CO
CH3
CH3O
CH3
H3CO
CH3
H3CO
(CH2
CH
C
CH2)10
H
CH3O
R
H3CO
R
OH
OH
O
Coenzyme Q, oxidized form
Semiquinone
Coenzyme Q,
(Q, ubiquinone)
intermediate
reduced form
(QH •)
(QH2, ubiquinol)
(b)
● (a) The three oxidation states of coenzyme Q.
(b) A space-filling model of coenzyme Q.
21.5 ● Complex II: Succinate–Coenzyme Q Reductase
683
2 H+
2 H+
Intermembrane
space
(P-Phase)
2
2
e–
UQH2
UQH2
UQ
2Fe-S
e–
Centers
UQ
2Fe-S
2 H+
Centers
HP
2 H+
Matrix
(N-Phase)
2 H+
2 H+
FMNH2 FMN
FP + IP
NAD+ NADH + H+
FIGURE 21.6 ● Proposed structure and electron transport pathway for Complex I. Three protein complexes have been isolated, including the flavoprotein (FP), iron–sulfur protein (IP), and hydrophobic protein (HP). FP contains three peptides (of mass 51, 24, and 10 kD) and bound FMN and has 2 Fe-S centers (a 2Fe-2S center and a 4Fe-4S center). IP contains six peptides and at least 3 Fe-S centers. HP contains at least seven peptides and one Fe-S center.
through this complex is used in a coupled process to drive the transport of protons across the membrane. (This is an example of active transport, a phenomenon examined in detail in Chapter 10.) Available experimental evidence suggests a stoichiometry of four H transported per two electrons passed from NADH to UQ.
21.5 ● Complex II: Succinate–Coenzyme Q Reductase
Complex II is perhaps better known by its other name—succinate dehydrogenase, the only TCA cycle enzyme that is an integral membrane protein in the inner mitochondrial membrane. This enzyme has a mass of approximately 100 to 140 kD and is composed of four subunits: two Fe-S proteins of masses 70 kD and 27 kD, and two other peptides of masses 15 kD and 13 kD. Also known as flavoprotein 2 (FP2), it contains an FAD covalently bound to a histidine residue (see Figure 20.15), and three Fe-S centers: a 4Fe-4S cluster, a 3Fe-4S cluster, and a 2Fe-2S cluster. When succinate is converted to fumarate in the TCA cycle, concomitant reduction of bound FAD to FADH2 occurs in succinate dehydrogenase. This FADH2 transfers its electrons immediately to Fe-S centers, which pass them on to UQ. Electron flow from succinate to UQ,
Succinate 88n fumarate 2 H 2 e
(21.18)
UQ 2 H 2 e 88n UQH2
(21.19)
FIGURE 21.7
684 Chapter 21 ● Electron Transport and Oxidative Phosphorylation
O
H3C
C
SCoA
[FAD]
Complex II
[FADH2]
O
H3C
C
SCoA
● The fatty acyl-CoA dehydrogenase reaction, emphasizing that the reaction involves reduction of enzyme-bound FAD (indicated by brackets).
Net rxn: Succinate UQ 88n fumarate UQH2
0.029V
(21.20)
°
G ° 5.6 kJ mol
yields a net reduction potential of 0.029 V. (Note that the first half-reaction is written in the direction of the e flow. As always, o is calculated according to Equation 21.9.) The small free energy change of this reaction is not sufficient to drive the transport of protons across the inner mitochondrial membrane.
This is a crucial point because (as we will see) proton transport is coupled with ATP synthesis. Oxidation of one FADH2 in the electron transport chain results in synthesis of approximately two molecules of ATP, compared with the approximately three ATPs produced by the oxidation of one NADH. Other enzymes can also supply electrons to UQ, including mitochondrial sn-glyc- erophosphate dehydrogenase, an inner membrane–bound shuttle enzyme, and the fatty acyl–CoA dehydrogenases, three soluble matrix enzymes involved in fatty acid oxidation (Figure 21.7; also see Chapter 24). The path of electrons from succinate to UQ is shown in Figure 21.8.
Complex III
Complex II
Intermembrane
space
UQH2
2Fe3+
2 H+
UQ
2Fe2+
FAD
FADH2
Matrix
Succinate
Fumarate
FIGURE 21.8 ● A probable scheme for electron flow in Complex II. Oxidation of succinate occurs with reduction of [FAD]. Electrons are then passed to Fe-S centers and then to coenzyme Q (UQ). Proton transport does not occur in this complex.
FIGURE 21.9
21.6 ● Complex III: Coenzyme Q–Cytochrome c Reductase
685
21.6 ● Complex III: Coenzyme Q–Cytochrome c Reductase
In the third complex of the electron transport chain, reduced coenzyme Q
(UQH2) passes its electrons to cytochrome c via a unique redox pathway known
H3C
CH CH2
as the Q cycle. UQ–cytochrome c reductase (UQ–cyt c reductase), as this complex
is known, involves three different cytochromes and an Fe-S protein. In the
CH
CH3
CH2
N
cytochromes of these and similar complexes, the iron atom at the center of
the porphyrin ring cycles between the reduced Fe2 (ferrous) and oxidized
N
Fe
N
Fe3 (ferric) states.
Cytochromes were first named and classified on the basis of their absorp-
H3C
N
_
tion spectra (Figure 21.9), which depend upon the structure and environment
CH2CH2COO
of their heme groups. The b cytochromes contain iron–protoporphyrin IX (Figure
_
21.10), the same heme found in hemoglobin and myoglobin. The c
H3C
CH2CH2COO
cytochromes contain heme c, derived from iron–protoporphyrin IX by the cova-
Iron protoporphyrin IX
lent attachment of cysteine residues from the associated protein. UQ–cyt c
(found in cytochrome b,
myoglobin, and hemoglobin)
α
β
(a)
(a) Cytochrome c : reduced spectrum
(b)
α
(b) Cytochrome c : oxidized spectrum
β
(c) Cytochrome c : reduced spectrum
b α
minus oxidized spectrum
Absorbance
(c)
α
c
a α
a α
(d) Submitochondrial particles
(d)
b α
(room temperature): reduced spectrum
minus oxidized spectrum
c α
(e) Submitochondrial particles (77K):
reduced spectrum minus oxidized spectrum
(e)
450 500 550 600 650 Wavelength (nm)
● Typical visible absorption spectra of cytochromes. (a) Cytochrome c, reduced spectrum; (b) cytochrome c, oxidized spectrum; (c) the difference spectrum: (a) minus (b); (d) beef heart mitochondrial particles: room temperature difference (reduced minus oxidized) spectrum; (e) beef heart submitochondrial particles: same as (d) but at 77 K. - and - bands are labeled, and in (d) and (e) the bands for cytochromes a, b and c are indicated.
S
H3C
CHCH3
S
CH3CH
N
CH3
N
Fe
N
H3C
N
_
CH2CH2COO
H3C
_
CH2CH2COO
Heme C
(found in cytochrome c)
OH
H3C
CH CH2
CH2CH
N
CH3
N Fe
N
H3C
N
_
CH2CH2COO
_
O
CH
CH2CH2COO
Heme A
(found in cytochrome a)
FIGURE 21.10 ● The structures of iron protoporphyrin IX, heme c, and heme a.
686 Chapter 21 ● Electron Transport and Oxidative Phosphorylation
FIGURE 21.11 ● The structure of UQ-cyt c reductase, also known as the cytochrome bc1 complex. The alpha helices of cytochrome b (pale green) define the transmembrane domain of the protein. The bottom of the
structure as shown extends approximately 75 A into the mitochondrial matrix, and the top of
the structure as shown extends about 38 A into the intermembrane space. (Photograph kindly provided by Di Xia and Johann Deisenhofer [From Xia, D., Yu, C.-A., Kim, H., Xia, J.-Z., Kachurin, A. M., Zhang, L., Yu, L., and Deisenhofer, J., 1997. The crystal structure of the cytochrome bc1 complex from bovine heart mitochondria. Science 277:60–66.])
reductase contains a b-type cytochrome, of 30 to 40 kD, with two different heme sites (Figure 21.11) and one c-type cytochrome. (One other variation, heme a, contains a 15-carbon isoprenoid chain on a modified vinyl group, and a formyl group in place of one of the methyls [see Figure 21.10]. Cytochrome a is found in two forms in Complex IV of the electron transport chain, as we shall see.) The two hemes on the b cytochrome polypeptide in UQ–cyt c reductase are distinguished by their reduction potentials and the wavelength ( max) of the socalled band (see Figure 21.9). One of these hemes, known as bL or b566, has a standard reduction potential, ° , of 0.100 V and a wavelength of maximal absorbance ( max) of 566 nm. The other, known as bH or b562, has a standard reduction potential of 0.050 V and a max of 562 nm. (H and L here refer to high and low reduction potential.)
The structure of the UQ–cyt c reductase, also known as the cytochrome bc1 complex, has been determined by Johann Deisenhofer and his colleagues. (Deisenhofer was a co-recipient of the Nobel Prize in Chemistry for his work on the structure of a photosynthetic reaction center [see Chapter 22]). The complex is a dimer, with each monomer consisting of 11 protein subunits and 2165 amino acid residues (monomer mass, 248 kD). The dimeric structure is pear-shaped and consists of a large domain that extends 75 Å into the mito-
FIGURE 21.12
21.6 ● Complex III: Coenzyme Q–Cytochrome c Reductase
687
chondrial matrix, a transmembrane domain consisting of 13 transmembrane-helices in each monomer and a small domain that extends 38 Å into the intermembrane space (Figure 21.11). Most of the Rieske protein (an Fe-S protein named for its discoverer) is mobile in the crystal (only 62 of 196 residues are shown in the structure in Figure 21.11), and Deisenhofer has postulated that mobility of this subunit could be required for electron transfer in the function of this complex.
Complex III Drives Proton Transport
As with Complex I, passage of electrons through the Q cycle of Complex III is accompanied by proton transport across the inner mitochondrial membrane. The postulated pathway for electrons in this system is shown in Figure 21.12. A large pool of UQ and UQH2 exists in the inner mitochondrial membrane. The Q cycle is initiated when a molecule of UQH2 from this pool diffuses to a site (called Qp) on Complex III near the cytosolic face of the membrane.
Oxidation of this UQH2 occurs in two steps. First, an electron from UQH2 is transferred to the Rieske protein and then to cytochrome c1. This releases two H to the cytosol and leaves UQ , a semiquinone anion form of UQ, at the Qp site. The second electron is then transferred to the bL heme, converting UQ to UQ. The Rieske protein and cytochrome c1 are similar in structure; each has a globular domain and is anchored to the inner membrane by
(a) First half of Q cycle
Qp site
2 H+
Cyt c
Synopsis
Intermembrane
2H+ out
space (P-phase)
UQH2
e–
Cyt c1
First UQH2
Cyt c
UQH2
UQH2
UQ–
FeS
from pool
UQ
UQ
e–
2e– oxidation
UQ
Cyt bL
1e–
UQ
at Qp site
Pool
UQ
e
–
UQ to
1e–
UQ–
Cyt bH
pool
UQ
Matrix (N-phase)
Qn site
at Qn site
(b) Second half of Q cycle
Qp site
2 H+
Cyt c
Synopsis
Intermembrane
2H+ out
space (P-phase)
UQH2
Cyt c1
Second UQH2
Cyt c
e–
UQH2
UQ–
FeS
from pool
e–
UQH2
UQ
UQ
Cyt bL
2e– oxidation
UQ
UQ
1e–
at Qp site
Pool
UQH2
UQ–
e–
to pool
Cyt bH
UQH2
1e–
UQH2
to pool
UQ.–
Matrix (N-phase)
Qn site
at Qn site
2 H+
Net
2e–
4 H+out + 2 Cyt cred + UQ
2H+
UQH2 + 2 H+in
+ 2 Cyt cox
● The Q cycle in mitochondria. (a) The electron transfer pathway following oxidation of the first UQH2 at the Q p site near the cytosolic face of the membrane.
(b) The pathway following oxidation of a second UQH2.
FIGURE 21.13
688 Chapter 21 ● Electron Transport and Oxidative Phosphorylation
a hydrophobic segment. However, the hydrophobic segment is N-terminal in the Rieske protein and C-terminal in cytochrome c1.
The electron on the bL heme facing the cytosolic side of the membrane is now passed to the bH heme on the matrix side of the membrane. This electron transfer occurs against a membrane potential of 0.15 V and is driven by the
loss of redox potential as the electron moves from bL ( ° 0.100V) to bH
(
0.050V). The electron is then passed from bH to a molecule of UQ at
°
a second quinone-binding site, Qn, converting this UQ to UQ
. The result-
ing UQ remains firmly bound to the Qn site. This completes the first half of the Q cycle (Figure 21.12a).
The second half of the cycle (Figure 21.12b) is similar to the first half, with a second molecule of UQH2 oxidized at the Qp site, one electron being passed to cytochrome c1 and the other transferred to heme bL and then to heme bH. In this latter half of the Q cycle, however, the bH electron is transferred to the semiquinone anion, UQ , at the Qn site. With the addition of two H from the mitochondrial matrix, this produces a molecule of UQH2, which is released from the Qn site and returns to the coenzyme Q pool, completing the Q cycle.
The Q Cycle Is an Unbalanced Proton Pump
Why has nature chosen this rather convoluted path for electrons in Complex III? First of all, Complex III takes up two protons on the matrix side of the inner membrane and releases four protons on the cytoplasmic side for each pair of electrons that passes through the Q cycle. The apparent imbalance of two protons in for four protons out is offset by proton translocations in Complex IV, the cytochrome oxidase complex. The other significant feature of this mechanism is that it offers a convenient way for a two-electron carrier, UQH2, to interact with the bL and bH hemes, the Rieske protein Fe-S cluster, and cytochrome c1, all of which are one-electron carriers.
N
S
S
S N
N
C
Cytochrome c Is a Mobile Electron Carrier
Electrons traversing Complex III are passed through cytochrome c1 to cytochrome c. Cytochrome c is the only one of the cytochromes that is watersoluble. Its structure, determined by X-ray crystallography (Figure 21.13), is globular; the planar heme group lies near the center of the protein, surrounded predominantly by hydrophobic protein residues. The iron in the porphyrin ring is coordinated both to a histidine nitrogen and to the sulfur atom of a methionine residue. Coordination with ligands in this manner on both sides of the porphyrin plane precludes the binding of oxygen and other ligands, a feature that distinguishes the cytochromes from hemoglobin (Chapter 15).
Cytochrome c, like UQ, is a mobile electron carrier. It associates loosely with the inner mitochondrial membrane (in the intermembrane space on the cytosolic side of the inner membrane) to acquire electrons from the Fe-S–cyt c1 aggregate of Complex III, and then it migrates along the membrane surface in the reduced state, carrying electrons to cytochrome c oxidase, the fourth complex of the electron transport chain.
● The structure of mitochondrial cytochrome c. The heme is shown at the center of the structure, covalently linked to the protein via its two sulfur atoms (yellow). A third sulfur from a methionine residue coordinates the iron.
21.7 ● Complex IV: Cytochrome c Oxidase
Complex IV is called cytochrome c oxidase because it accepts electrons from cytochrome c and directs them to the four-electron reduction of O2 to form H2O:
4 cyt c (Fe2 ) 4 H O2 88n 4 cyt c (Fe3 ) 2 H2O (21.21)
(Photo kindly provided by
21.7 ● Complex IV: Cytochrome c Oxidase
689
FIGURE 21.14 ● An electrophoresis gel showing the complex subunit structure of bovine heart cytochrome c oxidase. The three largest subunits, I, II, and III, are coded for by mitochondrial DNA. The others are encoded by nuclear DNA.
▲
Professor Roderick Capaldi)
Thus, O2 and cytochrome c oxidase are the final destination for the electrons derived from the oxidation of food materials. In concert with this process, cytochrome c oxidase also drives transport of protons across the inner mitochondrial membrane. These important functions are carried out by a transmembrane protein complex consisting of more than 10 subunits (Table 21.2).
An electrophoresis gel of the bovine heart complex is shown in Figure 21.14. The total mass of the protein in the complex, composed of 13 subunits, is 204 kD. Subunits I through III, the largest ones, are encoded by mitochondrial DNA, synthesized in the mitochondrion, and inserted into the inner membrane from the matrix side. The smaller subunits are coded by nuclear DNA and synthesized in the cytosol.
The structure of cytochrome c oxidase has been solved. The essential Fe and Cu sites are contained entirely within the structures of subunits I, II, and III. None of the 10 nuclear DNA–derived subunits directly impinges on the essential metal sites. The implication is that subunits I to III actively participate in the events of electron transfer, but that the other 10 subunits play regulatory roles in this process. Subunit I is cylindrical in shape and consists of 12 transmembrane helices, without any significant extramembrane parts (Figure 21.15). Hemes a and a3, which lie perpendicular to the membrane plane, are cradled by the helices of subunit I. Subunits II and III lie on opposite sides of subunit I and do not contact each other. Subunit II has an extramembrane domain on the cytosolic face of the mitochondrial membrane. This domain consists of a 10-strand -barrel that holds CuA 7 Å from the nearest surface atom of the subunit. Subunit III consists of 7 transmembrane helices with no significant extramembrane domains. Figure 21.16 presents a molecular graphic image of cytochrome c oxidase.
FIGURE 21.16 ● Molecular graphic image of
cytochrome c oxidase. Seven of the 10 nuclear
DNA–derived subunits (IV, VIa, VIc, VIIa, VIIb,
VIIc, and VIII) possess transmembrane seg-
ments. Three (Va, Vb, and VIb) do not.
Subunits IV and VIc are transmembrane and
dumbbell-shaped. Subunit Va is globular and
bound to the matrix side of the complex,
whereas VIb is a globular subunit on the
cytosolic side of the membrane complex. Vb is
globular and matrix-side associated as well, but
it has an N-terminal extended domain. VIa has
a transmembrane helix and a small globular
domain. Subunit VIIa consists of a tilted trans-
membrane helix, with another short helical
segment on the matrix side of the membrane.
FIGURE 21.15 ● Molecular graphic image of subunits I, II, and III of cytochrome c oxi-
Subunits VIIa, VIIb, and VIII consist of trans-
membrane segments with short extended
dase.
regions outside the membrane.
FIGURE 21.18
FIGURE 21.17
Matrix (N-Phase)
2
690 Chapter 21 ● Electron Transport and Oxidative Phosphorylation
Cytc
2 H+
Fe
2 e–
Intermembrane
space
CuA
2
e
–
(P-Phase)
Cyta
Fe
2 e–
Cyta3
Fe
CuB
1 O + 2H+
–
2 2
H
O
2 H+
2
● The electron transfer pathway for cytochrome oxidase. Cytochrome c binds on the cytosolic side, transferring electrons through the copper and heme centers to reduce O2 on the matrix side of the membrane.
Electron Transfer in Complex IV Involves
Two Hemes and Two Copper Sites
Cytochrome c oxidase contains two heme centers (cytochromes a and a3) as well as two copper atoms (Figure 21.17). The copper sites, CuA and CuB, are associated with cytochromes a and a3, respectively. The copper sites participate in electron transfer by cycling between the reduced (cuprous) Cu state and the oxidized (cupric) Cu2 state. (Remember, the cytochromes and copper sites are one-electron transfer agents.) Reduction of one oxygen molecule requires passage of four electrons through these carriers—one at a time (Figure 21.17).
Electrons from cytochrome c are transferred to CuA sites and then passed to the heme iron of cytochrome a. CuA is liganded by two cysteines and two histidines (Figure 21.18). The heme of cytochrome a is liganded by imidazole rings of histidine residues (Figure 21.18). The CuA and the Fe of cytochrome a are within 1.5 nm of each other.
CuB and the iron atom of cytochrome a3 are also situated close to each other and are thought to share a ligand, which may be a cysteine sulfur (Figure 21.19). This closely associated pair of metal ions is referred to as a binuclear center.
As shown in Figure 21.20, the electron pathway through Complex IV continues as CuB accepts a single electron from cytochrome a (state O n state H). A second electron then reduces the iron center to Fe2 (H n R), leading to the binding of O2 (R n A) and the formation of a peroxy bridge between heme a3 and CuB (A n P). This amounts to the transfer of two electrons from the binuclear center to the bound O2. The next step involves uptake of two H and a third electron (P n F), which leads to cleavage of the OOO bond and generation of Fe4 at the heme. Uptake of a fourth e facilitates formation of ferric hydroxide at the heme center (F n O ). In the final step of the cycle (O n O), protons from the mitochondrial matrix are accepted by the coordinated hydroxyl groups, and the resulting water molecules dissociate from the binuclear center.
Complex IV Also Transports Protons Across
the Inner Mitochondrial Membrane
The reduction of oxygen in Complex IV is accompanied by transport of protons across the inner mitochondrial membrane. Transfer of four electrons through this complex drives the transport of approximately four protons. The mechanism of proton transport is unknown but is thought to involve the steps from state P to state O (Figure 21.20). Four protons are taken up on the matrix side for every two protons transported to the cytoplasm (see Figure 21.17).
● (a) The CuA site of cytochrome oxidase. Copper ligands include two histidine imidazole groups and two cysteine side chains from the protein. (b) The coordination of histidine imidazole ligands to the iron atom in the heme a center of cytochrome oxidase.


 2 H+
2 H+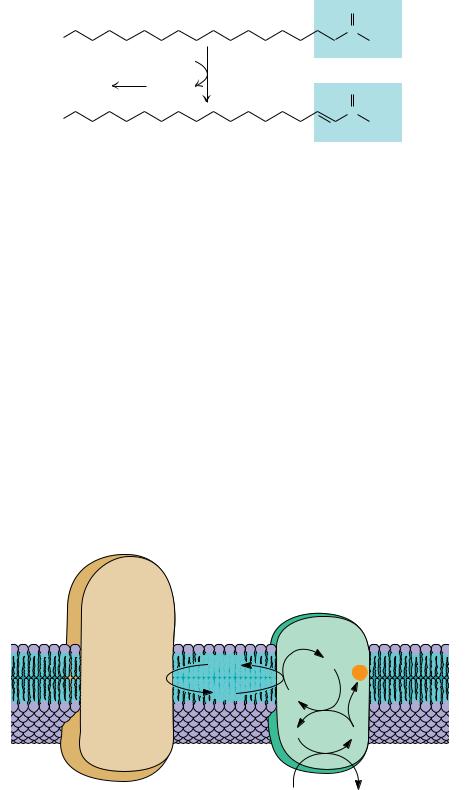


 C
C
