

Flow Cytometry - First Principles (Second Edition)
.pdfLeukocytes, Surface Proteins, and the Strategy of Gating |
89 |
Fig. 6.3. Ampli®cation of staining by the use of multiple antibody reagents. Drawing by Ian Brotherick.
speci®c for mouse Ig [known as a goat anti-mouse reagent]. An appropriate third layer reagent might then be a ¯uorescein-conjugated antibody raised in a sheep and speci®c for goat Ig [sheep anti-goat], and so on [elephant anti-sheep, armadillo anti-elephant, unicorn antiarmadillo] until the zoologists run out of immunologically competent animals [Fig. 6.3]. Because each antibody molecule is linked to many ¯uorochrome molecules and because many antibodies will bind to each antigen, this is a way to increase the intensity of signals from sparsely expressed membrane proteins.)
The disadvantages of indirect staining are that it is more timeconsuming and it involves a second step that doubles the opportunity for nonspeci®c binding. Indirect staining also greatly limits the opportunity for simultaneous double and triple staining of cells with two and three di¨erent ¯uorochromes because of the problems of
90 |
Flow Cytometry |
cross-reactivity between primary antigens and the conjugated second layer reagents that may display broad speci®city. Nevertheless, with appropriate choice of monoclonal antibodies of speci®c immunoglobulin subclass and/or animal derivation and with second layer reagents appropriate and speci®c to these particular characteristics, two-color staining with indirect reagents is sometimes possibleÐbut it is not easy. In general, with the increasing availability of multilaser systems and the concurrent realization by scientists of the informative power of multicolor staining, most workers have adopted direct staining procedures.
CONTROLS
As emphasized in the section in Chapter 3 on electronics, the intensity ``read out'' in ¯ow cytometry is relative and user-adjustable. By changing electronic settings, cells of a given intensity can receive either high or low ``intensity'' values from the ADC (and can be placed at high or low positions on the ¯uorescence scale). Therefore, in order to know whether cells that have been exposed to a stain have actually bound any of that stain, we need to compare the stained cells with an unstained control. One of the general laws of science that applies particularly to ¯ow cytometry is that no matter how many controls you have used in an experiment, when you come to analyze your results you always wish you had used one more. There are three reasons that this problem is acute in ¯ow analysis. One has to do with the background ¯uorescence of unstained cells; the second has to do with the nature of antibody±antigen interactions; and the third has to do with the problem of compensation between overlapping ¯uorescence spectra from di¨erent ¯uorochromes.
The ®rst problem that needs to be controlled is that of background ¯uorescence (called auto¯uorescence). All unstained cells give o¨ some ¯uorescence (that is, all cells emit some light that gets through one or another of the ®lters in front of a cytometer's photodetectors). This auto¯uorescence may not be recognized by microscopists either because it is very dim or because experienced microscopists have acquired a mental threshold in the course of their training. But our cytometer's photodetectors are both very sensitive and completely untrainable. Therefore the auto¯uorescence of cells,
Leukocytes, Surface Proteins, and the Strategy of Gating |
91 |
resulting from intracellular constituents such as ¯avins and pyridine nucleotides, is bright enough to be detected. It can, in some cells, be so bright as to limit our ability to detect positive staining over and above this bright background. Whatever the level of this auto- ¯uorescence, we need to de®ne it carefully by analyzing unstained cells (auto¯uorescence controls) if we are going to be able to conclude that cells treated with a reagent have actually become stained (that is, are now brighter than their endogenous background).
Beyond the problem of auto¯uorescence, there is a second problem. As discussed above, much of the staining of cells for ¯ow analysis makes use of antibody±antigen speci®city. Although the speci®city between an antibody's binding site (the key) and the corresponding epitope on an antigen (the lock) is indeed exquisite, the beauty of the system can be confounded by a long ¯oppy arm on the back (Fc) end of the antibody. These Fc ends stick with wild abandon to so-called Fc receptors that occur on the surface of many types of cells (notoriously monocytes). While I have worked in a department with scientists who study the speci®city and importance of this Fc binding for too long to consider these reactions to be nonspeci®c and only a nuisance, it is true that these Fc receptors on many types of cells can confound the nominal speci®city of an antibody's binding to its reciprocal antigen. What this means is that cells may stain with a particular monoclonal antibody because they possess a particular antigen on their surface membrane that locks neatly with the key on the monoclonal antibody binding site. They may also, however, stain with that particular monoclonal antibody because they possess Fc receptors that promiscuously cling to antibodies with all antigenic speci®cities. In addition, it is often true that dead cells (with perforated outer membranes) can soak up antibodies and then hang on to them tenaciously. The way to know if staining of cells is speci®c to a speci®c antigen is to use the correct control.
The correct control is always an antibody of exactly the same properties as the monoclonal antibody used in the experiment, but with an irrelevant speci®city. If we are staining cells with a monoclonal antibody having a speci®city for the CD3 protein occurring on the surface of T lymphocytes (and that monoclonal antibody happens to be a mouse immunoglobulin of the IgG2a subclass, conjugated with six ¯uorescein molecules per molecule of protein and used to stain the cells at a concentration of 10 mg per ml), then an appropri-

92 |
|
|
|
|
Flow Cytometry |
|||||||||||||||||||
|
|
|
|
|
|
|
|
|
|
|
|
|
|
|
|
|
|
|
|
|
|
|
|
|
|
|
|
|
|
|
|
|
|
|
|
|
|
|
|
|
|
|
|
|
|
|
|
|
|
|
|
|
|
|
|
|
|
|
|
|
|
|
|
|
|
|
|
|
|
|
|
|
|
|
|
|
|
|
|
|
|
|
|
|
|
|
|
|
|
|
|
|
|
|
|
|
|
|
|
|
|
|
|
|
|
|
|
|
|
|
|
|
|
|
|
|
|
|
|
|
|
|
|
|
|
|
|
|
|
|
|
|
|
|
|
|
|
|
|
|
|
|
|
|
|
|
|
|
|
|
|
|
|
|
|
|
|
|
|
|
|
|
|
|
|
|
|
|
|
|
|
|
|
|
|
|
|
|
|
|
|
|
|
|
|
|
|
|
|
|
|
|
|
|
|
|
|
|
|
|
|
|
|
|
|
|
|
|
|
|
|
|
|
|
|
|
|
|
|
|
|
|
|
|
|
|
|
|
|
|
|
|
|
|
|
|
|
|
|
|
|
|
|
|
|
|
|
|
|
|
|
|
|
|
|
|
|
|
|
|
|
|
|
|
|
|
|
|
|
|
|
|
|
|
|
|
|
|
|
|
|
|
|
|
|
|
|
|
|
|
|
|
|
|
|
|
|
|
|
|
|
|
|
|
|
|
|
|
|
|
|
|
|
|
|
|
|
|
|
|
|
|
|
|
|
|
|
|
|
|
|
|
|
|
|
|
|
|
|
|
|
|
|
|
|
|
|
|
|
Fig. 6.4. The ¯uorescence histogram of an isotype control sample is used to decide on the ¯uorescence intensity that indicates positive staining.
ate control would be a mouse monoclonal antibody of the same subclass, with the same ¯uorescein conjugation ratio, and at the same protein concentration, but with a speci®city for something like keyhole limpet hemocyanin or anything else that is unlikely to be found on a human blood cell (Fig. 6.4).
Such a control antibody is known as an isotype control because it is of the same immunoglobulin isotype (subclass) as the staining antibody used in the experiment. It will allow you to determine how much background stain is due to irrelevant stickiness (dead cells, Fc receptors, and so forth). The only trouble with this scenario is that exactly correct isotype controls are not usually available. Various manufacturers of monoclonal antibodies will sell so-called isotype controls and will certainly recommend that they be used. These are, however, general purpose isotype controls that will be of an average

Leukocytes, Surface Proteins, and the Strategy of Gating |
93 |
¯uorochrome conjugation ratio and of a protein concentration that may or may not be similar to that used for most staining procedures. Whether an average isotype control is better than no isotype control at all is a matter of opinion and will depend on the kinds of answers that you demand from your experiments. For most routine immunophenotyping, where the staining of positive cells is strong and bright, isotype controls have been falling out of favor. Unstained (auto- ¯uorescence) controls may be good enough.
The third problem that needs to be controlled is that of spectral cross-over and the possibility of incorrect instrument compensation. As an example of a case in which controls for nonspeci®c staining, auto¯uorescence, and compensation are all critical, let us look at the staining of B lymphocytes for the CD5 marker present with only low density on their surface. As well as the problems created by nonspeci®c staining and by auto¯uorescence, the problem of spectral cross-over between ¯uorescein and phycoerythrin can particularly confuse the interpretation of results from this kind of experiment. Look at Figure 6.5. What we are interested in is the number of B lymphocytes that possess the CD5 surface antigen. These cells will appear in quadrant 2 of a contour plot of ¯uorescein ¯uorescence
Fig. 6.5. The use of a phycoerythrin (PE) isotype control to help in deciding where, in a dual-color plot, to draw the horizontal line between ¯uorescein±stained cells to be considered positive and those to be considered negative for the PE stain. Misplacing of the horizontal line will a¨ect the number of CD19 cells determined to express the CD5 antigen in the stained sample. Data courtesy of Jane Calvert.
94 |
Flow Cytometry |
(a B-lymphocyte stain) on the horizontal axis against phycoerythrin (PE) ¯uorescence (the CD5 stain) on the vertical axis. But B cells will also appear in this quadrant if they have orange auto¯uorescence or if they are nonspeci®cally sticky for the anti-CD5 antibody (in this case a mouse monoclonal immunoglobulin of the IgG2a isotype). In addition, they will appear in this quadrant if the cytometer's orange photodetector has not been properly compensated for cross-over from the ¯uorescein signal. The way around all these problems is to stain cells with a ¯uorescein stain for B cells in conjunction with an isotype control (a mouse IgG2a antibody conjugated with PE but speci®c for an irrelevant antigen, say, keyhole limpet hemocyanin). The intensity of stain shown by these control cells on the PE photodetector will mark the limit of intensity expected from all nonspeci®c causes. Any further PE intensity shown by cells stained with the B-cell stain and the anti-CD5 PE stain will now clearly be the result of speci®c CD5 proteins on the cell surface. In this way, by use of the correct isotype control, we can rule out any problems in interpretation that may result from incorrect instrument compensation or nonspeci®c or background ¯uorescence.
In general, all these problems and their appropriate controls are particularly important when, as with the CD5 antigen on B cells, the staining density on the cells in question is low and there is considerable overlap between positive and negative populations. They become less critical for the evaluation of results when dull negative cells are being compared with a bright positive population. In any case, the general procedure for analyzing ¯ow data is to look at the level of background staining (resulting from both auto¯uorescence and nonspeci®c staining) and then, having de®ned this intensity, to analyze the change in intensity that occurs after the cells have been stained. As discussed in Chapter 4, this change may consist of the bright staining of a small subpopulation within the total population; in this situation, the relevant result may be given as the percentage of the total number of cells that are positively stained. Alternatively, the change may involve the shift of the entire population to a somewhat brighter ¯uorescence intensity; here the relevant result may be expressed as the change in brightness (mode, mean, or median of the distribution). This leads us to the problem of quanti®cation of intensity by ¯ow cytometry.
Leukocytes, Surface Proteins, and the Strategy of Gating |
95 |
QUANTITATION
One of the proclaimed advantages of ¯ow cytometry, compared with eyeball microscopy, is its quantitative nature. Flow cytometry is indeed impressively quantitative when it comes to counting cells and compiling statistics about large numbers of cells in a short period of time. Users are, however, subjected to a rude shock when they ®rst attempt to quantify the ¯uorescence intensity of their cells. Whereas a ¯ow cytometer can be very quantitative about comparing the ¯uorescence intensity of particles (assuming that the photodetectors and ampli®ers are working well), it is unfortunately true that a ¯ow cytometer is very bad at providing an absolute value for the light intensity it measures. Therefore, any experimental protocol that needs to measure the intensity of the staining of cells (as opposed to a yes or no answer about whether and what percentage of cells are stained or not) is up against certain intrinsic di½culties.
If you really do need some measure of the intensity of cells, the way around these di½culties is to accept the limitations of the system, work within the constraints, and use some kind of standard to calibrate the intensity scale. The easiest standard for any cell is its own unstained control. An arbitrary position on the scale can be assigned to the ¯uorescence of the control (by changing the voltage on the photomultiplier tube during instrument set-up), and the stained sample can be compared with this. The disadvantage in this measure of relative ¯uorescence compared with the control is that cells with high auto- ¯uorescence will require a greater density of positively stained receptors to give the same ``relative intensity'' value as cells with low auto¯uorescence. In other words, if intensity is expressed by a ratio of the brightness of stained cells relative to that of the unstained cells, a given ratio will represent more positive stain (in terms of ¯uorochrome molecules) on highly auto¯uorescent cells than on cells with low background.
One way around this problem is to compare cell ¯uorescence not with unstained cells but with the ¯uorescence of an external standard. This can be done by the use of ¯uorescent beads. In brief (this is an insiders' joke; you would be amazed at how much has been written about the use of beads in ¯ow cytometry), there are commercially available polystyrene beads (``microspheres'') that have standardized
96 |
Flow Cytometry |
¯uorescence intensities. Some of these beads have ¯uorescein or PE bound to their surface. Others have a selection of hydrophobic ¯uorochromes incorporated throughout the bead. The latter are more stable in intensity, but, because the ¯uorochromes are not the usual ¯ow cytometric ¯uorochromes, they may give di¨erent relative values on the di¨erent photodetectors of di¨erent cytometers. In either case, by running a sample of standard beads through the cytometer, all data can be reported as a value relative to the intensity of the standard beads.
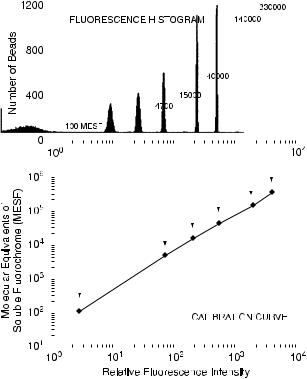
One further step toward calibration has been taken with the use of a calibration curve made with sets of beads with known numbers of ¯uorochromes on their surface. Such calibrated beads are available with known numbers of PE molecules. Similar, but less direct, beads are available with ¯uorochrome molecules that have been calibrated in units equivalent to the intensity of ¯uorochrome molecules in solution (``MESF'' units ˆ ``molecular equivalents of soluble ¯uorochrome''). With these beads, a curve can be obtained (Fig. 6.6), giving each channel on the ADC a calibration in number of ¯uorochrome molecules (for PE) or MESF values (for ¯uorescein). In this way, the background ¯uorescence of a control sample can be expressed as an equivalent number of ¯uorochrome (or MESF) molecules and can be subtracted from the number of ¯uorochrome molecules of a stained sample. The ¯uorescence of the stained sample can then be expressed as, for example, PE molecules over and above the background level.
Having now determined a value that might, with luck, quantify the brightness of a particle in terms of ¯uorochrome molecules or soluble equivalents, one may wonder how best to convert that value into the number of receptors or antigens on the surface of the cell. At ®rst thought, calculation of this value might be determined if values are known for the number of ¯uorochrome molecules per antibody (the F/P ratio) used in the staining procedure. Unfortunately, even if this value has been determined chemically, it will not apply within a system in which there is quenching of the ¯uorescence from ¯uorochromes in closely packed regions on a cell surface (causing a bound ¯uorochrome to ¯uoresce considerably less brightly than in its soluble form). Moreover, the F/P value will almost certainly not be known in a system with indirect staining and undetermined ampli®- cation. At the present time, this F/P value can only be used with con®dence in certain staining systems where antibodies have been certi®ed to contain a single PE molecule per antibody and are used in
Leukocytes, Surface Proteins, and the Strategy of Gating |
97 |
||||||||||||||||||
|
|
|
|
|
|
|
|
|
|
|
|
|
|
|
|
|
|
|
|
|
|
|
|
|
|
|
|
|
|
|
|
|
|
|
|
|
|
|
|
|
|
|
|
|
|
|
|
|
|
|
|
|
|
|
|
|
|
|
|
|
|
|
|
|
|
|
|
|
|
|
|
|
|
|
|
|
|
|
|
|
|
|
|
|
|
|
|
|
|
|
|
|
|
|
|
|
|
|
|
|
|
|
|
|
|
|
|
|
|
|
|
|
|
|
|
|
|
|
|
|
|
|
|
|
|
|
|
|
|
|
|
|
|
|
|
|
|
|
|
|
|
|
|
|
|
|
|
|
|
|
|
|
|
|
|
|
|
|
|
|
|
|
|
|
|
|
|
|
|
|
|
|
|
|
|
|
|
|
|
|
|
|
|
|
|
|
|
|
|
|
|
|
|
|
|
|
|
|
|
|
|
|
|
|
|
|
|
|
|
|
|
|
|
|
|
|
|
|
|
|
|
|
|
|
|
|
|
|
|
|
|
|
|
|
|
|
|
|
|
|
|
|
|
|
|
|
|
|
|
|
|
|
|
|
|
|
|
|
|
|
|
|
|
|
|
|
|
|
|
|
|
|
|
|
|
|
|
|
|
|
|
|
|
|
|
|
|
|
|
|
|
|
|
|
|
|
|
|
|
|
|
|
|
|
|
|
|
|
|
|
|
|
|
|
|
|
|
|
|
|
|
|
|
|
|
|
|
|
|
|
|
|
|
|
|
|
|
|
|
|
|
|
|
|
|
|
|
|
|
|
|
|
|
|
|
|
|
|
|
|
|
|
|
|
|
|
|
|
|
|
|
|
|
|
|
|
|
|
|
|
|
|
|
|
|
|
|
|
|
|
|
|
|
|
|
|
|
|
|
|
|
|
|
|
|
|
|
|
|
|
|
|
|
|
|
|
|
|
|
|
|
|
|
|
|
|
|
|
|
|
|
|
|
|
|
|
|
|
|
|
|
|
|
|
|
|
|
|
|
|
|
|
|
|
|
|
|
|
|
|
|
|
|
|
|
|
|
|
|
|
|
|
|
|
|
|
|
|
|
|
|
|
|
|
|
|
|
|
|
|
|
|
|
|
|
|
|
|
|
Fig. 6.6. The ¯uorescence histogram of a mixture of ¯uorochrome-conjugated calibration beads and the calibration line for channel numbers and their equivalence in soluble ¯uorescein molecules derived from that histogram. From Givan (2001).
conjunction with standard beads with known numbers of PE molecules. Even in this case, the ®nal value will be in terms of the number of antibodies bound to a cell, and this may not be easily related to the number of receptors per cell (because antibody binding to receptors may be monovalent or bivalent).
Other types of calibration help may be available in the form of a di¨erent type of calibrated microsphere. Beads can be obtained that possess a known number of binding sites for immunoglobulin molecules. They can be treated as if they were cells and stained in the routine way with the antibody stain (direct or indirect) in question. The intensity of the beads with known numbers of antibody binding sites can be used to calibrate the scale, converting ADC channels to
98 |
Flow Cytometry |
antibody binding sites per cell. Problems with quanti®cation using these beads derive from the fact that the avidity of the beads for antibodies can di¨er from the avidity of cells for antibodies so that receptors on beads and on cells may not saturate at equivalent concentrations. In addition, as above, antibodies have the possibility of binding either monovalently or bivalently under di¨erent conditions.
SENSITIVITY
Light detection sensitivity for stained cells is determined by two factors: the amount of background signal from the cells and the breadth of the population distributions of the background and of the positive signals that you are trying to detect over background. In other words, you can detect staining on cells that is just slightly brighter than background if none of the stained cells overlaps with the brightest cells in the unstained (control) population. However, if the control and ¯uorescent populations have very broad distributions (that is, the range of values is great), their averages have to be well separated from each other if you are going to be able to say that a particular cell belongs to a stained population rather than a background population (Fig. 6.7). This is, in concept, no di¨erent from the requirement in statistics for a narrow standard deviation to conclude that two populations with closely similar means are signi®cantly di¨erent from each other, but a less stringent requirement for narrow standard deviation if the two population means are well separated.
As a practical matter, the way to make a ¯ow cytometer more sensitive in detecting weak light signals is to lower the noise in the background by using good optical, ¯uidic, and electronic components and to align the instrument well so that ¯uorescence detection e½ciency is high and ¯uorescence distributions are as narrow as possible. The result of these considerations leads, however, to the unavoidable conclusion that cells with intrinsically high background make it more di½cult to detect low numbers of ¯uorochromes derived from the staining procedure. Think of trying to see the stars in the daytime. Certain classes of cells have greater auto¯uorescence than others as a result of their metabolic activity. All other things being equal, large cells have more auto¯uorescence than small cells, simply because they are larger and have more auto¯uorescent molecules associated with each cell.