

Flow Cytometry - First Principles (Second Edition)
.pdf140 |
Flow Cytometry |
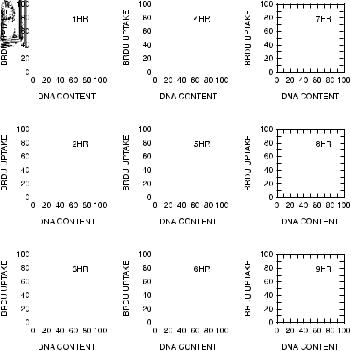
ways. Flow cytometry does, however, o¨er a more direct way to measure DNA synthesis. Bromodeoxyuridine (sometimes abbreviated BrdU or BUdR or BrdUdr) is a thymidine analog. If cells are pulsed with BrdU, it will be incorporated into the cell's DNA in the place of thymidine. Fluorescein-conjugated monoclonal antibodies with speci®city for BrdU are available so that cells that have been pulsed with BrdU for a short period of time (about 30 min) can then be treated to partially denature their DNA, exposing the BrdU within the double helix so that it can be stained with the anti-BrdU antibody. Any cells that have incorporated BrdU during the pulse will then stain ¯uorescein positive.
The clever part of this technique is that the denatured DNA can be stained with propidium iodide at the same time. The resulting twocolor contour plots look like those in Figure 8.12. The red ¯uorescence axis shows the propidium iodide distribution (proportional to DNA content) with which we have grown familiar; the green ¯uorescence axis shows which of these nuclei have actually incorporated BrdU during the pulse. As might be expected, the cells in the middle region of the propidium iodide distribution have all incorporated BrdU; but a proportion of the cells at either end of the propidium iodide distribution have also done so. This method, while somewhat
Fig. 8.12. Fluorescein (FITC) histogram, propidium iodide (PI) histogram, and dual-color correlated contour plot of human keratinocytes cultured for 4 days, pulsed with BrdU, and then stained with FITC±anti-BrdU and PI. Data courtesy of Malcolm Reed.
DNA in Life and Death |
141 |
time consuming and a bit tricky technically, does allow a ¯ow cytometrist to quantify the proportion of cells in S phase in a way that cannot be done accurately with simple propidium iodide staining. The bromodeoxyuridine method is, in fact, more comparable than simple propidium iodide staining to the traditional method of measuring cell division by assaying the incorporation of tritiated thymidine. It also provides the ability to distinguish cells that may be blocked in S phase from those that are actually incorporating nucleotides.
BrdU staining has also been used to provide information about the kinetics of cell cycles. If we consider cells pulsed for a short period of time with a small amount of BrdU and then killed immediately and stained with both propidium iodide and with a ¯uorescein±anti-BrdU monoclonal antibody, the ¯uorescein±antibody should stain equally all cells in S phase (stretching from the 2C peak to the 4C peak). If, however, we wait for some time before killing the cells (and if the BrdU has been used up quickly), then the cells that have incorporated the BrdU (that is, all the cells that were in S phase at the time of the pulse) will have synthesized more DNA, and some of those cells will have progressed into the G2 or M phase of the cell cycle (or indeed cycled back to G1). In addition, some new cells will have started to make DNA after the BrdU had been used up, and these cells will now be in S phase but will have DNA that does not contain BrdU. The contour plots for these cases look like those in Figure 8.13. We can estimate the rate of movement of the BrdU-containing cells through S phase and into the G2 peak by assuming that they are evenly distributed throughout S phase at the time of pulsing and then sampling and staining the cells at one subsequent time. The rate of increase in propidium iodide intensity of the ¯uorescein-positive nuclei is equivalent to their rate of DNA synthesis and provides us with information about the cycle time of the actively dividing cells. Moreover, the cycle time of the ¯uorescein-positive cells, in conjunction with the proportion of cells in S phase, can be used to estimate the doubling time of a population of cells.
Given the possible ambiguities in attempting to correlate clinical prognosis with aneuploidy and given the knowledge that malignant cells typically have ``out-of-control'' or unregulated proliferation, considerable work has been done in an attempt to use ¯ow cytometry to correlate the percentage of cells in S phase with clinical prognosis in malignant disease. Although ¯ow cytometrists tend to have reser-
142 |
|
|
|
|
|
|
|
|
|
|
|
|
|
|
|
|
|
|
|
|
|
Flow Cytometry |
|||||||||||||||||||||
|
|
|
|
|
|
|
|
|
|
|
|
|
|
|
|
|
|
|
|
|
|
|
|
|
|
|
|
|
|
|
|
|
|
|
|
|
|
|
|
|
|
|
|
|
|
|
|
|
|
|
|
|
|
|
|
|
|
|
|
|
|
|
|
|
|
|
|
|
|
|
|
|
|
|
|
|
|
|
|
|
|
|
|
|
|
|
|
|
|
|
|
|
|
|
|
|
|
|
|
|
|
|
|
|
|
|
|
|
|
|
|
|
|
|
|
|
|
|
|
|
|
|
|
|
|
|
|
|
|
|
|
|
|
|
|
|
|
|
|
|
|
|
|
|
|
|
|
|
|
|
|
|
|
|
|
|
|
|
|
|
|
|
|
|
|
|
|
|
|
|
|
|
|
|
|
|
|
|
|
|
|
|
|
|
|
|
|
|
|
|
|
|
|
|
|
|
|
|
|
|
|
|
|
|
|
|
|
|
|
|
|
|
|
|
|
|
|
|
|
|
|
|
|
|
|
|
|
|
|
|
|
|
|
|
|
|
|
|
|
|
|
|
|
|
|
|
|
|
|
|
|
|
|
|
|
|
|
|
|
|
|
|
|
|
|
|
|
|
|
|
|
|
|
|
|
|
|
|
|
|
|
|
|
|
|
|
|
|
|
|
|
|
|
|
|
|
|
|
|
|
|
|
|
|
|
|
|
|
|
|
|
|
|
|
|
|
|
|
|
|
|
|
|
|
|
|
|
|
|
|
|
|
|
|
|
|
|
|
|
|
|
|
|
|
|
|
|
|
|
|
|
|
|
|
|
|
|
|
|
|
|
|
|
|
|
|
|
|
|
|
|
|
|
|
|
|
|
|
|
|
|
|
|
|
|
|
|
|
|
|
|
|
|
|
|
|
|
|
|
|
|
|
|
|
|
|
|
|
|
|
|
|
|
|
|
|
|
|
|
|
|
|
|
|
|
|
|
|
|
|
|
|
|
|
|
|
|
|
|
|
|
|
|
|
|
|
|
|
|
|
|
|
|
|
|
|
|
|
|
|
|
|
|
|
|
|
|
|
|
|
|
|
|
|
|
|
|
|
|
|
|
|
|
|
|
|
|
|
|
|
|
|
|
|
|
|
|
|
|
|
|
|
|
|
|
|
|
|
|
|
|
|
|
|
|
|
|
|
|
|
|
|
|
|
|
|
|
|
|
|
|
|
|
|
|
|
|
|
|
|
|
|
|
|
|
|
|
|
|
|
|
|
|
|
|
|
|
|
|
|
|
|
|
|
|
|
|
|
|
|
|
|
|
|
|
|
|
|
|
|
|
|
|
|
|
|
|
|
|
|
|
|
|
|
|
|
|
|
|
|
|
|
|
|
|
|
|
|
|
|
|
|
|
|
|
|
|
|
|
|
|
|
|
|
|
|
|
|
|
|
|
|
|
|
|
|
|
|
|
|
|
|
|
|
|
|
|
|
|
|
|
|
|
|
|
|
|
|
|
|
|
|
|
|
|
|
|
|
|
|
|
|
|
|
|
|
|
|
|
|
|
|
|
|
|
|
|
|
|
|
|
|
|
|
|
|
|
|
|
|
|
|
|
|
|
|
|
|
|
|
|
|
|
|
|
|
|
|
|
|
|
|
|
|
|
|
|
|
|
|
|
|
|
|
|
|
|
|
|
|
|
|
|
|
|
|
|
|
|
|
|
|
|
|
|
|
|
|
|
|
|
|
|
|
|
|
|
|
|
|
|
|
|
|
|
|
|
|
|
|
|
|
|
|
|
|
|
|
|
|
|
|
|
|
|
|
|
|
|
|
|
|
|
|
|
|
|
|
|
|
|
|
|
|
|
|
|
|
|
|
|
|
|
|
|
|
|
|
|
|
|
|
|
|
|
|
|
|
|
|
|
|
|
|
|
|
|
|
|
|
|
|
|
|
|
|
|
|
|
|
|
|
|
|
|
|
|
|
|
|
|
|
|
|
|
|
|
|
|
|
|
|
|
|
|
|
|
|
|
|
|
|
|
|
|
|
|
|
|
|
|
|
|
|
|
|
|
|
|
|
|
|
|
|
|
|
|
|
|
|
|
|
|
|
|
|
|
|
|
|
|
|
|
|
|
|
|
|
|
|
|
|
|
|
|
|
|
|
|
|
|
|
|
|
|
|
|
|
|
|
|
|
|
|
|
|
|
|
|
|
|
|
|
|
|
|
|
|
|
|
|
|
|
|
|
|
|
|
|
|
|
|
|
|
|
|
|
|
|
|
|
|
|
|
|
|
|
|
|
|
|
|
|
|
|
|
|
|
|
|
|
|
|
|
|
|
|
|
|
|
|
|
|
|
|
|
|
|
|
|
|
|
|
|
|
|
|
|
|
|
|
|
|
|
|
|
|
|
|
|
|
|
|
|
|
|
|
|
|
|
|
|
|
|
|
|
|
|
|
|
|
|
|
|
|
|
|
|
|
|
|
|
|
|
|
|
|
|
|
|
|
|
|
|
|
|
|
|
|
|
|
|
|
|
|
|
|
|
|
|
|
|
|
|
|
|
|
|
|
|
|
|
|
|
|
|
|
|
|
|
|
|
|
|
|
|
|
|
|
|
|
|
|
|
|
|
|
|
|
|
|
|
|
|
|
|
|
|
|
|
|
|
|
|
|
|
|
|
|
|
|
|
|
|
|
|
|
|
|
|
|
|
|
|
|
|
|
|
|
|
|
|
|
|
|
|
|
|
|
|
|
|
|
|
|
|
|
|
|
|
|
|
|
|
|
|
|
|
|
|
|
|
|
|
|
|
|
|
|
|
|
|
|
|
|
|
|
|
|
|
|
|
|
|
|
|
|
|
|
|
|
|
|
|
|
|
|
|
|
|
|
|
|
|
|
|
|
|
|
|
|
|
|
|
|
|
|
|
|
|
|
|
|
|
|
|
|
|
|
|
|
|
|
|
|
|
|
|
|
|
|
|
|
|
|
|
|
|
|
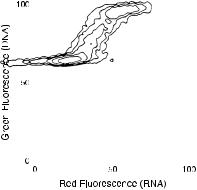
Fig. 8.13. Dual-color distribution of BrdU versus DNA content for Chinese hamster cells pulsed with BrdU and then sampled hourly. From McNally and Wilson (1990).
vations about the reproducibility of S-phase determinations from mathematical modeling of a propidium iodide ¯uorescence histogram (for the reasons mentioned above), many reports have been published in the medical literature showing useful correlation of the proportion of cells in S phase (the ``S-phase fraction'') with poor clinical prognosis (see Chapter 10).
TWO-COLOR ANALYSIS FOR DNA AND
ANOTHER PARAMETER
Having described the analysis of cells for total DNA content (with propidium iodide) and newly synthesized DNA (with BrdU), we may now go on to consider some other techniques for exploiting the multi-
DNA in Life and Death |
143 |
||||
|
|
|
|
|
|
|
|
|
|
|
|
|
|
|
|
|
|
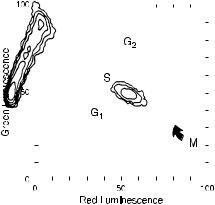
Fig. 8.14. DNA (green ¯uorescence) versus RNA (red ¯uorescence) content of human leukemic cells stained with acridine orange. From Darzynkiewicz and Traganos (1990).
parameter potential of the ¯ow cytometer with the dual staining of cells for both DNA and some other parameter. Zbigniew Darzynkiewicz and coworkers in New York have used acridine orange with great success to look at the DNA and RNA contents of cycling cells. Because acridine orange ¯uoresces red when it binds to RNA and green when it binds to DNA, cells can be examined simultaneously for both constituents. Dual analysis of this type has given us increased information about the progression of cells through the cell cycle. Speci®cally, it can be seen quite clearly from plots like that in Figure 8.14 that some of the cells with the 2C amount of DNA (G0 or G1) contain increased levels of RNA. The synthesis of RNA appears to be an early event in the entrance of a cell into the division cycle. After this initial increase in RNA content, cells synthesize more RNA as they begin to synthesize DNA (S phase). At mitosis, they have increased levels of both RNA and DNA compared with resting cells. Analysis of the acridine orange staining of cycling cells has led, in particular, to improved ability to analyze early events in the division cycle.
This acridine orange technique has been taken one step further by Darzynkiewicz's group. Because acridine orange ¯uoresces red when bound to single-stranded nucleic acid, but green with double-stranded nucleic acid, acridine orange can be used under mildly denaturing
144 |
|
|
Flow Cytometry |
|
|
|
|
|
|
|
|
|
|
|
|
Fig. 8.15. L1210 cells treated with RNase and acid and then stained with acridine orange reveal that DNA in mitotic cells is extensively unwound and exhibits increased red and decreased green ¯uorescence relative to DNA from cells in other phases of the cell cycle. From Darzynkiewicz (1990).
conditions (and in the presence of RNase) to distinguish easily denatured from more resistant forms of DNA. Once RNase has been used to remove the RNA, mild denaturation can be used to cause unwinding of the helical forms of DNA that are loosely packed (e.g., in cells that are in the process of DNA synthesis); it will not a¨ect DNA that is tightly condensed (e.g., in resting cells). Figure 8.15 indicates the kind of contour plots that can be obtained from this type of procedure.
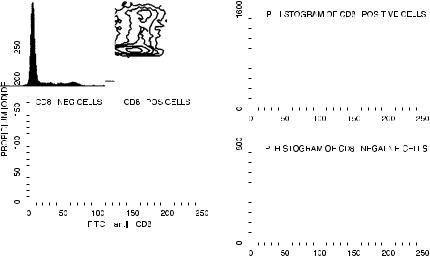
Dual staining of cells can also be used to look at DNA and protein markers simultaneously. Using methods similar to those described in the previous chapter for looking at cytoplasmic proteins simultaneously with surface membrane proteins, cells can be stained for surface proteins, then ®xed and permeabilized, and then stained for DNA. Figure 8.16 shows the way that this type of technique can be used to permit the cell cycle analysis of subpopulations of cells independently. In this particular example, it can be seen that, after treatment with the mitogen phytohemagglutinin, it is the CD8-positive cells more than the CD8-negative cells that have been induced to enter S phase.
Similar techniques can be used to stain cells for both DNA and internal (cytoplasmic or nuclear) markers. By ®xing the cells, then
|
|
|
|
|
|
|
|
|
|
|
|
|
|
|
|
|
|
DNA in Life and Death |
145 |
||||||||||||||||||||||||||
|
|
|
|
|
|
|
|
|
|
|
|
|
|
|
|
|
|
|
|
|
|
|
|
|
|
|
|
|
|
|
|
|
|
|
|
|
|
|
|
|
|
|
|
|
|
|
|
|
|
|
|
|
|
|
|
|
|
|
|
|
|
|
|
|
|
|
|
|
|
|
|
|
|
|
|
|
|
|
|
|
|
|
|
|
|
|
|
|
|
|
|
|
|
|
|
|
|
|
|
|
|
|
|
|
|
|
|
|
|
|
|
|
|
|
|
|
|
|
|
|
|
|
|
|
|
|
|
|
|
|
|
|
|
|
|
|
|
|
|
|
|
|
|
|
|
|
|
|
|
|
|
|
|
|
|
|
|
|
|
|
|
|
|
|
|
|
|
|
|
|
|
|
|
|
|
|
|
|
|
|
|
|
|
|
|
|
|
|
|
|
|
|
|
|
|
|
|
|
|
|
|
|
|
|
|
|
|
|
|
|
|
|
|
|
|
|
|
|
|
|
|
|
|
|
|
|
|
|
|
|
|
|
|
|
|
|
|
|
|
|
|
|
|
|
|
|
|
|
|
|
|
|
|
|
|
|
|
|
|
|
|
|
|
|
|
|
|
|
|
|
|
|
|
|
|
|
|
|
|
|
|
|
|
|
|
|
|
|
|
|
|
|
|
|
|
|
|
|
|
|
|
|
|
|
|
|
|
|
|
|
|
|
|
|
|
|
|
|
|
|
|
|
|
|
|
|
|
|
|
|
|
|
|
|
|
|
|
|
|
|
|
|
|
|
|
|
|
|
|
|
|
|
|
|
|
|
|
|
|
|
|
|
|
|
|
|
|
|
|
|
|
|
|
|
|
|
|
|
|
|
|
|
|
|
|
|
|
|
|
|
|
|
|
|
|
|
|
|
|
|
|
|
|
|
|
|
|
|
|
|
|
|
|
|
|
|
|
|
|
|
|
|
|
|
|
|
|
|
|
|
|
|
|
|
|
|
|
|
|
|
|
|
|
|
|
|
|
|
|
|
|
|
|
|
|
|
|
|
|
|
|
|
|
|
|
|
|
|
|
|
|
|
|
|
|
|
|
|
|
|
|
|
|
|
|
|
|
|
|
|
|
|
|
|
|
|
|
|
|
|
|
|
|
|
|
|
|
|
|
|
|
|
|
|
|
|
|
|
|
|
|
|
|
|
|
|
|
|
|
|
|
|
|
|
|
|
|
|
|
|
|
|
|
|
|
|
|
|
|
|
|
|
|
|
|
|
|
|
|
|
|
|
|
|
|
|
|
|
|
|
|
|
|
|
|
|
|
|
|
|
|
|
|
|
|
|
|
|
|
|
|
|
|
|
|
|
|
|
|
|
|
|
|
|
|
|
|
|
|
|
|
|
|
|
|
|
|
|
|
|
|
|
|
|
|
|
|
|
|
|
|
|
|
|
|
|
|
|
|
|
|
|
|
Fig. 8.16. Cell cycle analysis of CD8-positive and CD8-negative cells. Lymphocytes were cultured with phytohemagglutinin, stained with FITC±anti-CD8 monoclonal antibody, treated with saponin to permeabilize the outer membrane, and then stained with propidium iodide (PI) and RNase. Cells provided by Ian Brotherick.
staining for cytoplasmic markers like cytokeratin (as in the example of staining tumor cells for cytokeratin and estrogen receptors in the previous chapter, Fig. 7.3), and then staining with propidium iodide, classes of cells can be selected for ploidy analysis. In this way, for example, breast tumor cells (which are likely to be of epithelial origin) can be gated in a mixed population from a tumor. Then the cells gated for ¯uorescein±anti-cytokeratin positivity can be further analyzed to see if any of these nuclei are aneuploid. By this technique, minor populations of tumor cells within a heterogeneous population may be selected and their ploidy determined with more sensitivity.
The Darzynkiewicz laboratory has continued, more recently, to use ¯ow cytometry in creative ways to contribute to our knowledge of the regulation of cell division. By staining for DNA as well as cell cycle-regulatory proteins (the cyclins), the presence of these proteins can be associated with certain stages of the cell cycle. Figure 8.17 shows an example of data derived from a protocol staining cells for DNA content along with antibodies against the nuclear proteins H3-P (H3 is a histone, which, when phosphorylated, is associated

146 |
|
|
|
|
|
Flow Cytometry |
|
|
|
|
|
|
|
|
|
|
|
|
|
|
|
|
|
|
|
|
|
|
|
|
|
Fig. 8.17. The use of stains for the intracellular proteins H3-P, cyclin A, and cyclin B1 in conjunction with propidium iodide to distinguish cells with the same DNA content but at di¨erent stages of the cell cycle. From Juan et al (1998).
with chromosomal condensation), cyclin A (a cycle-regulatory protein that begins to accumulate at mid-S phase, reaches maximal concentration at the end of G2, and is degraded early in mitosis), and cyclin B1 (which begins to accumulate at the beginning of G2 and is maximal at the beginning of mitosis, declining at the cell's entry into anaphase). H3-P can dichotomize 4C cells into those that are in the G2 stage of the cycle and those that are actually mitotic. Similarly, the cyclins can additionally separate cells at di¨erent stages of mitosis. Figure 8.18 indicates a summary of the time course for expression of cyclins D, E, A, and B.
Fig. 8.18. A summary of the time course of expression of cyclins D, E, A, and B through the cell cycle. DNA is plotted on the x-axis of the coutour plots and cyclin expression on the y-axis. Courtesy of James Jacobberger.
DNA in Life and Death |
147 |
Some particular issues arise when combining DNA staining with protein staining; these issues are related to those discussed in the previous chapter on combining the staining of intracellular with extracellular proteins. In both cases, the ®xation procedure, while maintaining the integrity of the cells after permeabilization, can also a¨ect the stainability of the molecules in question. In the case of DNA staining, ®xation of cells will cross-link histones on the chromosomes, thus limiting the access of DNA-speci®c ¯uorochromes to their binding sites. In practice, this means that cells ®xed with formaldehyde will maintain their cytoplasmic integrity well but will show decreased propidium iodide ¯uorescence and wider CVs than will cells ®xed with, for example, ethanol. The solution is, once again, a compromise. Short ®xation with low concentrations of formaldehyde followed by detergent treatment works well to permit maintenance of cytoplasmic proteins along with fairly good DNA pro®les. Exact procedures need to be individualized to the proteins and cells in question.
CHROMOSOMES
Until now, the particles ¯owing through our ¯ow cytometer have been cells or nuclei. Other types of particles are, of course, possible. One of the best examples of the successful application of ¯ow cytometry to noncellular systems has been in the analysis of chromosomes. In this case, the particles ¯owing through the system are individual chromosomes that are released from cells that have been arrested in metaphase (much the same conditions as those that are used to prepare chromosomes for analysis in metaphase spreads under the microscope). The released chromosomes are stained with a DNA stain (like propidium iodide) and then sent through the ¯ow cytometer. The resulting histograms of ¯uorescence intensity reveal peaks whose positions along the x-axis are proportional to the amount of DNA in the chromosome and whose areas are proportional to the number of chromosomes with that particular DNA content (Fig. 8.19). Histograms of this type are called ¯ow karyotypes, by analogy with the microscope karyotypes derived from conventional genetic analysis.
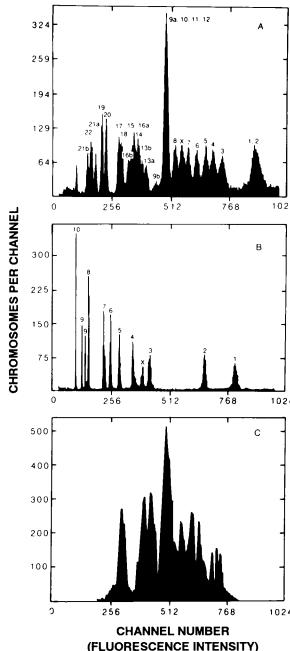
Figure 8.20 shows examples of ¯ow karyotypes from di¨erent
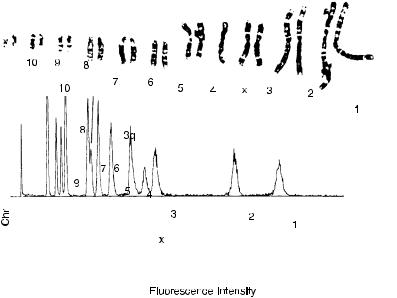
148 |
|
|
|
|
|
|
|
|
|
|
|
Flow Cytometry |
|||||||||||||||
|
|
|
|
|
|
|
|
|
|
|
|
|
|
|
|
|
|
|
|
|
|
|
|
|
|
|
|
|
|
|
|
|
|
|
|
|
|
|
|
|
|
|
|
|
|
|
|
|
|
|
|
|
|
|
|
|
|
|
|
|
|
|
|
|
|
|
|
|
|
|
|
|
|
|
|
|
|
|
|
|
|
|
|
|
|
|
|
|
|
|
|
|
|
|
|
|
|
|
|
|
|
|
|
|
|
|
|
|
|
|
|
|
|
|
|
|
|
|
|
|
|
|
|
|
|
|
|
|
|
|
|
|
|
|
|
|
|
|
|
|
|
|
|
|
|
|
|
|
|
|
|
|
|
|
|
|
|
|
|
|
|
|
|
|
|
|
|
Fig. 8.19. A ¯ow karyotype (¯uorescence histogram) of Chinese hamster chromosomes stained with propidium iodide (PI). The G-banded chromosomes from this particular aneuploid cell line are included for comparison with the histogram peaks. From Cram et al. (1988).
species. While some species with small numbers of chromosomes reveal relatively simple histogram patterns, the 23 pairs of chromosomes in the human lead to a rather complex pattern. It is apparent that, although 23 pairs of chromosomes are readily distinguished under the microscope by a combination of size, centromere position, and banding patterns, many of these pairs have similar total DNA content and are not distinguishable in a ¯ow histogram. We can obtain considerable help by using Hoechst 33258 and chromomycin A3 in a dual staining system: Hoechst 33258 stains adenineand thymine-rich regions of DNA preferentially, and chromomycin A3 is speci®c for regions rich in the guanine and cytosine base pairs. By using this dual system, we ®nd that some chromosomes with closely similar total DNA content have di¨ering base pair ratios. Compare particularly the positions of chromosomes 13±16 in the one-dimensional histograms (Fig. 8.20A) with these same chromosomes (now separable) in the contour plot (Fig. 8.21). Unfortunately, chromosomes 9±12 are not distinguishable with either system.
DNA in Life and Death |
149 |
Fig. 8.20. Flow karyotypes from human chromosomes (A), hamster chromosomes (B), and mouse chromosomes (C ). From Gray and Cram (1990).