

The Elisa guidebook
.pdf3. Convert the OD values obtained for the wells that contained the two competitors into percentage of competition using the two values just calculated.
Page 213
Table 12
Plate Data from the Competition of Samples
of Guinea Pig and Rabbit IgG for Direct ELISA
|
1 |
2 |
3 |
4 |
5 |
6 |
7 |
8 |
9 |
10 |
11 |
12 |
A |
0.04 |
0.05 |
0.07 |
0.10 |
0.23 |
0.35 |
0.56 |
0.78 |
0.98 |
1.12 |
1.34 |
1.34 |
B |
0.06 |
0.06 |
0.08 |
0.12 |
0.25 |
0.41 |
0.61 |
0.79 |
1.01 |
1.14 |
1.35 |
1.38 |
C |
0.07 |
0.05 |
0.09 |
0.13 |
0.21 |
0.43 |
0.58 |
0.81 |
1.05 |
1.17 |
1.36 |
1.34 |
D |
1.12 |
1.23 |
1.34 |
1.35 |
1.34 |
1.36 |
1.29 |
1.37 |
1.36 |
1.41 |
1.32 |
1.34 |
E |
1.14 |
1.24 |
1.35 |
1.35 |
1.36 |
1.39 |
1.34 |
1.36 |
1.33 |
1.34 |
1.32 |
1.38 |
F |
1.13 |
1.25 |
1.34 |
1.38 |
1.38 |
1.41 |
1.42 |
1.35 |
1.33 |
1.38 |
1.34 |
1.32 |
G |
1.35 |
1.34 |
1.41 |
1.35 |
1.36 |
1.32 |
1.29 |
1.34 |
1.37 |
1.39 |
1.32 |
1.45 |
H |
0.05 |
0.06 |
0.05 |
0.07 |
0.08 |
0.04 |
0.07 |
0.05 |
0.04 |
0.07 |
0.08 |
0.04 |
A¨CC: guinea pig IgG, D¨CF: rabbit IgG.
7.5.3¡ª
Example from the Data in Table 12
The mean of row G = 1.35, which is equivalent to 0% competition (a lot of color). The mean of row H = 0.07, which is equivalent to 100% competition (little color). Subtract the mean of row H from all the values obtained. If the value is minus then call it 0. This determines the 100¨C0% OD competition values (i.e., the range is from 0 to 1.29 OD).
Using a simple formula, the percentage of competition of the samples can be calculated. Table 13 presents the processed data with respect to subtraction of background for all data, using the following equation
As examples for further processing and estimation of competition, we have for the guinea pig Ig competition experiment (backgrounds already taken off test results and range calculated):
Range = 1.29
Taking row 5 we have:
Taking row 6 we have:
Taking row 7 we have:
Page 214
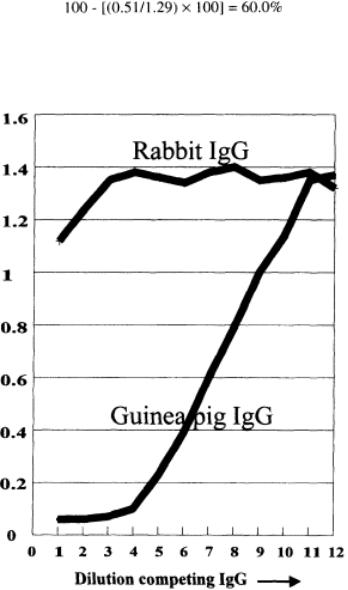
Fig. 32. Competition of guinea pig IgG and rabbit IgG for guinea pig system.
Repeat this exercise for your data. Plot the data relating the percentage of competition against the concentration or dilution of the IgGs as in Fig. 33.
7.5.4¡ª
Analysis of Data
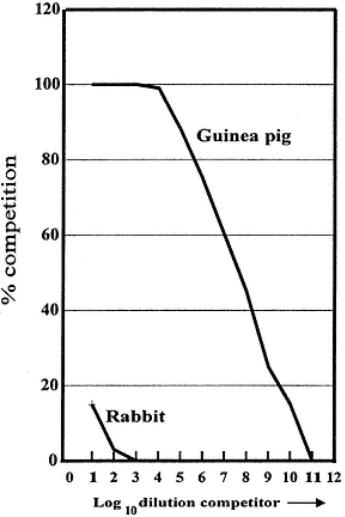
1.Note that as you dilute out the homologous competitor (the guinea pig Ig), the competition reduces.
2.Note that the plateau of 100% competition is where the competing Ig is in large excess over that on the plate.
3.Suggest what is happening at the 50% competition point.
4.Note that the competition curve is sigmoidal.
5.Note that the rabbit Ig hardly competes. Why?
6.Suggest how the sensitivity of the assay might be altered? A clue here is to examine what happens if we reduce (1) the amount of antigen on the solid phase and (2) the amount of conjugate in the test.
Page 215
Table 13
Mean Values in Table 12
for Various Dilutions of Competing Antigensa
|
Mean ABC |
Mean DEF |
||
|
minus row H guinea |
minus row H |
||
|
pig IgG |
rabbit IgG |
||
1 |
|
0 |
|
1.17 |
|
|
|||
2 |
|
0 |
|
1.18 |
|
|
|||
3 |
|
0 |
|
1.29 |
|
|
|||
4 |
|
0.01 |
|
1.35 |
|
|
|||
5 |
|
0.16 |
|
1.28 |
|
|
|||
6 |
|
0.33 |
|
1.27 |
|
|
|||
7 |
|
0.51 |
|
1.27 |
|
|
|||
8 |
|
0.73 |
|
1.29 |
|
|
|||
9 |
|
0.93 |
|
1.28 |
|
|
|||
10 |
|
1.10 |
|
1.29 |
|
|
|||
11 |
|
1.28 |
|
1.26 |
|
|
|||
12 |
|
1.29 |
|
1.27 |
|
|
|||
aMean row G ¨C mean row H = 1.29 = the range.
7.6¡ª
Indirect Assay: Antigen Competition
This exercise is similar to the direct competition assay for antigen except the antigen is detected by an unlabeled antiserum (rabbit anti-guinea pig IgG), which in turn is detected using an antispecies conjugate. Here, the heterologous antigen is bovine IgG. Thus, the indirect assay is optimized as in Subheading 2. You can use the results of the CBT in this chapter (Table 3) to assess the following:
1.The best guinea pig concentration/dilution to adsorb to wells.
2.The optimum amount of antibody to give about 70% binding to the optimum amount of antigen found as shown in
Fig. 30.
7.6.1¡ª Materials
1.Ag1: guinea pig IgG at 1 mg/mL for attachment to solid phase.
2.Ag2: samples of (a) guinea pig IgG standard solution (known concentration of 1 mg/mL, (b) three solutions of guinea pig IgG at unkown concentration, and (c) bovine IgG solution at 1 mg/mL.
3.Ab: rabbit anti-guinea pig IgG.
4.Ab*E: pig anti-rabbit pig IgG conjugated to HRP.
5.Microplates.
6.Multichannel and single-channel 10 mL, 1 mL pipets.
Page 216
Fig. 33.
Percentage of competition plots of guinea pig and rabbit IgG competing for the guinea pig system.
7.Carbonate/bicarbonate, pH 9.6, 0.05 M.
8.PBS 1% BSA, 0.05% Tween-20.
9.Solution of OPD in citrate buffer.
10.Hydrogen peroxide.
11.Washing solution.

12.Paper towels.
13.Small volume bottles.
14.1M sulfuric acid in water.
15.Multichannel spectrophotometer.
16.Clock.
17.Graph paper.
18.Calculator.
Page 217
Fig. 34.
Plate design for addition of competitors. 1, Guinea pig control; 2, bovine IgG; 3, sample A; 4, sample B; 5, sample C.
These competition steps are identical to the direct assay and the data are processed in the same way. The extra step is to detect any reacted antibody with the antispecies conjugate.
7.6.2¡ª Method
1.Coat the wells of a microplate with 50 µL, of guinea pig Ig at optimum concentration found from CBT.
2.Wash the wells.
3.Dilute the homologous guinea pig IgG competitor of known concentration and the bovine Ig sample to 40 µg/mL in blocking buffer.
4.Take the 3 samples of unknown levels of guinea pig Ig and dilute 1/10 in blocking buffer.
5.Add 50 µL of blocking buffer to all the wells of the microplate that is coated with the optimum guinea pig Ig.
6.Make a twofold dilution range of all the diluted samples. Thus, add 50 µL of the initial dilution as shown in the plate plan in Fig. 34. Prepare duplicate columns of each for eight wells.
7.Add 50 µL of the pre-titrated antibody against the guinea pig Ig to columns 1¨C11. Add 50 µL of blocking buffer to column 12.
8.Incubate under conditions in which initial CBT were performed. Mix contents every 10 min (unless overnight incubation is being used).
9.Wash the wells and blot.
Page 218
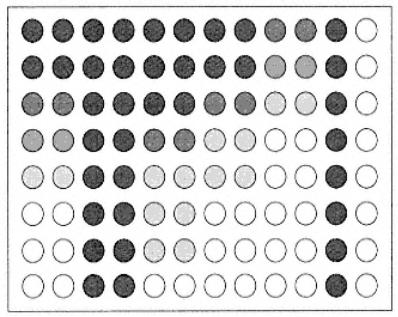
Fig. 35.
Representation of place of competition assay.
See the data in Table 12.
10.Add 50 µL of the the optimal diluton of the pig anti-guinea pig conjugate, per well and incubate at 37¡ãC for 1 h. Wash the plates.
11.Add the OPD substrate/chromophore solution (50 µL per well), and then stop the reaction by addition of 50 µL of 1 M H2SO4 after 10 min.
12.Read the OD using a spectrophotometer at 492 nm.
7.6.3¡ª
Data: Typical Results
Figure 35 represents the appearance of the stopped plate. Plate data as shown in Table 14.
7.6.4¡ª
Treatment of Data

1.Take the mean value of the OD from row 12 (0.08 in data from Table 14).
2.Subtract this from all the ODs of the rest of plate.
3.For each of the duplicate wells, find the mean OD for each competitor dilution. Thus, we have the values given in
Table 15.
4.Take the mean result of column 11 in Table 15 = 1.26. This is the 0% competition value. Use the following formula to calculate the percentage of competition of each IgG dilution:
Thus, for data in Table 15, we have the processed data in Table 16. Plot the competition curves relating competition to log10 dilution or concentration as shown in Fig. 36.
Page 219
Table 14
Plate Data for Indirect Competition ELISA to Measure Antigen
|
Guinea |
Bovine |
Guinea |
Guinea |
Guinea |
0% |
100% |
|||||
|
pig test |
|
|
pig 1 |
pig 2 |
pig 3 |
|
|
||||
|
control |
|
|
|
|
|
|
|
|
|
|
|
|
1 |
2 |
3 |
4 |
5 |
6 |
7 |
8 |
9 |
10 |
11 |
12 |
A |
1.31 |
1.30 |
1.31 |
1.33 |
1.32 |
1.32 |
1.26 |
1.34 |
1.12 |
1.10 |
1.34 |
0.06 |
B |
1.12 |
1.14 |
1.32 |
1.34 |
1.28 |
1.29 |
1.21 |
1.18 |
0.88 |
0.83 |
1.32 |
0.08 |
C |
0.79 |
0.77 |
1.29 |
1.28 |
1.09 |
1.10 |
1.00 |
0.98 |
0.68 |
0.66 |
1.34 |
0.09 |
D |
0.57 |
0.54 |
1.27 |
1.19 |
0.85 |
0.79 |
0.76 |
0.74 |
0.44 |
0.43 |
1.32 |
0.06 |
E |
0.33 |
0.36 |
1.25 |
1.24 |
0.67 |
0.69 |
0.47 |
0.48 |
0.22 |
0.23 |
1.29 |
0.08 |
F |
0.18 |
0.15 |
1.25 |
1.26 |
0.41 |
0.45 |
0.26 |
0.27 |
0.09 |
0.09 |
1.34 |
0.09 |
G |
0.09 |
0.10 |
1.21 |
1.22 |
0.30 |
0.29 |
0.16 |
0.17 |
0.08 |
0.09 |
1.33 |
0.08 |
H |
0.08 |
0.07 |
1.15 |
1.18 |
0.13 |
0.15 |
0.09 |
0.07 |
0.07 |
0.06 |
1.35 |
0.06 |
7.6.5¡ª
Examination of Data
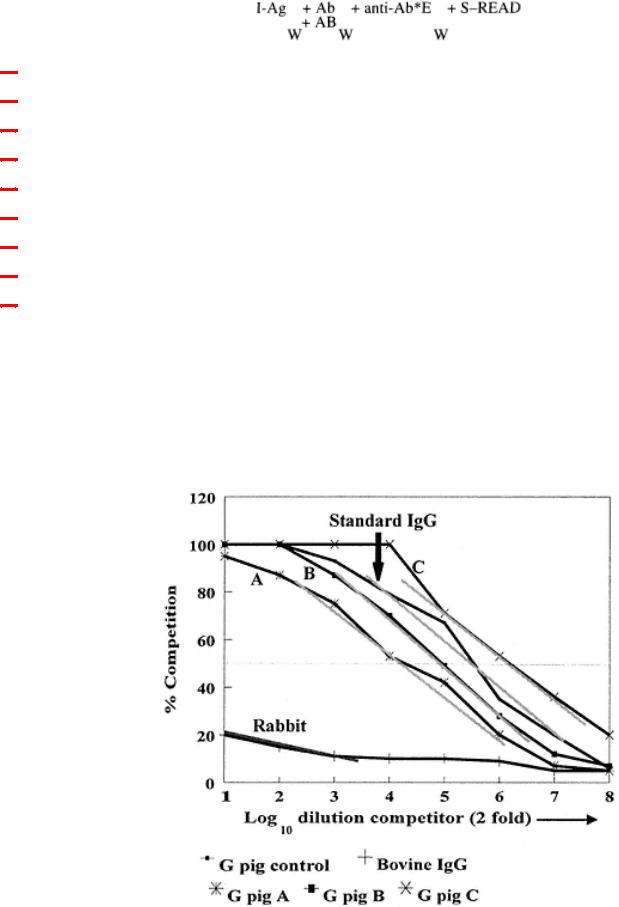
1.The bovine IgG competition is very low, and the slope of the curve is very different from those of homologous control guinea pig IgG.
2.The curves for all guinea pig competitors are of similar shape.
3.The curves for test guinea pig IgG A, B, and C are displaced as compared to control IgG curve.
A standard curve relating the concentration of guinea pig IgG competitor in the liquid phase to the competition achieved is shown by the control IgG. The concentration of IgG in the other samples can be determined with reference to this standard curve. Since the general slope of the curves is similar, we can compare the relative concentration at any point on the standard curve. Ideally, the best comparison point is at 50% competition. Thus, draw a line across the 50% competition point on your graphs, as indicated in Fig. 37.

Read the dilution of the test IgGs that gives 50% competition, and then relate this to the known IgG concentration necessary to give 50% competition as determined from the standard curve at this point.
Thus, assuming a starting concentration of guinea pig IgG at 2 µg/mL, we have a standard IgG 50% competition = 1/64; a dilution for IgG A = 1/20; a dilution for IgG B = 1/40; and a dilution for IgG C = 1/140. Multiply the dilution factor by the 2 µg to get concentration/milliliters in the test IgG:
1.IgG C = 140/64 ¡Á 2 µg = 4.4 µg/mL.
2.IgG B = 40/64 ¡Á 2 µg = 1.25 µg/mL.
3.IgG A = 20/64 ¡Á 2 µg = 0.63 µg/mL.
Page 220
Table 15
Mean Values of Plate Data Shown in Table 14
|
1 2 |
3 4 |
5 6 |
7 8 |
9 10 |
11 |
A |
1.22 |
1.24 |
1.24 |
1.22 |
1.05 |
1.26 |
B |
1.05 |
1.25 |
1.21 |
1.12 |
0.81 |
1.24 |
C |
0.70 |
1.21 |
1.01 |
0.91 |
0.59 |
1.26 |
D |
0.47 |
1.15 |
0.74 |
0.65 |
0.36 |
1.24 |
E |
0.27 |
1.15 |
0.59 |
0.38 |
0.14 |
1.21 |
F |
0.08 |
1.14 |
0.34 |
0.19 |
0.00 |
1.26 |
G |
0.00 |
1.13 |
0.21 |
0.09 |
0.00 |
1.25 |
H |
0.00 |
1.07 |
0.06 |
0.00 |
0.00 |
1.27 |
Table 16
Competition Percentage Values from Data Shown in Table 15
|
Guinea pig |
Bovine |
|
control |
IgG |
|
1¨C2 |
3¨C4 |
A |
6 |
5 |
B |
20 |
5 |
C |
35 |
9 |
D |
67 |
10 |
E |
79 |
10 |
F |
93 |
11 |
G |
100 |
15 |
H |
100 |
20 |
% Competition (%) |
|
|
Guinea pig 1 IgG |
Guinea pig 2 IgG |
Guinea pig 3 IgG |
5¨C6 |
7¨C8 |
9¨C10 |
5 |
7 |
20 |
7 |
12 |
36 |
20 |
28 |
53 |
42 |
49 |
71 |
53 |
70 |
100 |
75 |
87 |
100 |
87 |
100 |
100 |
95 |
100 |
100 |

Remember that the dilution range is in log10 steps so that the antilog of the value has to be taken to obtain the dilution factor at 50%.
7.6.6¡ª Conclusions
1.We have used a standard curve relating a known concentration of homologous competitor to its competing ability, to measure unknown concentrations of the same IgG in samples. This has analogies to the radioimmunoassay approaches used in the quantification of hormones.
2.Note that if it is known that the substance for detection and quantification is the same immunologically (homologous) as the standard substance used to compute the standard curve, then single dilutions of test could be used and their competing ability read from a standard curve.
Page 221
Fig. 36.
Competition curves for various competitors.
Data is shown in Table 12.
3. Such competition assays can be used to determine the similarity of antigens in the same system competing for a single antiserum. The slopes of the competition lines can be compared to obtain a measure of antigenic relatedness.
7.7¡ª
Indirect Competition Assay for Antibody Detection
7.7.1¡ª
Reaction Scheme
I |
= microplate |
Ag |
= antigen |
Ab |
= pretitrated antibodies to Ag (species X) |
AB |
= competing antibody (from species different from Ab) |
Anti-Ab*E |
= conjugated antispecies in which Ab was produced |
S |
= substrate and chromophore |
W |
= washing step |
+= addition and incubation of reagents
READ |
= reading in a spectrophotometer |
In this exercise, the indirect assay is used to pretitrate the homologous antibody. The optimized system is then competed with a dilution range of antibod-
Page 222
Fig. 37.
Regression of competition curves for various competitors. Data are from Table 14. Regression lines are gray.