

The Elisa guidebook
.pdf4.Stopping solution is 1 M sulfuric acid, and care should be taken in its preparation. It can be stored at room temperature.
5.Read implies using a multichannel spectrophotometer to assess the optical density (OD) values of plates and is in all cases in this chapter read at 492 nm. Plates should also be inspected by eye before reading to determine whether there are gross errors and whether the results are feasible.
1.1¡ª
Direct ELISA:
Titration of Antigen and Antibody
1.1.1¡ª
Learning Principles
1.Measuring the optimum concentration of antigen to coat wells.
2.Measuring the optimum dilution of enzyme-linked antibody.
3.Using multichannel and single-channel micropipets.
4.Revising principles of dilution.
5.Making up and storing of buffers and solutions.
6.Learning to observe tests by eye and by using multichannel spectrophotometers.
7.Handling data.
8.Solving problems.
1.1.2¡ª
Reaction Scheme
I- |
= microplate wells (solid phase) |
Ag |
= guinea pig IgG adsorbed to wells |
Ab*E |
= rabbit ant-iguinea pig conjugated with HRP enzyme |
S |
= H2O2 + OPD (chromophore) |
READ |
= observing by eye or read in spectrophotometer (before or after stopping color |
|
development with H2SO4) |
+= addition of reagent and incubation at 37¡ãC or room temperature for 1 h
W |
= wash wells in PBS (four times) |
1.1.3¡ª
Basis of Assay
The basis of this assay is to dilute the Ag across the plate one way in a buffer that allows passive adsorption, incubate the plate at 37¡ãC or room temperature for 2 h, wash the plate and then dilute the conjugate across the plate, the oppo-
Page 156
site way to the Ag, obtaining a checkerboard titration (CBT) of Ag against Ab*. The Ab*E is diluted in a buffer to prevent nonspecific adsorption of the Ab*E to any free protein binding sites on the wells. After washing, all the wells receive a solution containing the substrate for the enzyme (H2O2) and a chromophore which can change color if the H2O2 is acted on by the enzyme. Thus, the color developing in each well depends on (1) the amount of antigen, and (2) the amount of conjugate that has bound to that antigen. The more conjugate, the more enzyme the more color.
1.1.4¡ª
Materials and Equipment
1.Ag: guinea-pig IgG in PBS at 1 mg/mL.
2.Anti-guinea pig IgG prepared in rabbits conjugated to HRP.
3.96-well microplate for ELISA.
4.12-channel (tipped) micropipet ( 5 to 50-µL).
5.Single-channel micropipet (5 to 50-µL) plus tips and trough.
6.10and 1-mL pipets.
7.Carbonate/bicarbonate buffer, pH 9.5, 0.05 M.
8.PBS containing 10% bovine serum albumin (BSA), 0.05% Tween-20.
9.Solution of OPD in citrate buffer.
10.Bottle of hydrogen peroxide (30% W/V, from 4¡ãC).
11.Washing solution (PBS) reservoir.
12.1 M sulfuric acid in water.
13.Paper towels or thin flat sponge.
14.Small-volume bottles.
15.Multichannel spectrophotometer.
16.Clock.
17.Graph paper.
1.1.5¡ª Practical Details
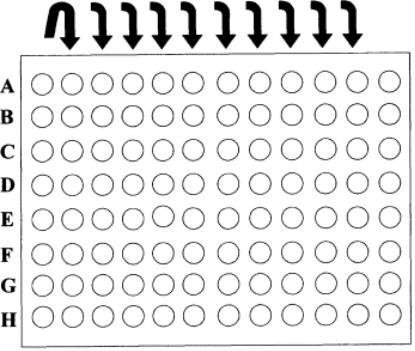
1. Examine a plate, note the position of letters A¨CH and the numbers 1¨C12. Place the plate with A at the top lefthand corner in front of you, as in Fig. 1. The 8 wells labeled with letters (A¨CH) are referred to as rows. The 12 wells labeled by numbers (1¨C12) are referred to as columns.

2.Use the 12-channel pipet with 12 tips to add 50 µL of carbonate buffer to each well of the plate. Use a trough to act as a reservoir for the buffer, and add 6 mL to give extra volume needed for the whole plate.
3.Dilute the antigen (1 mg/mL) to 10 µg/mL in carbonate buffer. Make up 1 mL of the antigen at this concentration; that is, add 1 mL of buffer to a small bottle. Pipet 10 µL of antigen into this. Mix well by rotating the bottle by hand (do not be overvigorous).
4.Set a single-channel micropipet to 50 µL. Add 50 µL of diluted antigen to all the wells of column 1. You should now have 100 µL of antigen in column 1.
Page 157
Fig. 1.
Numbering and lettering on microtiter plate.
5.Put tips into column 1, and mix the contents by pipetting up and down eight times, using the first stop of the pipet. Transfer 50 µL to column 2 (A¨CH), mix, and transfer 50 µL to column 3, and so on, to column 11. After the last mixing, discard the 50 µL left in the pipet. You should now have 50 µL of a dilution series in each row, ending with column 11. Check by eye that the volumes are similar in all the wells (see Fig. 2).
6.Put a lid on the plate and leave it on the bench (flat surface) for 2 h at room temperature, or at 37¡ãC for 2 h or, if more convenient, leave it at 4¡ãC overnight.
7.Wash the plate. The exact method depends on the equipment used. The principle is to discard the contents of the wells by "flicking" them into a sink (or suitable container bowl), then adding PBS and flicking this away four times. The major concern is that all the wells are filled at each stage.
8.Turn the plates onto absorbent paper (sponge), and remove the majority of the residual PBS by gently tapping the plates against the paper (picking the plate up to do this, well openings down).
9. To add the dilutions of conjugate, take the enzyme conjugate from the refrigerator. Check that it is rabbit antiguinea pig IgG, conjugated to HRP (there may be variations in the particular species used to prepare the anti-guinea pig serum labeled: e.g., it could be sheep anti-guinea pig IgG). Make up I mL of a 1/200 dilution of the conjugate in a 5-mL bottle. Use the 5¨C50-µL single-channel pipet to add the conjugate, that is, add 5 µL of conjugate to 1 mL of blocking buffer. (Note: We do not wish to have any nonspecific adsorption of the conjugate to the plastic during the test.) Mix well by gentle swirling action; do not shake vigor-
Page 158
Fig. 2.
Dilution of antigen across plate from columns 1 to 11.
ously. Add 50 µL of blocking buffer to every well of the microplate using the multichannel pipet fitted with 12 tips. This is accomplished by adding about 6 mL of blocking buffer to a trough and pipetting from this. Wash the trough, after dispensing the blocking buffer, using tap water (or PBS). Dry the trough for use with conjugate with paper towel. Pour the conjugate dilution into a trough. Using the multichannel pipet with 12 tips attached, add 50 µL of the conjugate dilution into the first row (A, 1¨C12) of the plate. Thus, there is 100 µL of a 1/400 dilution of conjugate in this row. Mix using the multichannel pipet (eight times up and down). Transfer 50 µL of the conjugate from row A to B (1¨C12), and mix in row B (eight times). Transfer 50 µL to row C (1¨C12) and mix. Repeat the transfer of dilutions to the end of the plate (row H). There should now be 50 µL of conjugate dilutions in all wells, at a dilution range from 1/400 in row A to 1/51,200 in row H. This is diagrammatically shown in Fig. 3. Thus, a CBT has been performed relating to how the antigen and antibody have been diluted. Put a lid on the plate and leave at room temperature for 1 h, or at 37¡ãC for 1 h.
10.Wash the plate and flick free from excess washing solution (see step 7).
11.To add substrate/chromophore for color development, thaw 10 mL of citrate buffer containing OPD in a water bath or at room temperature (slower), or make up OPD solution from tablets. Ensure that the solution reaches an acceptable temperature, i.e., room temperature if this is fairly constant in your laboratory. It is a good idea to have a water bath at a temperature of 20¡ãC and to use this to equilibrate the OPD solution to achieve a standardized temperature since this

Page 159
Fig. 3.
Dilution of antibody from row A to H.
affects the rate of color development of the ELISA. Add 5 µL of hydrogen peroxide (30%)/10 mL of OPD. (Immediately, put this back in the refrigerator with a top screwed on tightly.) Mix gently. Pour the solution into a trough (must be washed and free of any previous reagents). Use a multichannel pipet to add 50 µL of solution to each well (8 or 12 tips used).
12.Leave the plate on the bench and examine color changes at approx 1, 3, 5, 8, and 10 min after addition.
13.Add 50 µL of a 1 M solution of sulfuric acid in water (supplied) to each well after 10 min of color development (use a clean trough and multichannel pipets again) to stop color development.
14.Read the plate by eye and use a spectrophotometer.
1.1.6¡ª
Explanation of Data
Figure 4 is a diagrammatic representation of plates set up using the same reagents as described, at different times before color development has been stopped. Table 1 gives an assessment by eye of the development of color. Table 2 presents the OD results for the plate stopped at 10 min. These results are analyzed graphically in Fig. 5, which relates the color developing in the wells with different antigen-coating concentrations for different dilutions of antispecies conjugate.
From Fig. 5 and Table 2, the optimal dilution of conjugate that might be used in ELISA to detect guinea pig IgG can be determined. Also, the respective antigen concentration that might be used to detect antibodies (highly relevant in the indirect ELISA and explained fully in Subheading 2.) can be

Page 160
Fig. 4. Representation of color development
at 1, 3, 6, and 10 min.
observed. These figures provide individuals who have never seen an ELISA, an idea what to expect, and can be used as a comparison with their test results. They are also useful to those who obtain the text without access to reagents, in that it allows them to work through the examples without the need for setting-up an actual assay. Individuals who have performed an assay following the
Page 161
Table 1
Assessment of Plates by Eyea
|
1 |
2 |
3 |
4 |
5 |
6 |
7 |
8 |
9 |
10 |
11 |
12 |
Observed at 1 min |
|
|
|
|
|
|
|
|
|
|
|
|
A |
+ |
+ |
¨C |
¨C |
¨C |
¨C |
¨C |
¨C |
¨C |
¨C |
¨C |
¨C |
B |
+ |
+¨C |
¨C |
¨C |
¨C |
¨C |
¨C |
¨C |
¨C |
¨C |
¨C |
¨C |
C |
+ |
¨C |
¨C |
¨C |
¨C |
¨C |
¨C |
¨C |
¨C |
¨C |
¨C |
¨C |
D |
¨C |
¨C |
¨C |
¨C |
¨C |
¨C |
¨C |
¨C |
¨C |
¨C |
¨C |
¨C |
E |
¨C |
¨C |
¨C |
¨C |
¨C |
¨C |
¨C |
¨C |
¨C |
¨C |
¨C |
¨C |
F |
¨C |
¨C |
¨C |
¨C |
¨C |
¨C |
¨C |
¨C |
¨C |
¨C |
¨C |
¨C |
G |
¨C |
¨C |
¨C |
¨C |
¨C |
¨C |
¨C |
¨C |
¨C |
¨C |
¨C |
¨C |
H |
¨C |
¨C |
¨C |
¨C |
¨C |
¨C |
¨C |
¨C |
¨C |
¨C |
¨C |
¨C |
Observed at 3 min |
|
|
|
|
|
|
|
|
|
|
|
|
A |
++ |
++ |
++ |
+ |
+ |
¨C |
¨C |
¨C |
¨C |
¨C |
¨C |
¨C |
B |
++ |
+ |
+ |
+ |
¨C |
¨C |
¨C |
¨C |
¨C |
¨C |
¨C |
¨C |
C |
++ |
+ |
+ |
+¨C |
¨C |
¨C |
¨C |
¨C |
¨C |
¨C |
¨C |
¨C |
D |
+ |
+ |
+ |
+ |
¨C |
¨C |
¨C |
¨C |
¨C |
¨C |
¨C |
¨C |
E |
+ |
+ |
+ |
¨C |
¨C |
¨C |
¨C |
¨C |
¨C |
¨C |
¨C |
¨C |
F |
+ |
¨C |
¨C |
¨C |
¨C |
¨C |
¨C |
¨C |
¨C |
¨C |
¨C |
¨C |
G |
¨C |
¨C |
¨C |
¨C |
¨C |
¨C |
¨C |
¨C |
¨C |
¨C |
¨C |
¨C |
H |
¨C |
¨C |
¨C |
¨C |
¨C |
¨C |
¨C |
¨C |
¨C |
¨C |
¨C |
¨C |
Observed at 6 min |
|
|
|
|
|
|
|
|
|
|
|
|
A |
++ |
++ |
++ |
++ |
++ |
++ |
+ |
+ |
+¨C |
¨C |
¨C |
¨C |
B |
++ |
++ |
++ |
++ |
++ |
+ |
+¨C |
¨C |
¨C |
¨C |
¨C |
¨C |
C |
++ |
++ |
++ |
++ |
++¨C |
¨C |
¨C |
¨C |
¨C |
¨C |
¨C |
|
D |
++ |
++ |
+¨C |
¨C |
¨C |
¨C |
¨C |
¨C |
¨C |
¨C |
¨C |
¨C |
E |
+ |
+ |
¨C |
¨C |
¨C |
¨C |
¨C |
¨C |
¨C |
¨C |
¨C |
¨C |
F |
+ |
+ |
¨C |
¨C |
¨C |
¨C |
¨C |
¨C |
¨C |
¨C |
¨C |
¨C |
G |
¨C |
¨C |
¨C |
¨C |
¨C |
¨C |
¨C |
¨C |
¨C |
¨C |
¨C |
¨C |
H |
¨C |
¨C |
¨C |
¨C |
¨C |
¨C |
¨C |
¨C |
¨C |
¨C |
¨C |
¨C |
Observed at 10 min
A |
++ |
++ |
++ |
++ |
++ |
++ |
++ |
++ |
+ |
+¨C |
+¨C |
¨C |
B |
++ |
++ |
++ |
++ |
++ |
++ |
+ |
+ |
¨C |
¨C |
¨C |
¨C |
C |
++ |
++ |
++ |
++ |
++ |
+ |
+ |
¨C |
¨C |
¨C |
¨C |
¨C |
D |
++ |
++ |
++ |
++ |
+¨C |
¨C |
¨C |
¨C |
¨C |
¨C |
¨C ¨C |
|
E |
++ |
++ |
+ |
+ |
+¨C |
¨C |
¨C |
¨C |
¨C |
¨C |
¨C |
¨C |
F |
+ |
+ |
+ |
¨C |
¨C |
¨C |
¨C |
¨C |
¨C |
¨C |
¨C |
¨C |
G |
+ |
+¨C |
¨C |
¨C |
¨C |
¨C |
¨C |
¨C |
¨C |
¨C |
¨C |
¨C |
H |
+ |
¨C |
¨C |
¨C |
¨C |
¨C |
¨C |
¨C |
¨C |
¨C |
¨C |
¨C |
¨C, No detectable color; +¨C, weak color; +, definite color; ++, strong color.
Page 162
Table 2
OD Results for Plate Stopped at 10 Min
|
1 |
2 |
3 |
4 |
5 |
6 |
7 |
8 |
9 |
10 |
11 |
12 |
A |
1.89 |
1.88 |
1.67 |
1.34 |
1.10 |
0.97 |
0.86 |
0.57 |
0.44 |
0.32 |
0.31 |
0.31 |
B |
1.87 |
1.86 |
1.63 |
1.29 |
1.04 |
0.93 |
0.84 |
0.53 |
0.35 |
0.24 |
0.23 |
0.21 |
C |
1.68 |
1.45 |
1.32 |
1.14 |
0.96 |
0.86 |
0.64 |
0.45 |
0.29 |
0.19 |
0.17 |
0.16 |
D |
1.14 |
1.03 |
0.94 |
0.83 |
0.57 |
0.45 |
0.38 |
0.29 |
0.19 |
0.18 |
0.15 |
0.16 |
E |
0.99 |
0.91 |
0.74 |
0.54 |
0.46 |
0.36 |
0.29 |
0.19 |
0.18 |
0.15 |
0.13 |
0.14 |
F |
0.66 |
0.44 |
0.39 |
0.33 |
0.24 |
0.21 |
0.19 |
0.15 |
0.18 |
0.16 |
0.14 |
0.12 |
G |
0.34 |
0.20 |
0.16 |
0.18 |
0.16 |
0.18 |
0.15 |
0.16 |
0.14 |
0.12 |
0.14 |
0.13 |
H |
0.21 |
0.22 |
0.15 |
0.18 |
0.17 |
0.15 |
0.13 |
0.14 |
0.15 |
0.13 |
0.12 |
0.12 |
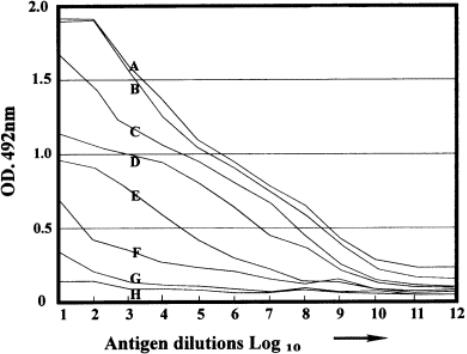
Fig. 5.
Titration curves for conjugates against different dilutions of antigen (IgG) on columns 1¨C11 of plate.
protocols in Subheading 1.1., might apply the observations on their plate to those demonstrated, and compare them critically.
1.1.7¡ª
Aspects of the Described Assay
Little happens during the first 30 s to 1 min after the addition of substrate. Color then is detected in wells 1¨C3 of rows A and B and possibly C. The strongest color is detected in the wells containing the highest concentrations of
Page 163
antigen. By 3 min, the pattern should be confirmed, with detectable color in rows C¨CE. After 6 min, there is stronger color in rows A¨CD, all showing a gradual reduction in color as the antigen is diluted across the plate. The wells showing no color (no detectable antibody) for rows A, B, C, D, E, F, and G are 10, 9, 8, 6, 4, 3, and all rows, respectively.
At 10 min (the time for stopping color development), there is little change in the pattern, although the intensity of the color may have increased. Note that at the strongest concentration of the conjugate, there may be some color in the negative control well (12). Also note the color change on addition of sulfuric acid (stopping).
1.1.8¡ª
Plate Reader Data
Now let us discuss the following factors:
1.Plateau height.
2.Background, nonspecific adsorption of conjugate.

3. Plate background.
The color changes associated with each well have now been quantified, so that the exact situation can be assessed as shown in Fig. 6. Each line represents the titration of a different dilution of conjugate against the same dilution range of antigen. Note that rows A and B are quite similar. For wells 1 and 2, there is similar color, with no decrease in color when the antigen concentration is supposedly being decreased on the plate. This represents a plateau region (constant high color). Thus, the plate wells have a similar amount of antigen as judged by the developing color which means that at antigen levels higher than those of well 2, no more antigen can attach to the plastic of the wells. This is a factor of the binding capacity of the plastic and may vary from protein to protein.
From well 3 in rows A and B, the color decreases, corresponding to the dilution of antigen on the wells. Note that A10¨CA12 show a similar color (around 0.31). This represents the end point of the titration at the respective conjugate dilutions of 1/400.
Although row B shows a similar titration range, note that the color in rows 10¨C12 are similar to each other but lower than for row A. In particular, note well 12 for row B. This is the well that had no antigen, so the color developing in this row represents the nonspecific adsorption of conjugate.
The color diminishes in column 12 as the conjugate is diluted (e.g., C12 = 0.16), and then stays at a similar level. The conclusion here is that the 1/400 and 1/800 dilutions of conjugate cause some problems of nonspecific adsorption. Below these dilutions, there is no further problem. The residual level of color, independent of the dilution of conjugate, is the plate background and is
Page 164
Fig. 6.
Indirect ELISA: titration curves for anti-guinea pig serum dilutions (A¨CH) against different dilutions of antigen (IgG) on columns 1¨C11 of plate.