

The Elisa guidebook
.pdf1. Serum 1: The values of the duplicate samples are quite similar. The titration shows a plateau region where the values are the same (wells H1 and H2, and
Page 174
Fig. 9.
Addition and dilution steps of sera to wells.
wells G1 and G2). Thus, there is a maximum color obtained up to 1/80; increasing the concentration of antibodies has no effect on the readings. This represents the region where all the antigen is saturated with antibody. The value of the OD is dependent on the amount of antigen that has attached to the wells, which, in turn, is dependent on the adsorption characteristics of the plastic and the concentration of antigen. On further dilution, the antibodies are no longer in excess, so they are titrated, as seen by a gradual decrease in the OD.
2.Serum 2: The OD levels even at 1/40 are not equal to those where antibody was in excess in serum 1. Thus, the antibodies are not saturating the antigen on the wells, and are therefore not present in excess. The titration of the serum begins immediately on dilution. Note that the last dilutions give low OD values equivalent to the plate background, unlike serum 1.
3.Serum 3: Even at 1/40 there are low OD values as compared to the serum samples 1 and 2. There are fewer antibodies in this serum than the other two! Again, the titration begins immediately on dilution and the low OD(around 0.19) is attained
Page 175
Fig. 10.
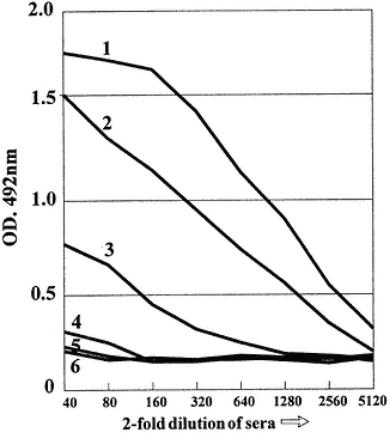
Plots of data in Table 4 showing titrations of six different serum samples diluted from 1/40 in a twofold series against constant antigen concentrations. Mean values for OD are used.
Table 4
Plate data
|
Serum 1 |
Serum 2 |
Serum 3 |
Serum 4 |
Serum 5 |
Serum 6 |
|
||||||
|
1 |
2 |
3 |
4 |
5 |
6 |
7 |
8 |
9 |
10 |
11 |
12 |
Dilution |
A |
0.34 |
0.32 |
0.19 |
0.23 |
0.14 |
0.15 |
0.17 |
0.16 |
0.15 |
0.16 |
0.19 |
0.15 |
5120 |
B |
0.54 |
0.56 |
0.34 |
0.36 |
0.17 |
0.19 |
0.14 |
0.14 |
0.16 |
0.18 |
0.16 |
0.14 |
2560 |
C |
0.87 |
0.91 |
0.54 |
0.57 |
0.18 |
0.19 |
0.14 |
0.17 |
0.17 |
0.16 |
0.17 |
0.14 |
1280 |
D |
1.16 |
1.14 |
0.76 |
0.72 |
0.28 |
0.25 |
0.17 |
0.16 |
0.18 |
0.16 |
0.17 |
0.19 |
640 |
E |
1.45 |
1.49 |
0.95 |
0.91 |
0.31 |
0.32 |
0.15 |
0.14 |
0.17 |
0.15 |
0.14 |
0.17 |
320 |
F |
1.68 |
1.70 |
1.15 |
1.17 |
0.43 |
0.46 |
0.13 |
0.15 |
0.14 |
0.15 |
0.16 |
0.18 |
160 |
G |
1.76 |
1.73 |
1.34 |
1.32 |
0.65 |
0.66 |
0.23 |
0.24 |
0.18 |
0.17 |
0.15 |
0.17 |
80 |
H |
1.79 |
1.76 |
1.56 |
1.54 |
0.78 |
0.76 |
0.31 |
0.32 |
0.28 |
0.24 |
0.21 |
0.23 |
40 |
Page 176
at 1/1280. Overall, these three positive sera have different reactivities in terms of the quantity of antibody titrated. Thus, serum 1 has the highest titer, showing a plateau (is able to saturate the antigen). Serum 2 has the next highest amount of antibodies since it has an end point around 1/5120 (point where OD equals the plate background). Serum 3 has the lowest amount of antibody, with an end point of around 1/1280.
4.Serum 4: This is a negative serum (clinically). Therefore, by definition it should contain no antibodies. The color obtained reflects the nonspecific attachment of the serum to the antigen. Most nonspecific "sticking" might be expected in the least dilute sample. This is the case here, with background levels at 1/40 and 1/80 serum dilutions. Note that the levels of nonspecific color are much lower than in the positive sera, but are distinct from the assumed plate background, which can be taken as the backgrounds observed for the negative sera at their highest dilution. Note that in such wells as (E, D, C, B, A) give similar results and no titration is observed on dilution.
5.Sera 5 and 6: These give results similar to serum 4, although there is a lower amount of color in the 1/80 wells, reflecting different amounts of nonspecific adsorption of serum proteins.
3.7.1¡ª
Curve Shapes
The plotted data, particularly for the positive sera, produce curves rather than straight lines. Generally, there is a region on the curve that contains three to five points that are more linear than the rest. The nonlinear regions occur at the top and bottom of a graph, and such sigmoidal curves are typical of serum titrations as shown in Fig. 11. End point determinations are difficult to assess exactly, because there is a pronounced "tail" at the low OD end of the results.
3.7.2¡ª
Comparison of Serum Titration Curves
The amount of specific antibody in each serum has been titrated over a dilution range. The serum containing the most antibodies will have a higher dilution end point (dilution where the OD is the same as the background OD). Thus, as already indicated, the end points may be compared as representing the titer of the sera. This can be assessed by eye as well as by machine reading.
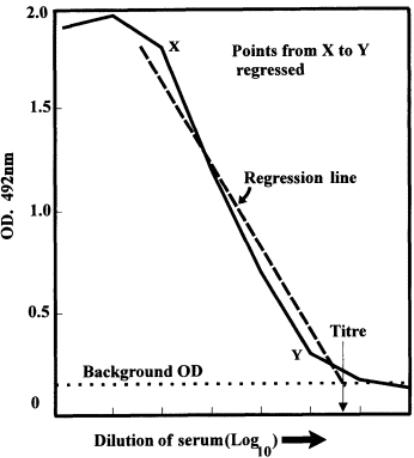
A better estimate of the end point is made by drawing a straight line through the points on the curves that are nearly in a straight line. If this was done statistically, a regression analysis of the points would be made and the best line of fit would be given mathematically (see Fig. 12). Graphically, this may be approximated to sufficient accuracy. Thus, the end points are assessed when the regression lines (or graphically produced lines) cut the measured background OD line, assuming that the curves are of similar shape (the lines are then parallel). However, this may not always be the case, since different antibody populations may be responsible for the color of the ELISA. In this case,

Page 177
Fig. 11.
Serum titration curves showing sigmoidal nature.
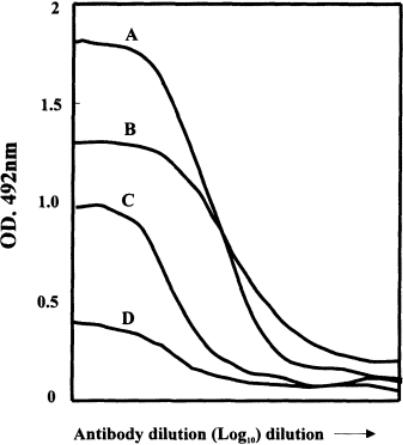
differences must be noted and taken into account when the implications of the titers found are considered. Note that the curves obtained for negative sera are very flat; even so, they have an end point. Sera may also show differences in maximum plateau heights and shape (Fig. 13).
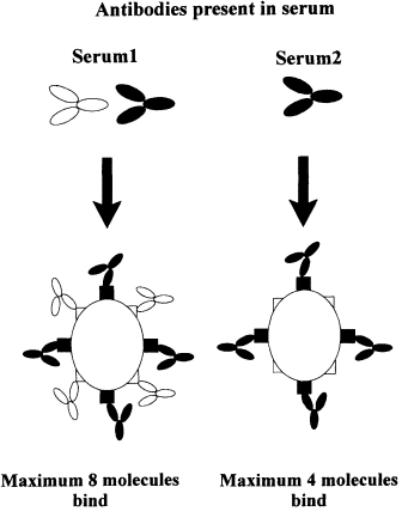
Figure 14 attempts to explain why there are differences in plateau heights for different sera. Here, several sera are reacting maximally with the antigen since on increasing their concentration, there is no increase in color. The plateau heights are different, however, showing that different weights of antibody have reacted with the same antigen for particular sera. This is a function of the number of reactive antigenic sites on the antigen and the quantities and specificities of the antibody populations in the sera. Although this is uncommon when using polyclonal antibodies, it is common when using monoclonal antibodies (mAbs).
Where the curves are parallel, any point can be taken on them for comparison of samples. This is illustrated in Fig. 15. Analysis of as many sera as possible over full-dilution series and examination of the curves should be made to establish whether there is parallelism. This is important when spot tests are
Page 178
Fig. 12.
Regression of points in serum titration curve to obtain a titer at the intersection of the background OD.
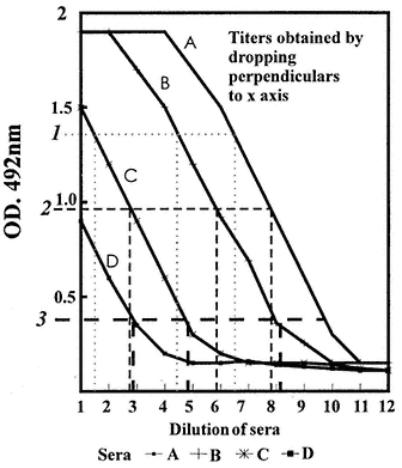
required so that a single dilution of test sample can be established. The dilution can be taken where samples give results in the parallel regions of curves.
A line is drawn at a particular OD, and the dilution of serum giving this OD for all the sera is determined, thus giving relative titers. Such relative titers may be expressed compared to an accepted standard serum, which, in turn, can be given in any units. The actual activity of the standard serum may be known (e.g., number of micrograms/milliliter of specific antibody), so that all the sera compared to this can be expressed in the same units.
3.7.3¡ª
Negative Sera and Control Sera
The test made involved only one control, that of negative sera. Ideally, a plate background should be included to measure the color in the wells with only the antigen and conjugate. This should correspond to the readings beyond the titration of the antibodies, observed when a low plateau is obtained even on dilution of the samples. Such backgrounds can be subtracted from the whole
Page 179
Fig. 13.
Variation in sigmoid curves for serum titrations.
plate results before any processing of the data, or used to blank the spectrophotometer before reading. The treatment of the results of the negative serum depends on what is known about the negativity in terms of other tests and clinical findings. For example, British cattle are ideal as negative sera when studying anti-foot-and-mouth disease virus (FMDV) antisera, because Britain is disease-free. This may not always be possible in countries where disease is endemic. Note also that control negative sera obtained from other countries may not reflect the same negative population of another country, since there are breed differences, complications owing to other infections, and so forth. This could affect the performance of kits in which standard negative sera are supplied to act as controls in the ELISA. Kits must be evaluated, wherever possible, in the country where they are to be used. The control value for the negative serum supplied may not reflect the mean value for negative sera.
3.7.4¡ª
Selection of a Single Serum Dilution to Perform a "Spot Test"
Examination of the serum titration curves for positive and negative sera can tell us which dilution might be suitable to use in the indirect ELISA so
Page 180
Fig. 14.
Diagram representing the maximum number of molecules of antibody that can bind to antigens. Differences in plateau height (maximum OD) can be attributed to different populations of antibodies in sera.
that antibodies may be assayed on single wells (or multiple wells using the same dilution). Thus, in Fig. 10, we observe that there is low nonspecific activity seen in the negative sera at 1/40 and 1/80. The positive sera still show high OD values at these dilutions so that the relative sensitivity of the assay (detection of specific antibodies) can be made at such dilutions. However, if dilutions greater than 1/80 are used, we can still measure antibody in the absence of nonspecific reactions. The sensitivity does drop, however. Remember that we are trying to balance sensitivity with low background in the presence of other serum proteins in the sample. If we had used the sera at 1/160, then we would have had values for the ELISA as shown in
Page 181
Fig. 15.
Comparison of serum titration curves to standard serum titration at three points (OD values 1, 1, and 3) in parallel regions of curves. Titers can be read from the x-axis and related.
Table 5
Mean OD492
of Anti-Guinea Pig Sera
at 1/60 Dilution
Serum |
OK |
1 |
1.69 |
2 |
1.16 |
3 |
0.45 |
4 |
0.14 |
5 |
0.15 |
6 |
0.17 |
Table 5. The negative sera levels are therefore around 0.15, whereas all the positive sera are above this value. The next exercise expands on this approach.
Page 182
4¡ª
Use of Indirect ELISA to Determine the Positivity of Sera at Single Dilution
4.1¡ª
Learning Principles
1.Examining negative serum populations for establishing OD limits of negativity.
2.Examining antibody-positive serum populations.
3.Examining frequency of results in a population.
4.1¡ª
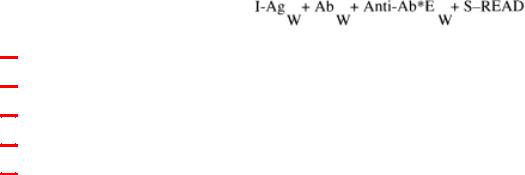
Reaction Scheme
I |
= microplate |
Ag |
= optimum concentration of antigen |
Ab |
= test sera at single dilution |
AntiAb*E |
= anti-species antibody linked to enzyme |
S |
= Substrate/color detection system |
In this exercise, we use Ag and Anti-Ab*E at optimal dilutions. The test sera are added at a constant dilution. Control positive antisera can be added at a constant dilution or as a dilution range to produce a standard curve relating color to dilution or concentration of antibodies added. Thus, the test sera can be related to the positive serum titration curve. The same can be done by including accepted negative control sera standards.
4.2¡ª
Materials and Reagents
1.Ag: guinea pig IgG (1 mg/mL) (or previously titrated).
2.Ab: 48 rabbit sera including high, moderate and low titer against guinea pig IgG (24) and negative sera (24).
3.AntiAb*E: sheep anti-rabbit serum linked to HRP.
4.Microplates.
5.Multichannel and single-channel pipets.
6.10and 1-mL pipets.
7.Carbonate/bicarbonate buffer.
8.PBS containing 1% BSA and 0.05% Tween-20.
9.OPD solution.
10.Hydrogen peroxide.
11.Washing solution.
12.Paper towels.
13.1 M sulfuric acid in water.
14.Small-volume bottles/microdilution equipment.
15.Multichannel spectrophotometer.
16.Clock.
Page 183
17.Graph paper.
18.Calculator.
4.3¡ª
Protocol for Spot Test
From the previous exercises, you should have assessed the dilution of test serum that can be used to discriminate between positive and negative nonspecific results, based on the difference noted between the selected positive and negative sera titrated over full-dilution ranges. We are now going to titrate all the sera at the dilution found as duplicates (two wells per serum dilution in the indirect ELISA).
1.Add the guinea pig IgG to the wells of a microtiter plate at optimum dilution (as in earlier exercises). Incubate at 37¡ãC for 2 h (or under particular optimal conditions).
2.Wash and blot the plate.
3.Dilute the test serum samples appropriately, in blocking buffer. Sera may be diluted into small-volume bottles. However, this causes two problems: manipulation (capping and so on) is laborious, and transfer of serum dilutions must be made with single channel pipet. The latter problem is important because it takes a long time to transfer all the sera to the different wells. The initially added samples will therefore receive a longer contact time with the antigen, which may well affect the results. This can be avoided if the samples are transferred to other plates before dilution (e.g., plastic non-ELISA microtiter plates in volumes that need not be accurate). The plate can then be sampled using a multichannel pipet if the dilution factor for the sera is not too high. The initial dilution can be made directly into, say, 100 µL of blocking buffer in the non-ELISA plates. The transfer of the required volume of the diluted test sample can then be effected using a multichannel pipet. Thus, the samples are transferred at approximately the same time. Special systems have been developed for use with multichannel pipets. These are ideal for the dilution and storage of test samples. Volumes of about 1 mL can be made up, making the accurate dilution of up to 1/200 (5 µL of sample/mL) easy. The microtiter dilution system should be available for this exercise.
4.Add a volume of blocking buffer to the plastic tubes held in the tube holder. For example, if a dilution of 1/100 is required, add 0.5 mL of blocking buffer per tube, and then add 5 µL of test sample. (See Fig. 16 for a pattern of samples on a plate.) Incubate for 1 h, as in the previous exercise, and follow the same steps for washing and addition of reagents to the stopping stage. Read the OD values.