

The Elisa guidebook
.pdfies from another species (the conjugate must not react with the competing antibodies). In this assay, the pretitration of the homologous serum is slightly different from the antigen competition indirect ELISA in that we need to add the amount of homologous antibodies that just saturate the antigen coated on the plate, since we do not wish to leave excess free antigenic sites that could react with the competing antibody and have little influence on the binding of the homologous antiserum. Note that this kind of assay can be made using the direct ELISA using a conjugated homologous serum, as for the direct antigen competition ELISA. Such assays are becoming more common with the advent of the use of mAb reagents.
7.7.2¡ª Data
Figure 38 is a graph relating the antibody titration curves to the IgG concentrations on the wells. From these data we can do the following:
1.Assess the best antigen concentration for use in the competition assay, and select the IgG concentration that gives a plateau maximum (in antibody excess) of around 1¨C1.5 OD. (curves 4 and 5).
2.Select the dilution of serum that just saturates this level of IgG (approx 1/100).
Page 223
Fig. 38.
Titration curves relating IgG dilutions on wells against different serum dilutions.
7.7.3¡ª
Increasing the Confidence of the Titration Curve Results
Since in the CBT we are using only a single-dilution range of antibody against the antigen, it is essential to titrate the antiserum in multiple rows against the antigen level found to be optimal. That is, we adsorb IgG at a level equivalent to the fourth or fifth dilution used in the preceding test, and then titrate in quadruplicate a dilution series of serum against it. In this way, we can observe the variation in results and assess the confidence in the titer of antibody that just saturates the antigen used in the competition assay proper. This may be necessary when, e.g., one obtains poor competition in the test proper with low sensitivity, indicating that too high or much too low a concentration of antiserum was used.
7.7.4¡ª
Competition Assay Proper
1. Add 50 µL of guinea pig IgG to plates at optimal concentration found in stage 1, incubate, and wash the plates.
Page 224
2.For the rabbit anti-guinea pig sera, label the standard antiserum 1, label the two unknown titer sera 2 and 3. Label the two sero-negative rabbit sera 4 and 5.
3.Dilute the rabbit sera to 1/50 in blocking buffer (make up 0.5 mL of each; i.e., add 10 µL of serum to 0.5 mL of buffer).
4.Add 50 µL of blocking buffer to all the antigen-coated plate wells.
5.Add 50 µL of rabbit serum I to wells HI and H2. Add duplicate rows of other sera in row H (serum 2 in H3 and 4; serum 3 in H5 and 6; serum 4 in H7 and 8; serum 5 H in 9 and 10). Dilute the sera using a multichannel pipet, transferring and mixing 50 µL for each step. We thus have a dilution range from 1/100 (row H) to 1/12,800 (row A) for each of the sera.
6.Incubate for 30 min at 37¡ãC. Do not wash the plate.
7.Add 50 µL of the swine anti-guinea pig serum at the optimal dilution, found in stage 1, to each well from columns
1to 11. Do not touch liqid in the wells when adding reagent. Add 50 µL of blocking buffer to column 12.
8.Incubate for 1 h at 37¡ãC.
9.Wash the wells.
10.Add 50 µL of antiswine conjugate to each well diluted in blocking buffer.
11.Incubate at 37¡ãC for 1 h.
12.Add 50 µL well of substrate and OPD per well, and incubate for 10 min.
13.Stop the reaction by addition of 50 µL of 1M H2SO4 to each well.
7.7.4.1¡ª Typical Data
Figure 39 is a representation of the ELISA plate after stopping. Table 17 presents the data.
7.7.5¡ª Processing Data

Processing of the data is similar to the other competition assays performed:
1.Column 12 = 100% competition value, take the mean OD = 0.08
2.Subtract this from OD values of all wells.
3.Take the mean OD of the duplicates for the competitors. This is shown in Table 18.
4.Plot the data, and relate the log10 dilution of each antiserum to the percentage of competition as illustrated in Fig.
7.7.6¡ª
Analysis of Data
1.Note that the curves for the rabbit antisera are similar. All the samples compete. Sample 3 is a strong competitor since it gives high competition at higher dilutions than the standard (1). Sample 2 is a weaker competitor than the standard.
2.The negative sera give little or no competition even at low dilutions.
3.The activity of each of the two test sera can be compared to the standard competing antiserum (1). Arbitary units can be ascribed to the standard serum so that serum titires could be expressed against this. As an example, let the titer of the standard serum at 50% competition be 1000. The relative titers of the other two
Page 225
Fig. 39.
Representation of plate showing competition assay. Data are given in Table 17.
test sera can then be related to this. Since the same dilution range was used for the samples we have at 50% competition for serum 2, it is two times stronger than the standard. Therefore, we need twice as much antiserum to compete to the same level as the standard, so the relative titer of the serum is 1/500. For serum 3 at 50%, we require five times less antiserum to give the same result as the standard so that the titer is 5000. The difference in the dilution factors necessary to give 50% competition is easily assessed from the graphs in Fig. 40.
4. Note that this processing holds true only if the competition curves show similar characteristics (shape). Considerable variation in slopes indicates that there is a different population of antibodies in the competing serum. As in all assays, the general picture of titration curves is best examined by the assay of as many sera as possible.
7.8¡ª
Indirect Assay Competition for Antibody Detection Using a Single Dilution of Test Serum
Here we use the standard competing rabbit serum as a full titration range in three rows of the plate. The rest of the plate contains a number of rabbit sera of high, medium and low titer against guinea pig IgG as used in Subheading 7.6. Not all the sera can be used in this exercise owing to the limited space on the plate. The assay is identical to that in Subheading 7.6. except that duplicate samples of sera are assessed at a single dilution for their competing ability. The titer of the serum is then read from the standard curve obtained on full dilution of the standard serum. The test therefore has two stages: (1) the titration of the homologous antiserum and solid-phase antigen in a CBT indirect ELISA, and (2) the competition proper.
Page 226
Table 17
Plate Data from Exercise 7.7. in Subheading 7.7.4.
Showing Competition of Indirect Assay by Antibodies
Standard |
|
|
1 |
|
2 |
|
3 |
4 |
|
100% |
0% |
|
serum |
|
|
|
|
|
|
|
|
|
|
|
|
|
1 |
2 |
3 |
4 |
5 |
6 |
7 |
8 |
9 |
10 |
11 |
12 |
A |
1.12 |
1.16 |
1.21 |
1.20 |
0.78 |
0.84 |
1.14 |
1.13 |
1.14 |
1.15 |
1.11 |
0.07 |
B |
1.07 |
1.09 |
1.21 |
1.19 |
0.56 |
0.58 |
1.15 |
1.12 |
1.16 |
1.14 |
1.15 |
0.09 |
C |
0.89 |
0.91 |
1.10 |
1.09 |
0.34 |
0.32 |
1.13 |
1.09 |
1.15 |
1.12 |
1.17 |
0.07 |
D |
0.63 |
0.61 |
0.87 |
0.89 |
0.21 |
0.19 |
1.10 |
1.09 |
1.13 |
1.15 |
1.16 |
0.06 |
E |
0.42 |
0.41 |
0.63 |
0.65 |
0.09 |
0.08 |
1.16 |
1.09 |
1.14 |
1.13 |
1.15 |
0.08 |
F |
0.23 |
0.26 |
0.43 |
0.45 |
0.08 |
0.07 |
1.13 |
1.14 |
1.14 |
1.16 |
1.15 |
0.07 |
G |
0.13 |
0.12 |
0.23 |
0.25 |
0.07 |
0.08 |
1.15 |
1.12 |
1.16 |
1.15 |
1.17 |
0.06 |
H |
0.08 |
0.09 |
0.12 |
0.10 |
0.08 |
0.07 |
1.14 |
1.16 |
1.14 |
1.15 |
1.15 |
0.07 |
Table 18
Mean Values of Data in Table 17
|
1¨C2 |
3¨C4 |
5¨C6 |
7¨C8 |
9¨C10 |
11 |
A |
1.05 |
1.12 |
0.71 |
1.06 |
1.07 |
1.08 |
B |
1.00 |
1.12 |
0.49 |
1.06 |
1.07 |
1.07 |
C |
0.90 |
1.01 |
0.25 |
1.03 |
1.06 |
1.09 |
D |
0.52 |
0.80 |
0.12 |
1.01 |
1.06 |
1.08 |
E |
0.34 |
0.56 |
0.00 |
1.04 |
1.06 |
1.07 |
F |
0.16 |
0.36 |
0.00 |
1.06 |
1.07 |
1.07 |
G |
0.05 |
0.16 |
0.00 |
1.06 |
1.07 |
1.09 |

H |
0.00 |
0.03 |
0.00 |
1.07 |
1.06 |
1.07 |
7.8.1¡ª
Materials and Reagents
As for Subheading 7.7. except that the rabbit sera are replaced by 32 rabbit sera including seronegative, low, medium, and high titers against guinea pig IgG.
7.8.2¡ª Pretitration Stage
Repeat the first stage as in Subheading 7.7., or use these data to establish conditions. From the data the best antigen concentration, and the dilution of swine antibody that just saturates the IgG, is determined.
7.8.3¡ª
Competition Assay Proper
1. Add 50 µL of guinea pig IgG to plates at optimal dilution Incubate and wash the plates.
Page 227
Fig. 40.
Competition curves for various competing sera.
Data are from Table 18.
2.Dilute the rabbit test sera to 1/50 in blocking buffer. Use the micronics racks for dilutions so that the samples can be added using a multichannel pipet. Dilute the standard rabbit antiserum to 1/50.
3.Add 50 µL of blocking buffer to columns 1, 2, 11, and 12.
4.Add 50 µL of the diluted standard rabbit serum to H1 and H2. Make a twofold dilution range of the serum to A1 and A2.
5.Add the test samples to the wells as duplicates, as indicated in Fig. 41.
6.Incubate the plates for 30 min at 37¡ãC.
7.Add 50 µL of the optimum dilution of swine anti-guinea pig serum in blocking buffer, incubate for 1 h at 37¡ãC, and mix the contents of the plates every 10 min. Do not add this serum to column 12. Instead, add 50 L of blocking buffer.
8.Wash the plates.
9.Add the anti-swine conjugate diluted in blocking buffer (optimum dilution). Incubate for 1 h at 37¡ãC.
10.Wash the plate.
11.Add substrate/OPD, and incubate for 10 min.
12.Stop the reaction by addition of 50µL of 1 M H2SO4 per well.
13.Read plate using spectrophotometer. (See Fig. 42 for a representation of a stopped plate.)
7.8.4¡ª Typical Data
Table 19 presents typical data for a spot test.
Page 228
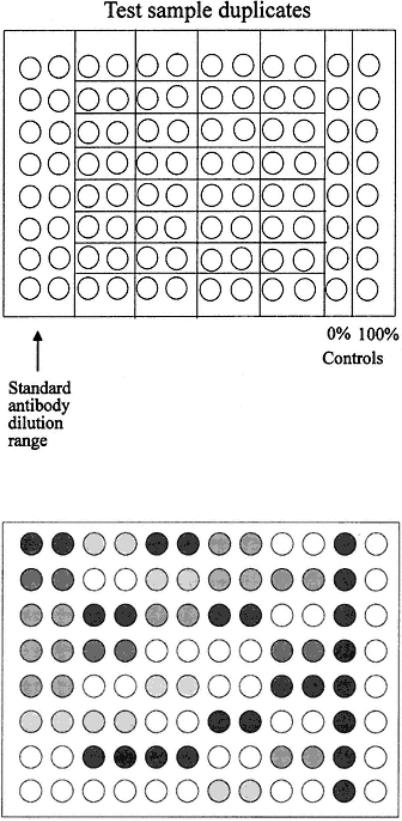
Fig. 41.
Plate layout for spot testing in competition assay.
Fig. 42.
Representation of a spot test competition assay. Data are given in Table 19.

Page 229
Table 19
Plate Data from Spot Test
|
1 |
2 |
3 |
4 |
5 |
6 |
7 |
8 |
9 |
10 |
11 |
12 |
A |
1.31 |
1.30 |
1.31 |
1.33 |
1.32 |
1.32 |
1.26 |
1.34 |
1.12 |
1.10 |
1.34 |
0.06 |
A |
1.21 |
1.24 |
0.34 |
0.32 |
1.23 |
1.21 |
1.12 |
1.12 |
0.09 |
0.09 |
1.23 |
0.07 |
B |
1.03 |
1.05 |
0.19 |
0.18 |
0.43 |
0.45 |
0.56 |
0.58 |
0.78 |
0.78 |
1.21 |
0.09 |
C |
0.91 |
0.90 |
1.13 |
1.15 |
0.67 |
0.69 |
1.11 |
1.13 |
0.12 |
0.14 |
1.24 |
0.08 |
D |
0.76 |
0.73 |
0.98 |
0.96 |
0.13 |
0.12 |
0.16 |
0.13 |
0.78 |
0.80 |
1.24 |
0.09 |
E |
0.53 |
0.54 |
0.06 |
0.04 |
0.34 |
0.36 |
0.16 |
0.18 |
1.23 |
1.21 |
1.23 |
0.08 |
F |
0.31 |
0.34 |
0.34 |
0.36 |
0.14 |
0.16 |
1.17 |
1.19 |
0.08 |
0.10 |
1.21 |
0.07 |
G |
0.12 |
0.13 |
1.21 |
1.23 |
1.14 |
1.11 |
0.09 |
0.07 |
0.67 |
0.69 |
1.26 |
0.05 |
H |
0.06 |
0.08 |
0.06 |
0.09 |
0.15 |
0.12 |
0.23 |
0.27 |
0.10 |
0.12 |
1.23 |
0.06 |
7.8.5¡ª
Treatment of Data
For the other competition results, make the following calculations:
1.Calculate the mean of column 12, and subtract this from all results from the other wells.
2.Calculate the mean from column 11 (after subtraction in step 1).
3.Express the other ODs as a percentage of the range 0 to the mean column 11, i.e., from 0 to 1.16 in the example above.
4.Take the mean OD of the duplicate wells.
5.Use the following formula to calculate the percentage of competition in each well:
Plot the standard serum competition activity relating competition to log10 of the dilution.
6.Read the relative titers of the other competition results from the curve.
7.Another approach to evaluation of spot testing is that in which accepted negative sera are assessed as controls. Several sera can be included in a test so that their mean competition value and its variation can be assessed. Thus, sera giving higher values of competition under the same conditions (with prescribed confidence limits) can be assessed for positivity. Studies on a large number of negative sera give better population data as described for the other assays, so that chosen negative controls may be added from the defined population (see Table 20). In Table
20, the sera with asterisks could be the negative controls in order to test whether the system was ideal. The percentage value of their mean plus a defined interval as a percentage of this mean (as directed from large population studies) could be given. Here, we have mean = 3%. Assume that two times this mean is an acceptable upper limit for negative competition values. Therefore, sera could be ascribed as positive with competition values ³6%.

Page 230
Table 20
Mean Values of Test Sera from Table 19
Processed as Competition Values
|
|
Competition results (%) |
|
||
|
1 2 |
3 4 |
5 6 |
7 8 |
9 10 |
A |
0 |
73 |
2a |
16 |
99 |
B |
16 |
90 |
68 |
57 |
39 |
C |
28 |
7a |
48 |
9 |
95 |
D |
41 |
23 |
96 |
93 |
38 |
E |
59 |
100 |
76 |
91 |
0 |
F |
78 |
76 |
93 |
4a |
98 |
G |
100 |
100 |
95 |
84 |
97 |
aSera could be used as negative controls.
7.8.6¡ª Notes
We have used a dilution of 1/100 for the test sera in the example. This is based on preliminary studies establishing the dilution as being optimal for distinguishing positive and negative values. This must be attempted in your laboratories for specific disease studies. The approach to examination of negative populations has already been discussed. In the case of competition assays, a lower dilution of test serum might be used (effectively increasing the sensitivity of the assay) since nonspecific factors detected in the indirect assay do not seem to affect competition assay results. Construction of full-scale serum titration competition curves of many negative and positive sera will nominate the best dilution (with definable confidence limits) of serum to be used. The sources of such sera have already been discussed.
Thus, for any particular dilution used in the competition assay, an upper limit of negativity should be definable (as a competition value) above which positivity of antibody will be detected. Once competition assays have been characterized in central laboratories, it is usually simple to read the assays by eye, with good levels of precision and sensitivity. In these cases, the selection of appropriate negative controls that define upper limits of negativity as determined by eye is important.
7.8.7¡ª
Conclusions about Competition Assays
1.Competition assays provide a relatively simple method once the homologous systems have been titrated.
2.These assays can be read by eye, with some loss of sensitivity and reduction in confidence limits.

Page 231
3.In all the examples given, we have used 50 µL of competitor and 50 µL of homologous serum as a mixture to compete for only 50 µL of antigen on the solid phase. You can alter the volumes to suit. For example:
a.100 µL of antigen solid phase vs 50 µL of homologous serum and 50 µL of competing antigen (or antibody). In this case, the pretitration would be with 100 µL of solid-phase antigen vs 50 µL of serum dilutions + of 50 µL blocking buffer.
b.50 µL of solid-phase antigen vs 25 µL of homologous serum + 25 µL competing antigen (or antibody). In this case the pretitration would be between 50 µL of solid-phase antigen and 25 µL of antibody dilutions + 25 µL of buffer.
c.The competitor and homologous serum can be mixed together in another plate before addition to the solidphase antigen plate. These types of assay can be termed inhibition assays since the reagents are not directly competing in the same system.
4.Differences in results can be observed by alteration of the sequence of reagents, i.e., when true competition and inhibition methods are used. In practice, the mixing of reagents in a true competition assay gives the most sensitive assays and best reflects avidity differences among reagents.