

Cleaver Economics The Basics (Routledge, 2004)
.pdfAs a firm grows in size it benefits from certain cost advantages or ECONOMIES OF SCALE. For example, storing or processing goods in a large container is cheaper per unit volume than producing them in small packages. This is relevant to processes that involve constructing buildings, transporting oil, selling boxes of soap powder and indeed in making almost anything. Second, a large firm buying inputs in bulk can negotiate better discounts than those gained by small firms. Last, the capital threshold for technologically sophisticated products may be very high such that large sums have to be invested even before production can begin. Thus the research costs and startup costs of implementing new ideas may well be prohibitively costly for small enterprises.
Over certain production ranges, depending on the nature of business in question, size may not confer significant benefits such that TCs rise almost exactly in proportion to output and there are thus constant returns to scale. There may nonetheless come a point where the complications involved in producing more and more leads to greater inefficiency and rising average costs. These DISECONOMIES OF SCALE are most often related to the difficulties of management in complex organisations. Any bureaucracy where decisions are made at some distance from the scene of operations is likely to make mistakes but delegating management to the lowest effective level becomes more difficult the larger the firm. Discriminating between which issues should be centralised and which delegated to where cannot be practically determined for every single business decision.
A S h i f t i n Av e r a g e Co s t s
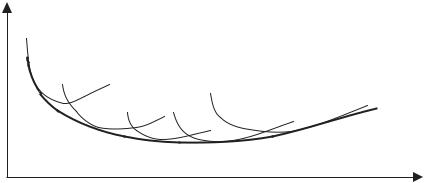
Derivation of the standard, U-shaped, AC curve is explained in the previous section but this does not allow for the impact of sudden changes in production circumstances. Growth of the firm so far analysed has considered steady increases in the employment of all factors of production (internal growth) but we can hypothesise two causes of sudden exogenous transformation. The firm in question may take over or merge with another enterprise (external growth) or it may experience a technological revolution that transforms its business practice.
Whatever the cause, such indivisibilities in the growth process are illustrated by a shift in the AC function. The AC curve may
© 2004 Tony Cleaver
Average costs
Shifts in short-run AC
Long-run AC
0
Q1 |
Q2 |
Output
Figure 3.2 Long-run AC with exogenous shocks.
shift a number of times, trending upwards or downwards, according to the number of exogenous shocks experienced and their overall impact on long-run costs:
The long-run AC curve is illustrated by the darker ‘envelope’ curve in Figure 3.2. (Note this example shows almost constant long-run returns to scale over the middle range of outputs between Q1 and Q2 where there is no unique optimum size of firm which enjoys a distinct cost advantage.)
C O M P E T I T I O N , P R I C E S A N D P R O F I T S
Costs of production are one element in the analysis of supply but we now need to contrast this with an understanding of prices and profits. However cost-efficient an enterprise may or may not be, whether it can stay in business, or fail, depends on its ability to make long-term profits.
A company can weather a short-lived downturn in trade only so long as it can cover all its costs and return a reasonable profit over the longer run. This depends on the success of each individual firm in the market place: can it deliver what consumers want to buy at the right price? If not, if the price at which a firm sells its goods cannot be maintained above its average production costs, then losses will be made. If these continue, the firm will close down.
This raises the interesting notion of how market prices are influenced by the setting up or closing down of firms. Assume for the
© 2004 Tony Cleaver
time being there is a stable, unchanging industry demand for a given good – if the number of firms producing this good decreases, and industry supply therefore decreases, a shortfall in market supply will push up prices (see Chapter 2). Conversely, an increase in the number of producers may lead to falling prices over time. The state of competition in industry, therefore, affects prices and thereby profits of all involved.
In some industries there may be thousands, if not millions of suppliers. In the market for coffee or tea, for example, if one more producer enters or exits the industry it will have a negligible affect on overall supply and therefore price of the product. The entry of a new airline company in long haul, transatlantic flights, however, may well have a significant impact on ticket prices.
P r o f i t M a x i m i s a t i o n u n d e r P e r f e c t Co m p e t i t i o n
Consider, first, the market structure where there are many competing suppliers but no one in particular is big enough to exercise a commanding lead. In such a scenario, typical of agricultural commodity markets such as coffee, tea or wheat, the product of one supplier is a close if not identical substitute to that of another and the price of this product is set in the market place by the competing forces of demand and supply. An individual producer, therefore, has no effective power over the important decision as to what price to charge for his/her product (the enterprise is a price taker, not a price maker) and can only decide how much to produce, given that price.
If we assume that the supplier aims to maximise profits in this competitive situation, we can deduce that output will expand so long as each additional unit produced adds more to revenue earned than it does to costs. That is, production can continue so long as selling prices are maintained above costs – but, as we have seen, costs eventually begin to rise. Profits will thus be maximised where the cost of the very next bag of coffee/tea rises to just equal its price. To produce beyond this point incurs a loss on each additional unit sold.
Economists define this point of profit maximisation in terms of marginal revenue (MR) being equal to marginal costs (MCs). That is, the point where the revenue earned from the sale of one extra unit equals the costs incurred in the production of that unit (Box 3.1).
© 2004 Tony Cleaver

Box 3.1 Total, average and marginal costs and revenues
To clarify the issues involved here requires us to discriminate carefully between total costs and revenues; average costs and revenues; and marginal costs and revenues:
Note our earlier outline of total and average costs given in Table 3.1. We can add an extra column illustrating the increase in TCs as output increases: from 1 to 2 units the increased TC is 50; from 2 to 3 the increase is 30; and so on. This is the column of MC seen in Table 3.2.
Table 3.2 Total, average and marginal costs.
Output |
Total |
Average |
Marginal |
|
cost |
cost |
cost |
|
|
|
|
1 |
100 |
100 |
— |
2 |
150 |
75 |
50 |
3 |
180 |
60 |
30 |
4 |
200 |
50 |
20 |
5 |
230 |
46 |
30 |
6 |
270 |
45 |
40 |
7 |
322 |
46 |
52 |
8 |
400 |
50 |
78 |
9 |
495 |
55 |
95 |
10 |
600 |
60 |
105 |
|
|
|
|
What would be the profit maximising output if the price of the product, determined in world markets, was stable and given as 60 per unit? That would give a table of total, average and marginal revenue as shown in Table 3.3.
In the example of Table 3.3, profits are maximised at where output equals 7 units. Check, if you wish, the TR and TCs at each output level and you will find the greatest difference between the two occurs at 7 units. The quickest way to find this profit maximising output, however, is simply to compare MCs and MRs. At output 7, MC equals 52, just short of MR at 60. That is, the cost of the seventh unit is less than the revenue it earns and so it is worthwhile producing it. The eighth unit, however, has MC of
© 2004 Tony Cleaver
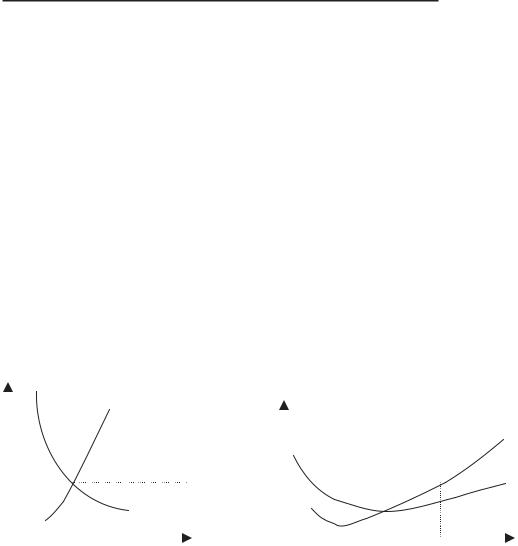
Table 3.3 Total, average and marginal revenue.
Output |
Total |
Price, or average |
Marginal |
|
revenue |
revenue |
revenue |
|
|
|
|
1 |
60 |
60 |
— |
2 |
120 |
60 |
60 |
3 |
180 |
60 |
60 |
4 |
240 |
60 |
60 |
5 |
300 |
60 |
60 |
6 |
360 |
60 |
60 |
7 |
420 |
60 |
60 |
8 |
480 |
60 |
60 |
9 |
540 |
60 |
60 |
10 |
600 |
60 |
60 |
|
|
|
|
|
|
World market |
|
Costs and revenues of one supplier |
||||
Price |
|
|
World supply |
Costs/revenues |
||||
|
|
|||||||
|
|
|
|
|
|
|
||
|
|
|
|
|
|
|
MC |
|
|
|
|
|
|
|
|
||
60 |
|
|
|
|
AR/MR = 60 |
|
AC |
|
|
|
|
|
|
|
|
||
|
|
|
World demand |
AC = 46 |
|
|
|
|
|
|
|
|
|
|
|||
|
|
|
|
|
|
|
||
|
|
|
|
|
|
|
|
|
|
0 |
|
|
|
7 |
|
||
|
|
World output |
|
Output of one supplier |
||||
Figure 3.3 Short-run profit maximisation for a competitive producer.
78 – much higher than the MR of 60. The enterprise loses by pushing production this far.
This analysis can be summarised in Figure 3.3.
Note that the ruling price is determined in world markets (at 60) and the individual producer compares this to his/her costs of production. With average and marginal costs as illustrated, the profit maximising output is shown at 7 units. At this level of output, the MC rises to equal the MR (equal to price).
© 2004 Tony Cleaver

TR, TC and total profits (TP) can all be derived from Figure 3.3.
TR equals the price (AR) times output: |
60 7 420 |
TC equals the average costs times output: |
46 7 322 |
TP equals TR TC, or AR AC times output: |
14 7 98 |
Thus TP, which are maximised at 7 units of output, are illustrated by the shaded area in the figure. It shows the difference between the price (AR) and unit costs (AC) at that level of output (7) where MR is closest to MC.
If there are large profits being made in a competitive market place there is bound to be an incentive for outsiders to enter and seek to do the same. This raises the theoretical notion of NORMAL, as opposed to ABNORMAL profits. Normal profits can be defined as a just and sufficient reward for an entrepreneur to conduct his/her business. Any less than this and the entrepreneur would not be getting enough compensation for the hard work and risks undertaken; any more than this and the business would be earning an excess above what is considered necessary. An enterprise earning less than normal profits would thus leave the market it is operating in and go look elsewhere to conduct its business; conversely a market place where existing businesses are earning above-normal (or abnormal) profits would act as a magnet for other firms to enter.
(Note: since entrepreneurs would not set up a business without the promise of normal profits, economists would define this level of reward as an essential cost of enterprise. It may at first acquaintance seem confusing to call ‘normal profits’ a sort of cost but that is indeed what they are in the view of economic theory!)
In a competitive market place, if outsiders are not restricted from entry, abnormal profits would lead to more businesses setting up, thereby increasing industry supply. The higher the original abnormal profits, the stronger the signal would be to attract outside interest and the more new entrants would flood in. The longer-term outcome is not difficult to see (Figure 3.4). As industry supply grows, (illustrated by a supply curve that shifts further and further
© 2004 Tony Cleaver
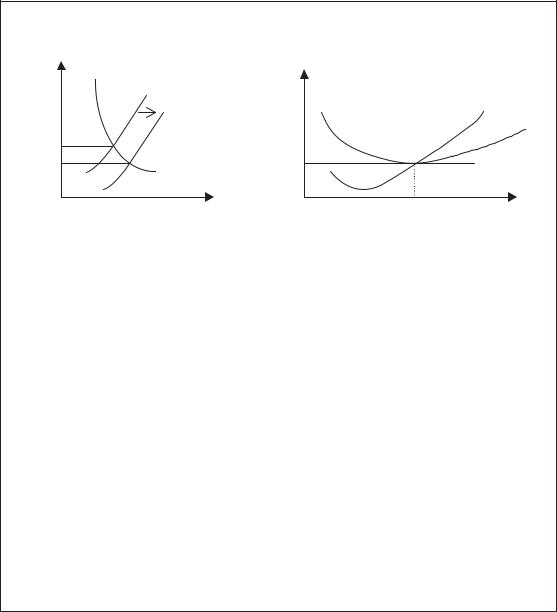
to the right, see Chapter 2) the more market prices will fall, squeezing down the profits earned by everyone until only normal profits remain for the latest newcomer.
High short-term prices and profits for Internet companies – the so-called dot.com boom – led precisely to this outcome in world markets at the turn of the millennium. First, there was a rush to create all sorts of dot.com businesses – which attracted much media interest, promised great future profits and thus prompted soaring share prices for start-up outfits that seemed to have nothing but young entrepreneurs with big ideas. Then a bust followed the boom when an oversupply of such enterprise could not return anything like the profits that were originally hoped for.
World market |
Costs and revenues of one supplier |
|
Price |
Costs/revenues |
|
World supply 1 |
|
MC |
|
|
|
World supply 2 |
AC |
|
|
||
60 |
|
|
45 |
45 |
AR/MR |
World demand |
|
|
0 |
6 |
7 |
World output |
Output of one supplier |
|
Figure 3.4 Long-term profit maximisation for a competitive producer.
Note the difference from the Figure 3.3. Abnormal profits (the shaded area in Figure 3.3) have all been eroded as market prices have fallen. The long-run equilibrium for producers in a competitive market is thus where prices and MRs equal MCs just where ACs are at their lowest and no abnormal profits remain to tempt the entry of further competition. Two conditions of equilibrium now exist – for the individual firm and for the industry as a whole. The firm or enterprise is at its profit maximising equilibrium where its MCs equal its (lower) MR, and the industry is in equilibrium with only normal profits being available and thus where no further movements of suppliers in or out of the market place will take place.
© 2004 Tony Cleaver
Note that a highly competitive market environment is generally considered to be the most efficient and equitable form of economic organisation. Profits are earned by catering for public demand and the more successful the producer is in this respect, the more other competitors will follow. Increasing rivalry drives each business to look for ways to reduce costs and economise on society’s resources and, simultaneously, so long as competition prevails it prevents any one producer from accumulating excessive profits and abusing its market power.
M O N O P O LY A N D O L I G O P O LY
The reality in many business contexts, however, is that a small minority of giant firms dominate the market place such that small producers feel relatively powerless. For almost any industry you can think of, you can probably also think of the handful of famous names that bestride it – from sophisticated, high tech. products like passenger aircraft (Boeing, Airbus) to the mundane household items like washing powder (Proctor and Gamble, Unilever); from things you can hold in your hand (Nestle, Coca-Cola) to abstract ideas and entertainment (AOL TimeWarner, Sony).
A monopoly is a single large firm that sells its product in a market place with no effective rival. If such a development were allowed in the supply of an essential good or service, the monopolist would exercise great economic power – customers would have to pay the price the monopolist wanted or go without, since there would be no alternative supplier. Most countries therefore have legislation to prevent the growth of private monopolies to anything greater than 25 per cent of market share, with the result – as mentioned earlier – that industrial concentration stops short of single firm dominance and thus competition occurs between a small number of very large firms. This is a market structure known as OLIGOPOLY.
Industries dominated by a few big rivals still means that each business wields an impressive economic influence, however. The European Commission calculates that 0.2 per cent of the total number of businesses on the continent control over 37 per cent of market sales and these large firms, on average, employ over a thousand people each. When it comes to multinational corporations – businesses that own and control assets in more than one country – the top
© 2004 Tony Cleaver
200 multinationals across the globe jointly produce about one third of the world’s total output. Not much evidence here of the forces of competition preventing the accumulation of market power!
What accounts for the prevalence of such large corporate enterprises and why has their growth to such dominance not been constrained by follow-my-leader-competition as theorised earlier?
In some cases it can actually be the forces of competition, over time, leading to the survival of the fittest. The more efficient firms in an industry may be able to reduce costs and prices below those of their rivals, drive them out of business or take them over and thus convert what was a competitive market place into one dominated by a few large corporations.
Modern banking has sometimes been described in these terms. The nature of banking as a business lends itself to over-optimistic expansion on the one hand, followed by financial crashes where the weakest go to the wall. Where this process has worked its longest – in Europe and the USA – a few very large enterprises have emerged, each with considerable financial muscle that simultaneously acts as a safeguard against crises that would destroy smaller brethren and also provides a key competitive advantage. (Bigger, safer banks are more likely to attract more custom.)
Note, however, that this process of industrial or commercial evolution could not succeed in producing a dominant few – in banking or anywhere else – if the businesses that remain could not somehow retain a competitive edge: some advantage that inhibits the entry of new, lean and hungry enterprises looking to capitalise on the profits that the lead oligopolists feed off.
B a r r i e r s t o E n t r y
Economies of scale provide one explanation for oligopolies being able to resist dilution of their market power by the entry of new businesses. Financial and risk-bearing economies are relevant in the case of banking referred earlier (large financial enterprises can buy and sell money in bulk and thus can offer lower price deals to customers) but other economies of scale include technical factors. For example, in aerospace, the oil industry and also in pharmaceuticals, the capital threshold that new firms have to cross before they can bring their costs down to a level commensurate with existing
© 2004 Tony Cleaver
suppliers is simply immense. Where technically complex production processes are involved in bringing goods to markets, then the set-up costs for new entrants are a natural barrier to the forces of competition. In some sectors, only very big businesses can be efficient and the market place – even world-wide – may not be large enough to support more than two or three firms. (For example, just three enterprises dominate world aero-engine supply: General Electric, Rolls Royce and Pratt & Whitney.)
We can discriminate, however, between barriers of entry like those described earlier, which are structural or due to real economic forces and those which are behavioural, or due to the manipulation of power by existing oligopolists. Massive advertising campaigns, for example, may be resorted to by existing firms which inflate production costs on the one hand and create a brand image, on the other, which new producers find hard to overcome. The technology involved in producing carbonated soft drinks, for example, is hardly rocket science (quite the opposite, it is one of the first industries that low-income countries can invest in to develop their own emerging industrial sector and serve their own peoples). Nonetheless, the powerful presence enjoyed by the duopoly of Coca-Cola and PepsiCo greatly reduces the room for poor countries to promote industrial expansion in this particular market place.
Product differentiation is a strategy pursued by large firms to increase the range of items they sell. Varying superficial qualities of the product – colour, packaging, logos, special offers and other marketing gimmicks – helps create a different BRAND in the mind of the consumer. Thus the many supermarket offerings of breakfast cereals seem to the untutored eye to illustrate very active competition between a large number of rival producers but, on closer inspection, the scores of different brands on display are all produced by two or three large oligopolists. (Even supermarket ‘own brand’ items are simply purchased from these same producers and retailed in cheaper packaging.) Product differentiation is a ruse employed by such enterprises to block out the market. Any genuine new entrant to this industry therefore faces having to establish its identity against a wealth of dazzling alternatives.
Vertical and horizontal INTEGRATION refer to directions of industrial growth that large firms may indulge in to exercise greater market control. In the late part of the nineteenth century,
© 2004 Tony Cleaver