

Cleaver Economics The Basics (Routledge, 2004)
.pdfRockefeller’s original Standard Oil (SO) company accumulated vast profits by buying up or building all the pipelines serving North Eastern US markets with oil from the Southern producer states. This was horizontal integration – monopolising all business at one stage of the production process, in this case the transporting of oil. (In 1911, SO was broken up by US anti-trust legislation as a result of this abuse of its power. It was such a huge business, however, that the several parts into which SO was cut up all evolved to become international oil majors in their own right.) As a result of this experience, many oil producers have since resorted to vertical integration to ensure they always have some degree of control over supplies and markets – buying up, building or signing exclusive long-term contracts with upstream suppliers or downstream distributors in the production chain. Modern day Exxon (which Esso became) therefore owns and controls a stake in all the processes involved in the international oil industry – from oilfields, to pipelines and oil tankers, to refineries and gas stations that operate all around the world.
Finally, an important reason for industrial concentration, if not actual monopoly, is government legislation or patronage. An innovating firm may apply for a PATENT or sole licence to supply a unique product or process. Drug companies, for example, may spend fortunes developing a new medicine but such innovations, though costly to develop, may be very cheap to imitate. Without patent protection, therefore, such firms would be unlikely to invest in new ideas. Monopoly status is thus conferred with an official patent that sets a time limit to the innovation – guaranteeing the firm sufficient time and thus reward to recoup the investment before other imitators can enter the market.
State monopolies or nationalised industries are those enterprises owned and controlled by public authority where the law actually forbids competition. There has been a world-wide trend to privatise much state enterprise therefore fewer examples remain today, but nonetheless in many countries the post office remains a monopoly, as are certain public utilities (the distribution of gas, electricity and water). In defence industries and in the provision of nuclear energy the state may or may not own the production process but via exclusive government contracts it will determine outputs and restrict competition in this area for security reasons.
© 2004 Tony Cleaver
In all these cases, where monopolists or oligopolists dominate a market place they are able to exert greater control over prices and thus their sales and profits. Industry supply in these circumstances will differ from the perfectly competitive model described earlier in a number of vital ways.
M o n o p o l y D e m a n d
There is an important distinction between the demand conditions for monopoly and for oligopoly and this is examined in this section and in further detail in the boxes that follow.
First, the more a large firm monopolises a market place the more the demand for its particular product will come close to that for the industry’s output as a whole. Oligopolists attempt to mimic this situation which is why corporations invest large sums in product differentiation. The objective is to create customer loyalty – that is, the monopoly of a brand. (‘The one and only – accept no substitute!’)
The ideal situation for the firm is that demand for its product thus becomes price-inelastic: consumers are so accustomed to buying their favourite brand that sales do not fall appreciably even if its relative price rises.
Profit-maximising enterprises operating in conditions of monopoly will deliberately restrict production if this forces prices up more than unit costs. We can predict that if margins between average prices and costs can thus be widened, and barriers to entry to the industry can be maintained to frustrate new competition, then abnormal profits can be realised even in the long run (Box 3.2).
Box 3.2 Profit-maximising monopoly
In the case of a pure monopoly where there is only one producer and no competition whatsoever, the demand curve for the firm must be identical to that for the industry. Unlike a competitive firm that must accept whatever price the free market dictates – see Figures 3.3 and 3.4 – the monopolist in contrast is
© 2004 Tony Cleaver
a price maker. The firm dictates what price will rule simply by deciding what level of supply to produce. Restricting production will push prices up since consumers are forced to outbid each other to secure their purchases; increasing supplies will cause prices to fall.
Note the effect this has on MRs. For a normal, downwardsloping demand curve, since the monopolist must reduce prices if sales are to be increased, MR (earnings gained on the last item sold) must always be less than the average.
Check the derivation of average and marginal revenues in Table 3.4 and Figure 3.5.
TR is derived from multiplying the price (P) of the good, times the quantity (Q) sold. Note, in reverse, that dividing TR by Q gives you P which is the same as AR. This relationship shown between P and Q is actually the demand curve of the firm – which
Table 3.4 Monopoly costs and revenues.
Q |
TC |
AC |
MC |
P/AR |
TR |
MR |
TP TR TC |
|
|
|
|
|
|
|
|
|
|
1 |
100 |
100 |
50 |
135 |
135 |
105 |
35 |
|
2 |
150 |
75 |
120 |
240 |
90 |
|||
30 |
75 |
|||||||
3 |
180 |
60 |
105 |
315 |
135 |
|||
20 |
45 |
|||||||
4 |
200 |
50 |
90 |
360 |
160 |
|||
30 |
15 |
|||||||
5 |
230 |
46 |
75 |
375 |
145 |
|||
40 |
15 |
|||||||
6 |
270 |
45 |
60 |
360 |
90 |
|||
52 |
45 |
|||||||
7 |
322 |
46 |
45 |
315 |
7 |
|||
78 |
75 |
|||||||
8 |
400 |
50 |
30 |
240 |
160 |
|||
95 |
105 |
|||||||
9 |
495 |
55 |
15 |
135 |
360 |
|||
105 |
135 |
|||||||
10 |
600 |
60 |
0 |
0 |
600 |
|||
|
|
|||||||
|
|
|
|
|
|
|
|
Note
MCs and MRs are calculated on the difference between one level of output and the next which is why they are recorded between the lines.
© 2004 Tony Cleaver
MC |
90 |
AC |
5 0 |
AR |
MR |
4 |
Output |
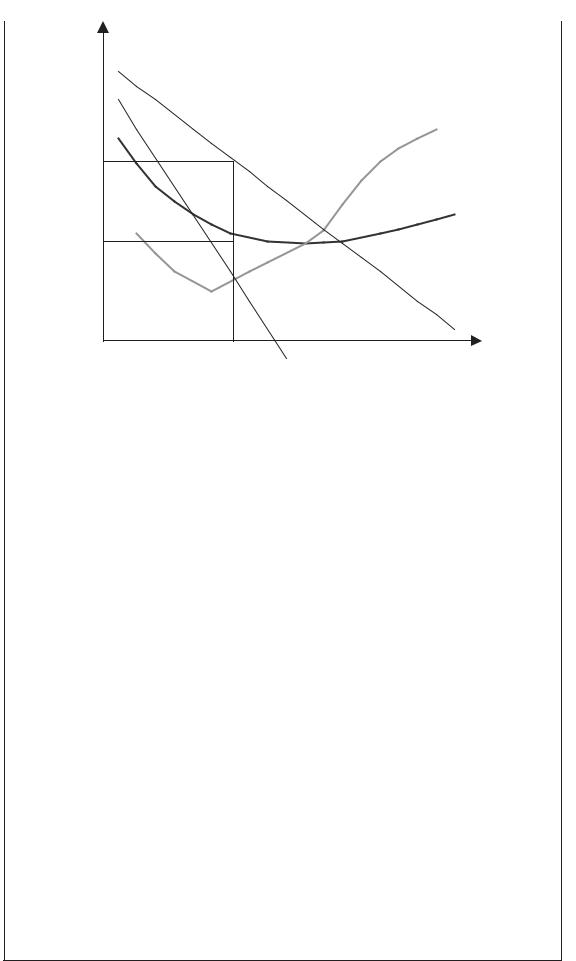
Figure 3.5 The profit-maximising monopolist.
in the case of a pure monopoly is the same as the demand curve for the industry.
The MR curve shows the increase in TR brought about by the sale of one extra unit and it falls faster than AR.
Remember that no profit-seeking enterprise will expand production to the point where the last good sold nets less revenue than it costs to produce. That is, the firm – whether it be operating in conditions of competition or monopoly – will produce only up to the point where MCs equal MR. In Table 3.4, check that the monopolist will produce 4 units of output but not 5. In Figure 3.5, the firm is at equilibrium at 4 units of output where Price/AR is 90 and AC is 50. Total (abnormal) profits (TP) thus will be maximised at 90 50 4 160, confirmed by reference to the table of data.
Note: The profit maximising equilibrium as illustrated is stable only so long as new competitors are barred from entry to the industry. If, in time, new suppliers gain access to the market then the demand/AR curve for the existing monopolist will shift back as sales are lost. This squeezes out some of the abnormal profits as the distance between price (AR) and unit costs (AC) closes.
© 2004 Tony Cleaver
O l i g o p o l i s t i c R i v a l r y
Oligopoly, remember, is a market structure where there are a few, very large corporations sharing power in an industry with substantial barriers to entry restricting access to any other firms. In such a situation, each business would ideally want to dominate the market and so rivalry is intense: every firm has to keep a close eye on the actions of its competitors.
Imagine the scenario with five firms dominating an industry – each with 20 per cent market share. If one supplier wishes, say, to cut the price of its product and thus compete more business away from its rivals then you can be sure that the other four firms will be equally determined not to let this happen. In an example of pricecutting, all would promptly follow suit. The end result would thus be all five businesses would retain the same market share but now at a lower, less profitable price.
Driving prices down to the limit where average revenues equal average costs and only normal profits remain is the inevitable outcome of competitive industry where new entrants cannot be excluded. But where barriers to competition limit production to a few, very large businesses, each one warily watching the other, it is extremely unlikely that the rivals would want to engage in price wars. More likely they would want to collude and push prices up to all firms’ mutual advantage. The oligopolists thus act as one – joint profit maximisation – which is the typical outcome of a CARTEL (Box 3.3).
Rigging prices is against the law, however. Active collusion must be avoided since it can be severely punished – though this still does not remove the incentive, under oligopoly, for competition to be constrained. What results, therefore, is tacit collusion: a passive, unspoken (and thus unpunishable) understanding not to excessively stir up deep waters.
There is an inevitable reluctance to engage in extremely rivalrous and damaging ‘cut-throat’ price wars and instead a preference to move competition into the realms of advertising, marketing, ‘special offers’ and other sales promotions. Investing in large marketing divisions and resorting to creative ways to practice NON- PRICE COMPETITION can also be costly but it is a safer, less unpredictable business practice and mutually beneficial to the existing rivals in that it builds up even higher barriers to potential new competition.
© 2004 Tony Cleaver

Box 3.3 Cartels
It is precisely the tendency to COLLUSION that governments need to monitor and legislate against in order to prevent the public from being exploited. Setting up a cartel – a formal agreement between rivals to rig the market – is illegal in most countries, though cartels between international operators are more difficult to outlaw since there is no one world body that can be relied upon to stop them (especially if it is national governments that actively collude!)
The Organisation of Petroleum Exporting Countries (OPEC) is frequently cited as a cartel but in fact it has been far less exploitative than the cartel of major oil companies that preceded it and formerly controlled international oil supplies (see Box 6.9). The national governments represented by OPEC now regularly meet to arrange production quotas between them but disagreement is common.
What conditions are likely to be conducive to the successful operation of a cartel? Under what circumstances must governments be most vigilant to protect the interests of consumers?
Collusion is most likely to succeed:
1the smaller the number of rival producers and the higher the barriers to entry;
2where the interests and objectives of each producer are
similar;
3where the product is homogenous, difficult to differentiate
and thus highly substitutable;
4 where the actions of each producer are highly visible to all;
5where market demand is stable;
6where legal restrictions can be easily bypassed or bought off.
O l i g o p o l y D e m a n d
The demand curve for the firm – which shows the relationships between the price of the product and its quantity sold – given the oligopoly conditions just described can be quite unique. Consider what would happen if one of the rival corporations was determined
© 2004 Tony Cleaver

to change its selling price: as Firm A cuts its price, so too would Firms B, C, D and E. The sales of all products in the market place may grow a little overall but the individual demand for each firm would not change by much. If, in contrast, Firm A puts its price up then it is unlikely that any of its rivals would follow suit. Firms B, C, D and E would benefit from extra sales if they kept their prices low, picking up consumers of product A who would now switch to the rivals’ lower price alternatives (Box 3.4).
Box 3.4 Price stickiness
With asymmetric demand in the market for the products of oligopoly, the shape of each firm’s AR/demand curve would be kinked at the point of the current ruling price, P as illustrated in Figure 3.6.
Demand for the oligopolist’s product is price-elastic above price P and price-inelastic below P . Note the MR curve that is derived from a kinked AR/demand curve is shown as vertical at quantity Q . What this implies is that – since the oligopolist maximises profit at that output where MC equal MR – no matter if production costs increase quite considerably (e.g. anywhere
Price/revenue |
|
P |
|
C |
|
|
Demand/AR |
|
MR |
|
Output |
0 |
Q |
Figure 3.6 The oligopolist’s demand curve.
© 2004 Tony Cleaver
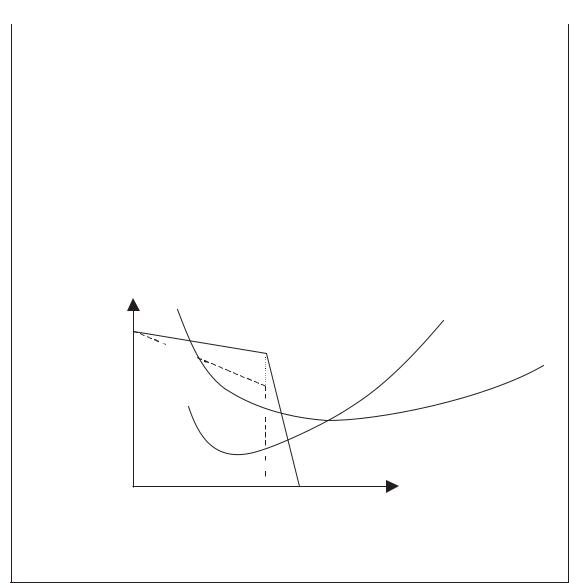
from 0 to C ) price and output will still not change. This is shown in Figure 3.7.
Adding the oligopolist’s cost structure to the pattern of demand identifies the firm’s equilibrium price P* and output Q*. Abnormal profits are given by the box (P* C*)Q*. Note that the effect on this equilibrium of any increase or decrease of MC and AC here would be minimal, whereas a shift back in demand (AR) caused by any increase in competition from rivals would have, in contrast, a serious impact on price, output and profits.
Price/costs/revenue
MC
P * 


AC
C * 


 AR MR
AR MR 
 Output 0 Q*
Figure 3.7 Profit-maximising oligopoly.
Prices under oligopoly tend to be stable, therefore. At least they will be so for relatively long periods until something occurs to upset the equilibrium. The sudden appearance of a new competitor, a technological breakthrough or a revolutionary new product or process may then turn the relative stability of the status quo into turmoil. For a brief period, an intense battle over market shares will take place as the original ‘pecking order’ or hierarchy between rivals is challenged. Cut-throat price competition may be resorted to in order to eject an upstart interloper from the market place or to reexamine the economic efficiency and thus supremacy of the remaining firms. After a period of aggressive activity where shortterm profits are sacrificed in the quest for a new order, eventual
© 2004 Tony Cleaver
calm will be restored as all survivors realise that mutual interests are best served again by tacit collusion.
A highly dramatised and fictional (?) illustration of oligopolistic conflict is given in the novel The Godfather by Mario Puzo – a fascinating study of rivalry between New York Mafia organisations which gives new meaning to cut-throat, corporate blood-letting! Only slightly less colourful have been reports on the antics of international airlines in trying to carve up North Atlantic passenger routes. The end of the twentieth century saw the major players in this market accused of all sorts of dirty tricks designed to prevent the entry of new budget airline operators such as Laker Airways (successfully beaten off in the 1960s) and, later, Virgin Airways (forewarned, forearmed and able to establish itself in the more competitive 1990s).
Many examples of oligopolistic rivalry can be quoted where, in between the extremes of intense competition or secretive collusion, the pre-occupation of business leaders in protecting market share and pursuing profits seems to be at the direct expense of the public’s interest. Big tobacco companies have deliberately suppressed information of the harmful effects of their products; international banks have promoted cheap loans and increased the indebtedness of poorer peoples before hoisting up interest rates; pharmaceutical giants charge exploitative prices for AIDS vaccines and other life-saving medicines that consumers must purchase, or perish (Box 3.5).
Large, oligopolistic corporations that have built up business empires that span the globe wield an enormous amount of economic power, therefore. The challenge to governments is how to channel this corporate muscle so that the ends it pursues suit the public, as well as business, interests.
Adam Smith famously commented in 1776 that the individual in a market economy ‘is led by an invisible hand to promote an end which was no part of his intention. By pursuing his own interest he frequently promotes that of society more effectually than when he really intends to promote it’. That sentiment still exerts a persuasive influence on Western economic policy making: the claim that all will be for the best if only private enterprise is left alone. Oligopoly theory predicts otherwise.
© 2004 Tony Cleaver

Box 3.5 Big pharma
At the time of going to press, the world’s largest pharmaceutical company, Pfizer, reported corporate profits of US$4.7 billion for one quarter of 2002. It competes with a handful of other US and European firms world-wide to develop and distribute branded drugs to combat a variety of medical ailments.
Drug companies such as these do not nowadays act so much as primary innovators in the field – their home-grown supply of new products is less important than contracting new ideas from a host of small, specialist biotech firms. That is, ‘big pharma’ increasingly uses its economies of scale to raise finance, buy out competition, negotiate/bribe supportive regulations from governments and international agencies, run lab and field tests on the latest drugs and to launch massive sales promotions around the globe. In 2001, the top ten US drug companies spent $19.1 billion on research and development and more than twice that, $45.4 billion, on marketing, advertising and administration. (Quoted in The Times, 20 March 2003.)
Profit-seeking has implications for which markets to serve and what prices to charge. The biggest killer of children in the world today is malaria – the prime cause of infant mortality in the developing world. But poor children and their families have little purchasing power and no drug company is therefore much interested in researching better treatment. In contrast, the biggest killer in the rich world where populations are rapidly ageing is heart disease. Cholesterol-reducing drugs are a huge money-spinner, investments are massive and there is much product differentiation as each oligopolist tries to sell its own product. (Equally profitable is developing lots of ‘me too’ drug copies of viagra – to address a less than fatal affliction of older, richer men.) To maximise profits, prices are highest in those markets where people are richer, where government regulations prohibit cheap copies and where the medical consequences of not buying the drugs are serious . . .
© 2004 Tony Cleaver