


200 Ship Design for Efficiency and Economy
Table 6.13 Coefficients for minimum resistance in Hollenbach's method
|
|
a1 |
a2 |
a3 |
a4 |
|
|
|
|
|
|
Single-screw ship |
0.3382 |
0.8086 |
6.0258 |
3.5632 |
|
Twin-screw ship |
0.2748 |
0.5747 |
6.7610 |
4.3834 |
|
For single-screw ships |
|
|
|
|
|
|
|
|
|
|
|
a00 |
0.9142367 |
a10 |
4.6614022 |
a20 |
1.1421462 |
a01 |
13.389283 |
a11 |
39.720987 |
a21 |
12.329636 |
a02 |
90.596041 |
a12 |
351.48305 |
a22 |
459.25433 |
For twin-screw ships |
|
|
|
|
|
|
|
|
|
|
|
a00 |
3.2727938 |
a10 |
11.501201 |
a20 |
12.462569 |
a01 |
44.113819 |
a11 |
166.55892 |
a21 |
179.50549 |
a02 |
171.69229 |
a12 |
644.45600 |
a22 |
680.92069 |
Table 6.14 Range of validity for minimum resistance, Hollenbach's method
|
Single-screw |
|
Twin-screw |
|
|
|
|
|
|
Fn;min, CB 0:6 |
0.17 |
|
0.15 |
|
Fn;min, CB > 0:6 |
0:17 C 0:2 .0:6 CB/ |
2 |
0:14 |
2 |
Fn;max |
0:614 0:717 CB C 0:261 |
CB |
0:952 1:406 CB C 0:643 |
CB |
6.4 Additional resistance under service conditions
Appendages
Properly arranged bilge keels contribute only 1±2% to the total resistance of ships. However, trim and ship motions in seastates increase the resistance more than for ships without bilge keels. Thus, in evaluation of model tests, a much higher increase of resistance should be made for ships in ballast condition.
Bow-thrusters, if properly designed and located, do not significantly increase resistance. Transverse thrusters in the aftbody may increase resistance by 1±6% (Brix, 1986).
Shaft brackets and bossings increase resistance by 5±12% (Alte and Baur, 1986). For twin-screw ships with long propeller shafts, the resistance increase maybe more than 20% (Jensen, 1994).
Rudders increase resistance little ( 1%) if in neutral position and improve propulsion. But even moderate rudder angles increase resistance by 2±6% (Alte and Baur, 1986).
Shallow water
Shallow water increases friction resistance and usually also wave resistance. p
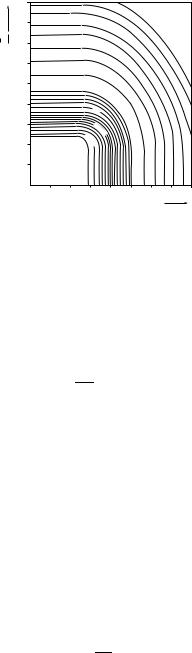
Near the critical depth Froude number Fnh D V= gh D 1, where h is the water depth, the resistance is strongly increased. Figure 6.2 allows one to estimate the speed loss for weak shallow-water influence (Lackenby, 1963). For strong shallow-water influence a simple correction is impossible as wave breaking, squat and deformation of the free surface introduce complex physical interactions. In this case, only model tests or to some extent CFD may help.
Ship propulsion 201
ÖAM h
0.9
0.8
0.7
0.6
0.5
0.4
0.3
0.2
0.1
9 |
10 |
% |
|
% |
|
8 |
|
% |
|
7 |
|
% |
|
6 |
|
% |
|
5 |
|
% |
|
4 |
|
% |
|
3% |
|
2% |
|
1% |
|
0 |
|
. |
|
5 |
|
% |
|
0 |
|
. |
|
1 |
|
% |
|
Percentage loss in speed
0 |
0.1 |
0.2 |
0.3 |
0.4 |
0.5 |
0.6 |
0.7 |
0.8 |
V 2 g∙h
Figure 6.2 Shallow water influence and speed loss for shallow water
Wind
Wind resistance is important for ships with large lateral areas above the water level, e.g. containerships and car ferries. Fast and unconventional ships, e.g. air-cushioned vehicles, also require inclusion of the contribution of wind or air resistance. Jensen (1994) gives a very simple estimate for the wind resistance of cargo ships:
RAA D CAA air .V C Vwind/2 AF
2
For cargo ships CAA D 0:8±1:0. air D 1:25 kg/m3 the density of air, Vwind is the absolute value of wind speed and AF is the frontal projected area of the
ship above sea level.
The wind resistance may be estimated with more accuracy following
Blendermann (1993, 1996): |
|
|
|
|
|
||||||||
RAA |
|
air |
u2 |
|
AL |
|
CDl |
|
|
cos " |
|
|
|
D |
2 |
|
|
1 |
2 |
1 CDt |
sin2 |
2" |
|||||
|
|
|
|
|
|
|
|
|
À |
|
CDl |
|
|
where u is the apparent wind velocity, AL the lateral-plane area, " the apparent wind angle (" D 0° in head wind), À the cross-force parameter, and coefficients CD t and CDl the non-dimensional drag in beam wind and head wind, respectively. It is convenient to give the longitudinal drag with respect to the frontal projected area AF:
AL
CDl AF D CDl AF
Table 6.15 gives typical values for CDt, CDl AF and À. The maximum wind resistance usually occurs for 0° < " < 20°. The above formulae and the values in the table are for uniform or nearly uniform flow, e.g. above the ocean. The wind speed at a height of 10 m above sea level is usually taken as reference

202 |
Ship Design for Efficiency and Economy |
|
||
Table 6.15 Coefficients to estimate wind resistance, |
|
|||
Blendermann (1996) |
|
|
|
|
|
|
|
|
|
|
|
CDt |
CDl AF |
À |
Car carrier |
0.95 |
0.55 |
0.80 |
|
Cargo ship, container on |
|
|
|
|
deck, bridge aft |
0.85 |
0.65/0.55 |
0.40 |
|
Containership, loaded |
0.90 |
0.55 |
0.40 |
|
Destroyer |
0.85 |
0.60 |
0.65 |
|
Diving support vessel |
0.90 |
0.60 |
0.55 |
|
Drilling vessel |
1.00 |
0.70±1.00 |
0.10 |
|
Ferry |
|
0.90 |
0.45 |
0.80 |
Fishing vessel |
0.95 |
0.70 |
0.40 |
|
LNG tanker |
0.70 |
0.60 |
0.50 |
|
Offshore supply vessel |
0.90 |
0.55 |
0.55 |
|
Passenger liner |
0.90 |
0.40 |
0.80 |
|
Research vessel |
0.85 |
0.55 |
0.60 |
|
Speed boat |
0.90 |
0.55 |
0.60 |
|
Tanker, loaded |
0.70 |
0.90 |
0.40 |
|
Tanker, in ballast |
0.70 |
0.75 |
0.40 |
|
Tender |
|
0.85 |
0.55 |
0.65 |
|
|
|
|
|
speed. Wind speed in Beaufort (Beaufort number BN) is converted to [m/s] by:
u10 D 0:836 BN1:5
Blendermann (1993) gives further details on wind forces, especially for side forces, yaw and roll moments.
Roughness
The friction resistance can increase considerably for rough surfaces (Naess, 1983). For newbuilds, the effect of roughness is included in the ITTC line or the correlation constant. The values of the correlation constant differ considerably between different towing tanks depending on the extrapolation procedures employed and are subject to continuing debate among hydrodynamicists. In general, correlation allowances decrease with ship size and may become negative for very large ships. For guidance, Table 6.16 recommends values in conjunction with the ITTC 1957 friction coefficients (Keller, 1973). Of course, there is no negative `roughness' in reality. Rather, the correlation allowance includes other effects which dominate the roughness correction for large ships.
Table 6.16 Correlation allowance with ITTC line
Lwl [m] |
100 |
180 |
235 |
280 |
325 |
400 |
CA |
0.0004 |
0.0002 |
0.0001 |
0 |
0.0001 |
0.00025 |
A rough hull surface (without fouling) increases the frictional resistance by up to 5% (Jensen, 1994). Fouling can increase the resistance by much more. However, modern paints prevent fouling to a large extent and are also `self-polishing', i.e. the paint will not become porous like older paints. More extensive discussions of the influence of roughness can be found in Berger

Ship propulsion 203
(1983), Collatz (1984), and Alte and Baur (1986). For ship hull design, the problem of roughness is not important.
Seaway
The added resistance of a ship in a seaway may be determined by computational methods which are predominantly based on strip methods (Soding¨ and Bertram, 1998). However, such predictions for a certain region or route depend on the accuracy of seastate statistics. Ship size is generally more important than ship shape, although a low CB is deemed to be advantageous. Bales et al. (1980) give seastate statistics that can be recommended for the North Atlantic.
Townsin and Kwon (1983) give simple approximate formulae to estimate the speed loss due to added resistance in wind and waves:
1V D C Cship V
C is a factor considering the predominant direction of wind and waves, depending on the Beaufort number BN:
C D 1:0 |
for |
D 0°±30° |
C D 1:7 0:03 .BN 4/2 |
for |
D 30°±60° |
C D 0:9 0:06 .BN 6/2 |
for |
D 60°±150° |
C D 0:4 0:03 .BN 8/2 |
for |
D 150°±180° |
Cship is a factor considering the ship type:
Cship D 0:5BN C BN6:5=.2:7 r2=3/ |
for tankers, laden |
Cship D 0:7BN C BN6:5=.2:7 r2=3/ |
for tankers, ballast |
Cship D 0:7BN C BN6:5=.2:2 r2=3/ |
for containerships |
r is the volume displacement in [m3]. Table 6.17 gives relations between Beaufort number, wind speeds and average wave heights.
Table 6.17a Wind strengths in Beaufort (Bft),
Henschke (1965)
Bft |
Wind description |
Wind speed [m/s] |
|
|
|
0 |
No wind |
0.0±0.2 |
1 |
Gentle current of air |
0.3±1.5 |
2 |
Gentle breeze |
1.6±3.3 |
3 |
Light breeze |
3.4±5.4 |
4 |
Moderate breeze |
5.5±7.9 |
5 |
Fresh breeze |
8.0±10.7 |
6 |
Strong wind |
10.8±13.8 |
7 |
Stiff wind |
13.9±17.1 |
8 |
Violent wind |
17.2±20.7 |
9 |
Storm |
20.8±24.4 |
10 |
Violent storm |
24.5±28.3 |
11 |
Hurricane-like storm |
28.5±32.7 |
12 |
Hurricane |
>32.7 |
|
|
|