

Multiple Bonds Between Metal Atoms / 16-Physical, Spectroscopic and Theoretical Results
.pdfPhysical, Spectroscopic and Theoretical Results 767
Cotton
group of ligand ionizations. Another proposal was that the μ ionization also contributes to the c. 9 eV peak and is unresolved. Results on the W2(O2CR)4 compounds provide support for this second proposal, the argument being that the accidental overlap occurring in the Mo case is now replaced by two non-overlapping bands. The sharp band for the tungsten compounds is then assigned to the μ ionization, but this raises a question (or at least an eyebrow) because such a narrow band implies that the μ-bond is relatively weak, which may seem counter-intuitive. However, because of the very close approach of the two metal atoms in M–M quadruple bonds, it is possible that the dz2-dz2 overlap is not entirely favorable to M–M bonding.304
Fig. 16.40. The PES (He I) of the M2(O2CMe)4 molecules in the gas phase.
Fig. 16.41. The first band in the PES of Cr2(O2CMe)4.
An important result304 in this regard was obtained by comparing the PES spectrum of MoW(O2CCH3)4 with those of the Mo2 and W2 compounds, as shown in Fig. 16.42. It seems clear that on going from the W2 to the MoW compound the gap between μ- and /-bonds is closing and that by carrying this process one step further, the unresolved superposition found in the Mo2 case would be a logical result. It should be noted that in spite of all efforts to effect some resolution of the two bands in an Mo2(O2CR)4 compound by changing the R group, no such observation has been made.

768Multiple Bonds Between Metal Atoms Chapter 16
Fig. 16.42. The PES of MM'(O2CMe)4 molecules with MM' = MoMo, MoW and WW.
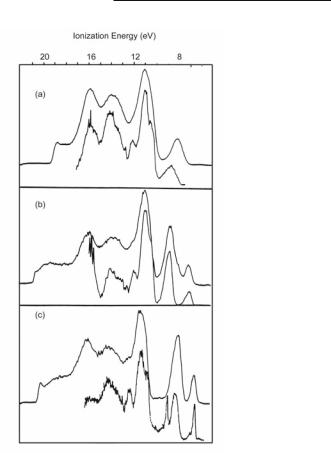
A study of the PES of solid M2(O2CCH3)4 compounds,306 as thin films deposited from the vapor phase, and a comparison of these spectra with the vapor phase spectra previously studied has provided results that in no way contradict the interpretations just discussed. Fig. 16.43 presents the results. It should be recalled that for all three compounds there is intermolecular linking via oxygen atoms into infinite chains, but this is much stronger in the chromium case. In fact, for Cr2(O2CCH3)4 the Cr–Cr distance changes greatly from the gas phase (1.97 Å) to the solid phase (2.29 Å) whereas for Mo2(O2CCH3)4 the change is slight (2.079 Å to 2.093 Å). Presumably the change for W2(O2CCH3)4 is also very small.
It can be seen in Fig 16.43 that the first band for Cr2(O2CCH3)4 shifts quite a bit (c. 0.5 eV) toward lower binding energy from the gas to the solid phase, in keeping with the large increase in Cr–Cr distance. For Mo2(O2CCH3)4 there is no significant change in band energies, but a shoulder on the low energy side of the second band emerges in the solid state. It has been suggested304 that this represents a partial breaking out of the μ ionization. For W2(O2CCH3)4 it is clear that the proposed μ band has moved down in energy and is no longer resolved from the / band. The //β intensity ratio correspondingly increases from c. 3:1 to c. 5:1.
The behavior of the thin film Mo2(O2CCH3)4 PES as the photon energy is varied307 provides more insight into the makeup of the μ, / and β orbitals. The / orbitals have the largest metal 4d character, while the μ and β orbitals show more mixing with orbitals of the acetate ions.
A study of Mo2(O2CCF3)4 in the gas phase308 gave results similar to those for Mo2(O2CCH3)4 but displaced to higher ionization energies. The displacement for the β ionization is c. 1.8 eV.
Physical, Spectroscopic and Theoretical Results 769
Cotton
Fig. 16.43. Comparison of PES (He I) spectra in thin solid films (upper) and gases (lower) for Cr2(O2CMe)4 (a), Mo2(O2CMe)4 (b), and W2(O2CMe)4 (c).
One of the most beautiful PES results obtained in the M–M multiple bond field, is the vibrationally resolved β ionization band for Mo2(O2CCH3)4.268 Fig. 16.44 shows the experimental band and a schematic indication of how a Franck-Condon analysis was carried out. The progression is in the ι(Mo-Mo) frequency for the [Mo2(O2CCH3)4 ]+ ion in its 2B2g ground state (360 ± 10 cm-1). This may be compared to 406 cm-1 for the neutral molecule in its μ2/4β2 (1A1g) ground state and 390 cm-1 in its μ2/4ββ*(1A2u) excited state. A quantitative Franck-Condon analysis from which an Mo–Mo distance in the ion of 2.26 ± 0.02 Å was deduced is not so simple as Fig. 16.44 makes it appear.
Fortunately, other group 6 paddlewheel molecules can also be vaporized in ultra high vacuum without decomposition, and thus the influence of more basic ligands has been determined. A major study dealt with the M2(DPhF)4 molecules (M = Cr, Mo, W) and the Mo2(DCyF)4 molecule.309 It was found that in contrast to the acetate compounds, several formamidinatebased ionizations derived from the nitrogen p/ orbitals occur among the metal-metal μ, /, and β ionization bands. Although these formamidinate-based levels are close in energy to the occupied metal–metal bonding orbitals, there is little direct mixing. All in all, there appears to be a greater degree of metal–ligand covalency than with the carboxylate compounds and the greater basicity of the formamidinates pushes the M–M orbitals to lower energies.

770Multiple Bonds Between Metal Atoms Chapter 16
Fig. 16.44. The vibrational structure of the β ionization band in the PES of gaseous Mo2(O2CMe)4 (left) and a diagrammatic indication of how the Franck-Condon analysis is carried out (right).
The most recent and exciting development in the PES study of paddlewheel complexes concerns the M2(hpp)4 compounds with M = Cr, Mo and W, especially W2(hpp)4.310 There is abundant evidence that the hpp ligand has the greatest general ability of any ligand to stabilize high charges on M2n+ cores, for all metals. Conversely, this means that for M2(hpp)4 compounds the lowest ionization energies ( and least positive electrode potentials) should be found. This has its most extreme manifestation in the fact that the W2(hpp)4 molecule is the most easily oxidized molecule known: its β ionization has an onset value of 3.51 eV and a peak (vertical) value of 3.76 eV. Even the cesium atom is not this easily ionized (IP = 3.89 eV). There is a filled-filled interaction between the W24+ β orbital and a symmetry-appropriate combination of hpp- / orbitals that makes a key contribution to the high position of the HOMO of W2(hpp)4.
Fig. 16.45. The (He (I) PES of W2(hpp)4, supplied by Prof. D. L. Lichtenberger (University of Arizona).

Physical, Spectroscopic and Theoretical Results 771
Cotton
Photoelectron spectroscopy has also been able to address the question of how strongly M–M μ bonding is sacrificed when M2(O2CCH3)4 compounds of Mo and W are converted to the M2(O2CCH3)4(CH2CMe3)2 compounds.304,311
Finally, we note that the paddlewheel compounds of the 6-methyl-2-oxopyridine (mhp-) ligand provide a unique set, ranging over CrCr, CrMo, MoMo, MoW and WW cores. There have been several studies of some302,312 or all313 of them. Some of the results of the study covering them all are shown in Fig. 16.46. In all compounds, (with the possible exception of the Cr2 compound) it seems clear that the lowest peak is due solely to the β ionization. As the MM' unit changes through the series from CrCr to WW, this peak moves to lower energy and increases in relative intensity, both of which are expected for ionization from an MO of essentially pure metal character.
Fig. 16.46. The PES (He I) for five MM'(mhp)4 compounds.
Unfortunately, the flexibility in the choice of MM' is countered, insofar as the overall value of these studies is concerned, by the fact that the ligand has a strong band that comes right where the / or / + μ band is expected. The first ionization of Hmhp occurs at 8.81 eV and the partial negative charge remaining on the coordinated hmp- ion causes a shift to lower energy, viz. to c. 7.7 eV.

772Multiple Bonds Between Metal Atoms Chapter 16
16.5.2 Other tetragonal molecules
Informative PES results have been obtained314,315 for volatile M2X4(PMe3)4 molecules. The comparison between the spectra for molecules with M = Mo, W, and Re gives insight into the consequences of relativistic effects (both energy shifts and spin-orbit coupling) and of the filling of the β* orbitals (for the Re compound). Some of the pertinent results are displayed in Figs. 16.47 and 16.48. In the spectra of all three compounds there is a band at 8.42 ± 0.07 eV that is assigned to phosphorus lone pairs.
Fig. 16.47. The PES (He I) of (A) Mo2Cl4(PMe3)4, and (B) W2Cl4(PMe3)4.
Fig 16.48. The PES (He I) of the W2Cl4(PMe3)4 (upper) and Re2Cl4(PMe3)4 (lower) molecules.

Physical, Spectroscopic and Theoretical Results 773
Cotton
For the Mo and W compounds, one important result is that the β ionization (the lowest one in each case) is significantly easier (by c. 0.6 eV) for the tungsten compound, in keeping with the well-known fact that W–W quadruple bonds are far more easily oxidized than Mo–Mo quadruple bonds. The / ionization is also easier for the W than for the Mo compound (7.05/7.45 eV versus 7.70 eV). The splitting of the / ionization band in the tungsten case, by c. 0.4 eV, has been attributed to spin-orbit coupling. However, when the results for the rhenium compound became available, they prompted a reconsideration of this assignment, and it was proposed instead that the broad band at 7.05 eV contains both components of the spin-orbit split / ionization and the band at 7.45 eV is due to the μ ionization. A similar assignment has been proposed for the PES of MoWCl4(PMe3)4.316 In the Re compound the μ and / ionizations are assigned at 8.83 eV and c. 7.93 eV. The latter band is broad and can be deconvoluted into two spin-orbit components at 7.78 and 8.09 eV. The Re compound also displays a β* ionization, as expected.
16.5.3 M2X6 molecules
Only those of Mo and W have been studied although a few Ru2R6 species exist. The PES spectra of the Mo and W compounds171,172,317 have provided very good evidence for the μ2/4 triple bonds and detailed information about them. The Mo2(OCH2CMe3)6 molecule, whose PES is shown in Fig 16.49 provides an excellent example. Theory predicts that the HOMO should be the Mo–Mo / bonding orbital with the μ orbital lying about 0.9 eV below it, and then a gap of about 1.5 eV to the next levels, which are essentially pure oxygen lone-pair orbitals. Clearly, the observed spectrum agrees very well with this.
There is, in fact, virtually quantitative agreement between the observed and calculated PES for the Mo2(OR)6 systems. The actual ionization energies, with due allowance for relaxation, as well as relative intensities, were calculated for Mo2(OH)6, and reasonable line-shape functions were applied to the resulting line diagram, with the results shown by the smooth lower curve in Fig. 16.49. The calculated spacing between the first two peaks is slightly (0.2 eV) too large and the relative intensity of the first one is apparently slightly overestimated, but the agreement with the measured spectrum is remarkably good. The apparent discrepancy for the large peak covering the oxygen lone-pair ionizations is actually not an error. Because the calculation is for OH groups while the measurement is for OCH2C(CH3)3 groups, the disagreement of c. 0.90 eV is in the right direction and of about the magnitude to be expected empirically for the greater inductive effect of the neopentyl group compared to a hydrogen atom.
In a recent detailed study317 of the μ and / region for the three Mo2(OR)6 compounds with R = CHMe2, CH2CMe3, and CMe3, these three spectra have been shown to be very similar, with peak separations in the range 0.62-1.01 eV. For W2(OCMe3)6 the separation was significantly greater, namely 1.52 eV.
For Mo2(NMe2)6 and Mo2(CH2SiMe3)6 the measured PE spectra also agree well with those computed for the simplified models, Mo2(NH2)6 and Mo2(CH3)6. The pattern of μ2/4 bonding in these molecules is unambiguously supported.

774Multiple Bonds Between Metal Atoms Chapter 16
Fig. 16.49. Upper curve: Observed PES (He I) of Mo2(OCH2CMe3)6. Lower curve and bars: calculated PES (by SCF-X_-SW method) for Mo2(OH)6. Energies are photoionization energies.
16.5.4 Miscellaneous other PES results
The only Rh2(O2CR)4 compound that can be vaporized without decomposition is that with R = CF3, and a combined PES and theoretical study has been reported for this molecule.318 The fourteen metal-based electrons are predicted by DFT calculations to occupy the Rh–Rh bonding orbitals in the following order of increasing energy: μ2/4β2β*2/*4. The PES (both He(I) and He(II)) supports this, with the /* (9.55 eV) and β* (9.77 eV) ionizations being so close that their vibrational spreads overlap. The β (10.61 eV) and then the overlapping μ and / (11.08 eV) ionizations follow. This same paper also gives more information on the PES of
Mo2(O2CCF3)4.
Other dirhodium compounds, namely Rh2(mhp)4,319 Rh2(DTolF)4,166 and Rh2(DTolF)2(O2CCF3)2166 have also been studied. In these cases, the spectra have been assigned to a μ2/4β2/*4β*2 configuration, with the β*-/*-β spacings being c. 0.85 and 0.75 eV, respectively. In the case of the Rh2(DTolF)4 compound, discrete variational-X_ calculations show how the change from a carboxyl to an amidinate ligand causes a large increase in the /* to β* separation, namely from c. 0 eV to about 1 eV.
Ru2 compounds.
The PE spectra of Ru2(O2CCF3)4 and Ru2(O2CCF3)4(NO)2 have been recorded and the assignment discussed.320,321 With regard to the former, the observed spectrum was assignable to either a μ2/4β2β*2/*2 or a μ2/4β2/*3β* configuration. A preference for the former was expressed on the basis of some MO calculations. The result of strongly attaching NO groups at each end is that the μ-orbital is so much raised in energy that a μ ionization is responsible for the lowest energy band in the PE spectrum of Ru2(O2CCF3)4(NO)2.

Physical, Spectroscopic and Theoretical Results 775
Cotton
The PE spectrum of Ru2(mhp)4 was reported and assigned in accordance with a μ2/4β2/*3β* configuration.322 However, there was no convincing basis for this and the spectrum can be at least as well explained by a μ2/4β2β*2/*2 configuration, for which there is other evidence.
M2(C3H5)4 molecules.
M2(C3H5)4 molecules, with M = Cr or Mo, have been studied by two groups301,323 only one of which has presented the results in detail. Because of the low symmetry of these molecules (only a mirror plane perpendicular to the M–M bond) and the lack of any MO calculations, interpretation is at best tentative. In each case, there is a weak low-energy peak (6.90 eV for Cr and 6.72 eV for Mo) that can be assigned to β ionization with reasonable certainty. Beyond this there are many peaks at higher energies, most of which are due to ligand-based orbitals. The intensity changes from He(I) to He(II) spectra indicate that the M–M / ionizations are probably in the region of 7.89 eV.
The Re2(C3H5)4 molecule constitutes a quite separate case since its structure is very different from those of the group 6 M2(C3H5)4 molecules. Re2(C3H5)4 has D2d symmetry and a combined MO study (by SCF-X_-SW, including relativistic corrections but no spin-orbit coupling) and PES study has been reported.179 The observed spectrum could be satisfactorily assigned with the β* and β ionizations being the lowest metal-based ones, as expected.
16.6 Vibrational Spectra
We shall discuss here only tetragonal systems (e.g., M2X8n-, M2(O2CR)4, M2X4L4, etc.). There have been only a few efforts to do full vibrational analyses, whereby accurate force constants and realistic descriptions of the normal modes could be obtained. Some early attempts were a bit sketchy324-326 but more thorough work has been done on the four [Re2X8]2- (X = F, Cl, Br, I) ions, the [Tc2X8]n- ( X = Cl, Br and n = 2, 3) ions, and the [Os2X8]2- (X = Cl, Br, I) ions.327 Significant amounts of mixing of other totally symmetric modes (ιM-X and βMMX) into the normal mode generally labeled ιM-M were found. In the cases of Mo2(O2CCH3)4328 and the [Mo2(SO4)4]n- species329 it has been found that the frequency shifts resulting from 92Mo for 95Mo substitution support the assumption that the “Mo–Mo stretch” is reasonably pure. On the other hand, there are cases (vide infra) in which this normal mode entails significant mixing of other internal coordinates.
There are a great many data scattered through the literature; many were simply noted in passing as part of studies having others purposes. No claim is made here to have vacuumed the literature for all reported vibrational data. Major emphasis is placed on the normal mode that can be called, with varying degrees of rigor, the metal-metal stretching mode, ι(M-M), in both the ground electronic state, 1A1g (β2), and the 1A2u (ββ*) excited state, but in most cases the extent of coupling is assumed (or known) to be small.
16.6.1 M–M stretching vibrations
The first vibrational studies324,330 of L4MML4 compounds were published in 1971; the data were derived only from conventional Raman spectra and infrared spectra. In 1973 it was first observed that impressive resonance Raman (RR) effects could be obtained331 and this has since been widely exploited and with very telling effect by R. J. H. Clark and co-workers.332
The most thoroughly studied feature of the vibrational spectra of the L4MML4 systems is the Raman band attributed to metal-metal stretching. This totally symmetric vibration, ι(M–M), is active only in the Raman spectrum for the homonuclear molecules and is especially susceptible to resonance enhancement when excitation occurs in the βΑβ* band of the visible spectrum. Other electronic bands that produce excited states in which the M–M distance is

776Multiple Bonds Between Metal Atoms Chapter 16
appreciably changed have also been used for resonance enhancement of ι(M–M) and in certain cases transitions that involve excitation into M–L antibonding orbitals have been observed to give resonance enhancement to the totally symmetric M–L stretching mode, ι(M–L), as discussed in Section 16.6.2.
Resonance Raman (RR) spectra have been employed in two ways. One is to obtain greater intensity for the relevant totally symmetric vibration as well as many of its overtones and combination bands. An early and excellent example333 of this is shown in Fig. 16.50. From the frequencies of so many overtones the anharmonicity constant for ι(M–M) can be accurately determined and this, in turn, allows estimation of the M–M bond dissociation energy by means of a Birge-Sponer extrapolation, as already mentioned in Section 16.2.2.
Fig. 16.50. Resonance Raman spectra of two compounds containing the [Mo2Cl8]4- ion, recorded with a 514.5 nm exciting line.
On the other hand, it is possible to use the dependence of the RR effect upon the frequency of the exciting line to provide evidence for assignments in the electronic spectrum. This entails the measurement of the excitation profile of a particular Raman line, as for example the ι(M–M) line. Such a profile is shown in Fig. 16.51 for [Re2F8]2-. It can be seen that the excitation profile corresponds closely to the shape and position of an absorption band in the electronic spectrum, which shows that the electronic transition responsible for the absorption band must entail an excited state in which the M–M distance is changed. This provides a criterion of correctness that any proposed assignment of that band must satisfy. In the case shown, the RR evidence supports the β2Αββ* assignment.
In the unique case334 of MoWCl4(PMe3)4 the metal–metal stretch, ι(Mo–W), has been seen in the infrared as a band of medium intensity at a frequency of 326 cm-1 in as well as in the Raman at 322 cm-1.
Especially thorough studies335,336 have been made of the M2X4L4 compounds in which M = Mo or W, X = Cl, Br, I, and L = and R3P or R3As ligands. For the series Mo2X4(PMe3)4 with X = Cl, Br and I, the ι(Mo–Mo) frequencies are nearly invariant, viz., 355, 352 and 342 cm-1, respectively. A normal coordinate analysis of Mo2Cl4(PMe3)4 showed that the vibration at 355 cm-1 is 86% localized in the Mo–Mo bond.