

Metal-Catalysed Reactions of Hydrocarbons / 07-Hydrogenation of Alkenes and Related Processes
.pdfHYDROGENATION OF ALKENES AND RELATED PROCESSES |
301 |
TABLE 7.4. Temperature-Dependence of Orders of Reaction for Ethene Hydrogenation on a Platinum Catalyst (0.04 % Pt/ Cab-O-Sil)38
r PH x PE y
T/K |
x a |
yb |
223 |
0.48 |
−0.17 |
273 |
0.67 |
−0.17 |
336 |
1.10 |
−0.43 |
a |
= 25 Torr |
|
b PE |
|
|
PH = 150 Torr |
|
|
hydrogen becoming less positive and that of ethene less negative with falling temperature. These are important factors to be accommodated by the reaction model, but they may be specific to platinum, because for various silica-supported metals the orders in ethene, being necessarily measured at various temperatures, tend to more negative values the lower the temperature.51 Orders in hydrogen however show no such systematic trend (see Tables 7.2 and 7.3).
The limited value of expressing the rate dependence in a reactant pressure as a simple exponent in Power Rate Law formalism has been noted before (Section 5.2) and will doubtless be mentioned again. The concept of an ‘order of reaction’ has been borrowed from homogeneous gas-phase kinetics, where integral and semi-integral orders are the norm, and only with complex reactions such as those proceeding by chains is this mode of expression inadequate. It is however optimistic to think that a single ‘order’ can describe the behaviour of a reaction over any significant range of conditions: at best it is an approximation to a more meaningful expression relating rate to the concentration of reacting entities. Ethene hydrogenation provides several convincing examples of the limitations of the ‘order’ paradigm: (i) ‘orders’ in both reactants are temperature-sensitive and (ii) the ‘order’ in ethene on Pt/SiO382 at 273 K is negative below about 50 Torr pressure, but accurately zero above this pressure. Furthermore the Arrhenius equation is not always fully obeyed; activation energy will be pressure-dependent if reaction orders are temperature-sensitive. On fresh Pt/SiO2 there appear to be two different states of activity, having different activation energies, and between which it is possible to move reversibly by changing temperature; carbon deposition removes this effect, however.39 Multiple steady states are reported53 under isothermal conditions on rhodium film simply by altering reactant concentrations, but no details have been given. There have also been many reports of activation energy decreasing40 and ultimately becoming negative2 as temperature is raised; this has been reasonably attributed on the onset of ethene desorption, in support of which is the movement of ethene order to higher (i.e. more positive) values.2
This then summarises the kinetic framework within which mechanistic discussion has to be conducted (Section 7.2.6), but much other relevant information

302 |
CHAPTER 7 |
has to be collected before this can be done; a preliminary consideration of certain features is however in order. The high positive orders in hydrogen carry the implication that there is much scope for further increase of rate if yet higher pressures were used, and hence that the concentration of reacting centres is quite small. First order in hydrogen tells us that a molecule, or probably two atoms, appear in the rate-determining step, most probably indirectly through an ethyl radical: therefore as a working hypothesis for a typical catalyst we may imagine the equilibrium
+ |
2 |
|
2 |
2 |
––CH |
3 |
+ |
2 |
(7.E) |
H |
H |
C––CH |
|
CH |
|
|
lying far to the right, but since ethene is so much more strongly adsorbed than hydrogen the surface layer will usually comprise mainly ethene and ethyl radicals (Figure 7.4). Orders in hydrogen greater than first are not easily explained. There has been much discussion as to whether the adsorption of the reactants is competitive for the same sites, or non-competitive if there are sites that only hydrogen can use:28 an early proposal52,54 was that both can operate at the same time. Negative orders in ethene suggest competition, but zero orders do not require it.
The general near-constancy of activation energy at about 35 kJ mol−1 may lead us to think that this is a true and not an apparent quantity, because there is no evidence that it depends on reactant pressures40 (although this can be inferred) or on dispersion.55 There is of course no reason for its value to be always exactly the same, as minor differences may be caused by variations in surface cleanliness etc; much higher values (in the region of 60–90 kJ mol−1, see Tables 7.2 and 7.3) do however require special thought. True activation energies are associated with constancy of surface coverage, and they are normally higher than apparent values (Section 5.25): we must therefore suppose that (i) the rate-determining step is the
Figure 7.4. Schematic variation of surface coverages by ethene, ethyl and hydrogen atoms as a function of hydrogen pressure/ethene pressure ( PH / PA ). The likely range of coverage of various metals for PH / PA = 1 is within the shaded area.

HYDROGENATION OF ALKENES AND RELATED PROCESSES |
303 |
same for all catalysts showing an activation energy of 30–50 kJ mol−1; and (ii) within the usual range of measurement, increase of temperature does not so effect the concentration of adsorbed reactants that the rate is thereby depressed, and so there is maximum utilisation of surface throughout.
An interesting application of ethene hydrogenation is its use to estimate the number of pre-adsorbed hydrogen atoms by passing ethene over the catalyst in either a continuous56 or a pulse mode,57 and measuring the ethane produced. The method has been applied to a number of supported platinum catalysts, and gives good agreement with other methods (e.g. hydrogen–oxygen titration), providing sulfur is absent (see also Section 3.31). The procedure was first described using 1-pentene58 (see Section 7.4).
Dr Samuel Johnson remarked of a dog walking on its hind legs, it is not surprising it is done badly; it is surprising it is done at all. The same may be said of the hydrogenation of alkenes by the metals of Group 11. Ag/SiO2 and Ag/TiO2 catalysts activated by oxidation and reduction were active59 for the hydrogenation of ethene and of propene between 313 and 413 K, with activation energies of about 40 kJ mol−1. For the reaction of ethene with deuterium on Au/SiO2, see Section 7.24; for the hydrogenation of 1-pentene on gold catalysts, see Section 7.4.
7.2.2. Structure Sensitivity50
The hydrogenation of alkenes has long been recognised as being ‘structureinsensitive’,45 by which is meant rates per exposed metal atom (i.e. TOFs) are essentially independent of particle size, the number of such atoms being estimated before reaction, and usually by hydrogen chemisorption. The general truth of this view is not in doubt, but it is necessary to test its veracity and to examine apparent exceptions.
The observation that specific (areal) rates of ethene hydrogenation on platinum catalysts of very different dispersion when measured under fixed conditions are closely similar38,55 would seem to imply that every surface atom or site capable of adsorbing a hydrogen atom, or a constant fraction thereof, provides an ‘active centre’ of about the same activity. The logic of this conclusion rests upon the near equivalence sometimes observed between the number of surface atoms estimated
(i) by physical techniques and (ii) by hydrogen chemisorption using a 1:1 H/Pts stoichiometry, the limitations of which have already been discussed (Section 3.3.1). All surface atoms, whatever their co-ordination number, are equally capable of being or participating in an ‘active centre’, and so this reaction obeys one of Taylor’s limiting conditions that nearly all surface atoms are active.60 It is not only specific rates that show this uniformity; in many cases activation energies also fall within a narrow range (Tables 7.2 and 7.3). There are however alternative explanations of this apparent insensitivity to particle size38,55 and surface structure.61 It is common

304 |
CHAPTER 7 |
experience that metal surfaces rapidly become partly covered by ‘carbonaceous deposits’,38,41,62 and that rates measured under steady state conditions therefore utilise only a fraction of the total surface. It is therefore hypothesised that these deposits occupy the more reactive areas and that reaction occurs only on those remaining sites, uniform in character, on which ethene is adsorbed weakly and reversibly.62 It is not however obvious that such ‘active centres’ should be the fixed fraction of the total, as is implied by correlating the number of surface sites before reaction with the rate during reaction.
We should now examine some studies that apply shades of grey to the black and white picture painted above. A number of careful examinations of particle size effects have been made using ‘model’ catalysts prepared by depositing metal atoms from the vapour phase onto oxide supports. With both Pt/SiO632 ,64 and Pt/A12O3,65 rates at 373 K using a 10:1 hydrogen:ethene ratio show maxima at a size of about 0.6 nm; they then decrease three-fold to reach values which above about 1.7 nm are independent of size. The rates are however at least a factor of 10 less than expected at 373 K on the basis of results49 for other forms of platinum. Ni/SiO2 shows similar behaviour, but lower rates at sizes below 0.6 nm were seen only with the platinum catalysts.66 These papers deserve to be consulted for their extended erudite discussion of the possible geometric basis of catalytic activity, but there is no recording of kinetic parameters or of carbon deposition, and it cannot be assumed that the observed rates refer to equal coverages by reactants: and remembering that the size of a single platinum atom is about 0.28 nm, the significance of particle sizes less than 0.6 nm is not quite clear. No variation in activity has been found using palladium particles between 1 and 3 nm size.67 R. L. Moss and his associates55 have made detailed observations on Pt/SiO2 catalysts containing 1.2 to 11.5% metal, having mean particle sizes between 3 and 6 nm; rates at 193 K varied erratically with size within a factor of four, but Arrhenius plots showed distinct (but again irrational) variations of activation energy with metal loading, and exhibited compensation (Figure 7.5). If as has been suggested above the activation energies reported for this reaction are ‘true’ values, such variation is not to be expected, but it is clearly beyond experimental error. There are two possible explanations: either (i) each is a ‘true’ value, being slightly influenced by other variable factors than size, e.g. by contaminants, or (ii) they are not quite ‘true’ values, because surface coverages are not equivalent. In the absence of further information such as reaction orders, these possibilities cannot be distinguished. The fact40 that activation energy is dependent of ethene pressure on Ni/SiO2-A12O3 does not help, as each case is sui generis, and must be considered separately.
There are some indications of particle size dependence with propene hydrogenation:35 with Pt/SiO2, rates at 220 K increased less than two-fold as dispersion rose from 5 to 80%, but they also depended on the type of pre-treatment applied.68,69 With Pd/SiO2,70 rates passed through a maximum at about 60%

HYDROGENATION OF ALKENES AND RELATED PROCESSES |
305 |
Figure 7.5. Compensation plot of Arrhenius parameters for ethene hydrogenation on Pt/SiO2 reduced at either 483 K (O) or 353 K ( ).55
dispersion, and again varied with pre-treatment the difference between the two metals found no ready explanation, and the absence of kinetic measurements (and of hydrogen dissolved in the palladium catalysts) did not help. TOF values for Ni/A12O3 catalysts increased with increasing dispersion.71
There is limited information available on structure dependence of rates shown by unsupported metals. TOFs have been reported for ethene hydrogenation on low Miller index faces of nickel, the (100) face being quite inactive, perhaps due to ‘carbon’ deposition.36 Step-density on platinum single crystals does not determine activity for this reaction, but does affect its hydrogenolysis.61 Surface defects introduced into nickel and platinum by argon ion bombardment when removed by annealing caused respectively 100and 10-fold decreases in activity.72 Hydrogendeuterium equilibrium was not however affected. Most interestingly, nickel powder having the abnormal cph structure has been prepared by decomposition of the acetylacetonate, and at 313 K showed a rate (4.1 mol m−2 h−1) for propene hydrogenation that was ten times larger than that shown by the usual fcc form.73 Nickel boride showed very low activity. Linear nickel ‘nanostructures’ prepared by photolithography showed a maximal rate for ethene hydrogenation at a size of 4 nm.74
To conclude, it is evident that there are a number of loose ends that need to be tidied up before the last word on the structure sensitivity of ethene hydrogenation can be written. It is worth noting that many studies use a large excess of hydrogen and a low pressure of ethene,55,59,64,66 which may bring the reaction into the region of positive order in ethene (Figure 7.4). It has to be continually stressed that valid comparisons of activity can only be made when the concentrations of reacting species are about the same, a condition that is by no means always met.

306 |
CHAPTER 7 |
7.2.3. Ethene Hydrogenation on Bimetallic Catalysts75,76
The hydrogenation of ethene was used in a number of laboratories between about 1950 and 1980 to assess the importance of the electronic theory in heterogeneous catalysis. Unfortunately, as we now know, this work was motivated by the concept of d-band filling by electron-rich metals that is incorrect (Section 1.32). Moreover, the existence of a miscibility gap in the nickel-copper system, which was particularly selected for study, was not always appreciated, and in many cases the composition of the surface, and its degree of contamination by carbonaceous deposits, were unknown quantities. In some of the work, great pains were taken to try to obtain homogeneous bimetallic films,77−79 but X-ray diffraction, often used as the criterion, does not of course disclose the surface composition, which in any case may be altered by the presence of the reactants. In view of these and many other areas of uncertainty, it is not surprising that results from different laboratories were lacking in consistency. We must therefore regretfully review this work only briefly, as it does not add much to our understanding of mechanisms: we shall however find some additional support for the structure-insensitive nature of the reaction.
The bimetallic systems used fall into four classes:
(i)Group 8, 9 or 10 + Group 11 or 14 or RE metal (e.g. Ni-Cu;2,78−89 NiAu;79 Pd-Cu;2,82 Pd-Ag;2 Pd-Au;75 Ru-Cu;90 Ni-Sn and Pd-Sn;91 Pt-Sn;92 Pt-Cu;2,82 Pd-Eu and Pd-Yb93).
(ii)Group 10 (or 9 +10) metals (e.g. Ni-Pd;77,86,94 Pd-Pt95).
(iii)Group 11 metals or Group 11 + RE metal (e.g. Cu-Ag;2 Ag-Yb96).
(iv)Intermetallic compounds.97
In the work of Rien¨acker and his associates, using metal foils, rates were often only slightly affected by adding copper or silver to a Group 10 metal, although activation energies changed, and exhibited compensation; the Arrhenius parameters describing the much lower rates found for materials rich in the Group 11 metals fell on a quite separate line, perhaps due to a step change in the concentration of active centres.2 With nickel-copper films, rates usually increased with nickel content, in one case the activation energy falling from 50 to 34 kJ mol−1 at 80% nickel,88 but in another study they also rose as copper was added to nickel, so that there was a marked minimum in the centre of the series.78,79 Both studies showed approximate compensation between the Arrhenius parameters, as did values found using nickel-copper foils cleaned under UHV conditions;89 in one instance the value of the plot was proved by highlighting one questionable value that lay well off the line. With silica-supported nickel-tin and palladium-tin, the reduction of carbon deposition caused by the presence of tin did not overcome the loss of activity due to an electron shift, which was indicated by an increase in both the Ni 3d and Pd 4d binding energies. This confirms the observations made with metal-tin systems mentioned in Section 3.32. NMR work with Ru/SiO2 catalysts showed

HYDROGENATION OF ALKENES AND RELATED PROCESSES |
307 |
that adsorbed hydrogen exists in strong and weak states, the ratio Hw/Hs doubling as dispersion increases only from 20 to 30%: the weak form is associated with atoms of low co-ordination number, and these are the ones that are preferentially replaced when copper is introduced.90 The consequential decrease in activity for ethene hydrogenation is therefore caused by loss of this form. This adds a further factor to the matrix of problems that have to be resolved when trying to understand how the activities of bimetallic catalysts depend on structure and composition.
Results obtained with mixtures of Group 10 metals do not unfortunately provide information of great interest; they have already been reviewed in
depth.76,77,82,86,94
It is well known that bimetallic compounds of the type (RE)M5, where RE is a rare-earth element and M is either cobalt or nickel, absorb large amounts of hydrogen, so it is of interest to know whether it is able to hydrogenate alkenes. Compounds of this type not containing hydrogen catalysed ethene hydrogenation at 190 to 230 K at rates proportional to hydrogen pressure and independent of ethene pressure.97 The hydrides reacted quickly with ethene at 195 K, but rates varied 100-fold with composition, the LaNi5 compound being the most active: activation energies were within error constant at about 24 kJ mol−1, which was also that for hydrogen desorption, so diffusion of hydrogen atoms to the surface was the slow step. On reacting a mixture of hydrogen and ethene over a hydride, hydrogenation occurred without change of pressure until late in the reaction.97
7.2.4. Reactions of Ethene and of Propene with Deuterium13,98,99
This section is concerned with the reactions of ethene and of propene with deuterium on forms of metal catalyst other than single crystals, which are covered in the next section. A fuller discussion of reaction mechanisms is reserved to Section 7.2.6.
The revelation of the extensive but unsuspected processes occurring during alkene hydrogenation was mentioned in Section 5.7.2, and the principal observations were summarised in the introduction to this chapter. These may be developed as follows. An alkene exchange reaction by the addition of a deuterium atom to chemisorbed alkene and the later abstraction of a hydrogen atom (process 7.B) occurs to very different extents on various metals. It is for example very marked with nickel and palladium, and much less with platinum (see later). Now, if the liberated hydrogen atom is very quickly returned to the gas phase as a molecule of hydrogen deuteride, there will be seen a hydrogen exchange reaction: if the number of hydrogen atoms released then equates to the number of deuterium atoms appearing in the alkene, the mean number of deuterium atoms in the alkane will be exactly two. If however the hydrogen atoms are employed in the process of forming the alkane, the rate of the hydrogen exchange will be less than that of alkene exchange, and the alkane will necessarily contain less than two deuterium atoms. The characteristics of the reaction that are of chief interest are therefore the
308 |
CHAPTER 7 |
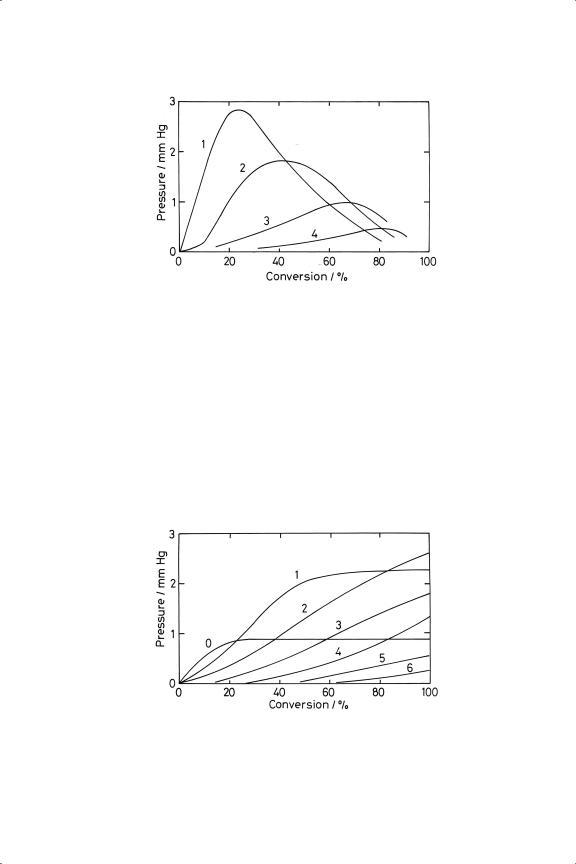
Figure 7.6. Reaction of ethene with deuterium on nickel wire at 363 K; variation of pressures of deuteroethenes with conversion.100 1 = C2 H3 D; 2 = C2 H2 D2 ; 3 = C2 HD3 ; 4 = C2 D4 .
rates of these exchange processes (and their dependence on operating conditions), the mean number of deuterium atoms entering the alkane, the breadth of the distribution of the deuteoralkanes, and the way in which it changes with conversion.
These features are best illustrated by reference to the reaction of ethene with deuterium on various nickel catalysts2,6,7,19,100,101 and on supported platinum catalysts.2,6,28,52,103 On nickel there was seen the stepwise formation of al the deuterated ethenes (Figure 7.6), in consequence of which (hydrogen exchange being minimal) the deuterium number of the ethane rose progressively: thus ethane-d0 was the major initial product, but all deuterated ethanes were seen, and the formation of ethane-d6 was more marked towards the end of the reaction, when most of the ethene was ethene-d4 (Figure 7.7). The stepwise character of the
Figure 7.7. Reaction of ethene with deuterium on nickel wire at 363 K; variation of pressures of deuteroethanes with conversion.100 0 = C2 H6 ; 1 = C2 H5 D; 2 = C2 H4 D2 ; 3 = C2 H3 D3 ; 4 = C2 H2 D4 ; 5 = C2 HD5 ; 6 = C2 D6 .

HYDROGENATION OF ALKENES AND RELATED PROCESSES |
309 |
ethene exchange implies a rapid desorption (and adsorption) of ethene molecules. The reaction over platinum shows quite different behaviour. Although the results were somewhat support-dependent,52,102 in general alkene exchange was slight when near-stoichiometric reactant ratios were used, and the deuteroethane distribution did not change much with conversion (Figure 7.8). Hydrogen exchange was more noticeable than with nickel, and there was evidently a less ready interchange between gaseous and adsorbed ethene. Even in the absence of detailed information on the extents of alkene and hydrogen exchange, it is possible to assess their importance by the value of the deuterium number of the alkane, and how it changes with conversion.
The form of the distribution of the deuteroalkanes merits further consideration. It was noticed that the amounts of species having more than one or two deuterium atoms declined logarithmically with increasing number of such atoms:52 the ratio of [alkane-dn+1]/[alkane-dn] (n > 2 or 3) is denoted by σ , and this relation holds, often with surprising accuracy, not only for ethanes and propanes,2,6 but also for higher alkanes (Sections 7.31 and 7.4), providing the concentration of the deuteroalkane falls within the range of precise measurement. Some examples of this behaviour are shown in Figure 7.9; values of σ are most usually between 0.4 and 0.6, and are often close to 0.5. A constant σ will arise is the ratio of the rates of alkyl reversal to alkene and of alkyl conversion to alkane is independent of deuterium content, and it has been argued that a value of 0.5 suggests that alkene and alkane are formed at the same time by disproportionation of two alkyl radicals. However, it is often the case that the amount of the alkane-d2 exceeds expectations,2,6,52 sometimes by a large amount (see Figure 7.9), and the difference between the observed and expected values (given by back-extrapolation of the logarithmic plot) is attributed to a ‘direct addition’ (DA) process that is independent of that giving the other products. It has been shown52 that experimental distributions are very well reproduced simply by selecting values for the two parameters σ and the amount of DA. Further attention to mechanism and the source of atoms in the formation of alkane will be given below (Section 7.2.6).
Before considering how operating conditions affect the progress of alkenedeuterium reactions, it is desirable to introduce an alternative and somewhat more profound way of interpreting product distributions.104 This proceeds by assigning probabilities to each of the four steps in process 7.B as in Scheme 7.1: here X stands for either H or D and the asterisk simply identifies the species that are adsorbed; the probabilities are assumed to be independent of the isotopic composition of the reacting species, and C––H and C––D bonds are supposed to have equal strengths. There are six possible adsorbed ethenes and twelve ethyls (including positional isomers), and one may then write eighteen simultaneous equations defining their concentrations in terms of p, q and r : the ethyl radical profile is then converted into an ethane distribution by the parameter s. This procedure actually affords more information than is available experimentally, as it says how much ethane-d0 is

310 |
CHAPTER 7 |
Figure 7.8. Histograms of deuteroethane distributions obtained on various Pt/SiO2 catalysts (A - E) and on Pt(111) (F) under the following conditions.
|
Wt.% Pt |
Da |
T/K |
PD / PE |
M |
% Conv. |
References |
A |
1 |
— |
273 |
1.1 |
1.93b ,1.89 |
45b ,100 |
52 |
B |
0.04 |
1.0 |
273 |
2 |
2.08 |
Low |
28 |
C |
2.4 |
0.3 |
263 |
1 |
1.85 |
Low |
48 |
D |
0.1 |
— |
293 |
1 |
1.90 |
15 |
102 |
E |
6.3 |
0.6 |
293 |
1 |
1.96 |
15 |
102 |
F |
— |
— |
333 |
2 |
1.57 |
— |
44 |
|
|
|
|
|
|
|
|
a D = dispersion. b Shaded columns.