

СЭГ Мира / 1 семестр / ПРАКТИКУМ СЭГ мира,часть 1 / ХРЕСТОМАТИЯ электронная / 08 CХ+УДОБРЕНИЯ / wsr
.pdfLand resource potential and constraints at regional and country levels |
3 |
Chapter 2
Soil constraints
METHODS
In order to translate soil characteristics into agronomic constraints, use was made of one of the best known methods, the fertility capability classification (FCC) (Sanchez et al., 1982). This characterizes soils by means of a set of fertility constraints, that is, inherent features which offer problems to soil management. The FCC criteria were linked with the mapping units of the Soil Map of the World by taxonomic transfer functions, algorithms based on statistical analysis of soil profiles belonging to each mapping unit (Batjes et al., 1997). For example, the indicator hydromorphy in the FCC is applied to all soil mapping units belonging to the classes of Fluvisols, Gleysols and Histosols, and to gleyic units in other soil groups. The correspondences between FCC criteria and soil classes are shown in Table 1.
TABLE 1
Correspondence between inherent soil constraints in the soil fertility capability classification (FCC) and soil classes of the Soil Map of the World
FCC soil constraints |
Major soil groups |
Soil units |
Hydromorphy |
Fluvisols, Gleysols, Histosols |
Gleyic |
Low cation exchange capacity |
Arenosols, Ferralsols |
|
|
provided sandy and not humic |
|
Aluminium toxicity |
Ferralsols and Acrisols |
Dystric Cambisols, Dystric |
|
that are not humic. |
Planosols, Dystric Gleysols |
High phosphorus fixation |
clayey Ferralsols and clayey |
|
|
Acrisols. |
|
Vertic properties |
Vertisols |
Vertic Cambisols, Vertic Luvisols |
Salinity |
Salt flats, Solonchaks |
Saline phases |
Sodicity |
Solonetz |
Sodic phases |
Shallowness |
Lithosols, Rendzinas, Rankers. |
|
Erosion risk |
|
Steep slopes; moderate slopes with |
|
|
contrasting topand subsoil texture. |
There are some substantial data limitations to the sources used. First, the reliability of some of the maps and data is known to be relatively low. The soil map of the world is based on information compiled more than 20 years ago, and more than half the survey coverage of developing countries is only at reconnaissance scales (Zinck, 1994). Secondly, the successive stages of reduction in scale, from local soil maps to the national level, and from the latter to the Soil Map of the World, necessitate a considerable degree of amalgamation of mapping units and simplification of boundaries. There may also have been some inconsistencies in converting national soil mapping units to the legend of the Soil Map of the World. At more than one scale of reduction, it may be necessary to use only the dominant soils of an soil association. Finally, each soil fertility constraint has to be assigned to the whole of a particular soil type, although the constraints will not be present over the entire area.
4 |
Soil constraints |
RESULTS: WORLD AND REGIONAL LEVEL
Eight inherent soil constraints are covered:
•Hydromorphy: poor soil drainage.
•Low cation exchange capacity: low capacity to retain added nutrients.
•Aluminium toxicity: strong acidity.
•High phosphorus fixation: a high level of ferric oxides in the clay fraction.
•Vertic properties: dark, expanding and contracting (‘cracking’) clays.
•Salinity and sodicity: presence of free soluble salts.
•Shallowness: rock or a rock-like horizon close to the soil surface.
•Erosion hazard: a high risk of soil erosion, caused by steep slopes, or moderate slopes in association with erosion-prone soils.
Further explanations, together with indications of the soil management problems associated with each constraint, are given in the results by countries below.
An important qualification to the interpretation of the results should be noted. All data reported on inherent soil constraints apply to the total areas of regions or countries, not to their arable land, nor agricultural land, only. Thus, for example, the areas shown as having erosion hazard and shallowness include mountainous regions in which little or no attempt at agricultural use is made.
The areas of major soil constraints are summarized by region in Table 2. Results are shown in thousands of square kilometres, and as percentages of the region affected by each constraint. The areas shown are partly overlapping, i.e. it is common for soils to be affected by more than one constraint.
TABLE 2
Area of major soil constraints by region
|
|
|
|
|
Soil Constraint |
|
|
|
|
|
Total area |
Hydromorphy |
Low cation |
Aluminium |
High phos- |
||||
|
|
|
|
exchange |
toxicity |
phorus |
|
||
|
(‘000) km2 |
(‘000) km2 |
|
capacity |
(‘000) km2 |
|
fixation |
|
|
|
% (‘000) km2 |
% |
% |
(‘000) km2 |
% |
||||
Sub-Saharan Africa |
23755 |
1903 |
8 |
3716 |
16 |
4371 |
18 |
1009 |
4 |
North Africa and Near East |
12379 |
79 |
1 |
292 |
2 |
1 |
0 |
0 |
0 |
Asia and Pacific |
28989 |
3083 |
11 |
1105 |
4 |
3906 |
14 |
1395 |
5 |
North Asia, east of Urals |
21033 |
5702 |
27 |
11 |
0 |
783 |
4 |
0 |
0 |
South and Central America |
20498 |
2086 |
10 |
982 |
5 |
8019 |
39 |
3016 |
15 |
North America |
21410 |
3388 |
16 |
0 |
0 |
2219 |
10 |
1 |
0 |
Europe |
6843 |
1142 |
17 |
44 |
1 |
569 |
8 |
0 |
0 |
World |
134907 |
17382 |
13 |
6151 |
5 |
19867 |
15 |
5421 |
4 |
|
|
|
|
Soil Constraint |
|
|
|
||
|
Total Area |
Vertic |
Salinity and |
Shallowness |
Erosion |
||||
|
(‘000) km2 |
properties |
sodicity |
(‘000) km2 |
|
hazard |
|||
|
(‘000) km2 |
% |
(‘000) km2 |
% |
% |
(‘000) km2 |
% |
||
Sub-Saharan Africa |
23755 |
1072 |
5 |
884 |
4 |
3007 |
13 |
3627 |
15 |
North Africa and Near East |
12379 |
69 |
1 |
780 |
6 |
2854 |
23 |
1185 |
10 |
Asia and Pacific |
28989 |
1455 |
5 |
3043 |
11 |
4892 |
17 |
4655 |
16 |
North Asia, east of Urals |
21033 |
0 |
0 |
2137 |
10 |
2796 |
13 |
3349 |
16 |
South and Central America |
20498 |
439 |
2 |
1115 |
5 |
2313 |
11 |
3923 |
19 |
North America |
21410 |
106 |
1 |
191 |
1 |
2491 |
12 |
3851 |
18 |
Europe |
6843 |
87 |
1 |
219 |
3 |
780 |
12 |
1386 |
20 |
World |
134907 |
3228 |
2 |
8369 |
6 |
19133 |
14 |
21975 |
16 |
For definitions of regions, see Appendix 1.
For the world’s land area as a whole, there are four major constraints, each occupying 1316% of the global area. In order of extent, these are: erosion hazard, aluminium toxicity,
Land resource potential and constraints at regional and country levels |
5 |
shallowness, and hydromorphy. Four other constraints each cover 2-6% of the area: salinity and sodicity, low cation exchange capacity, high phosphorus fixation, and vertic properties.
On a regional scale, erosion hazard and shallowness are extensive in all seven regions. In addition, the dominant regional constraints are as follows:
Sub-Saharan Africa |
Aluminium toxicity, low cation exchange capacity |
North Africa and Near East |
Salinity and sodicity |
Asia and the Pacific |
Aluminium toxicity, hydromorphy, salinity and sodicity |
North Asia, east of Urals |
Hydromorphy, salinity and sodicity |
South and Central America |
Aluminium toxicity, high phosphorus fixation,hydromorphy |
North America |
Hydromorphy, aluminium toxicity |
Europe |
Hydromorphy |
At the broad regional scale, these results are in accordance with field experience.
RESULTS: COUNTRY LEVEL
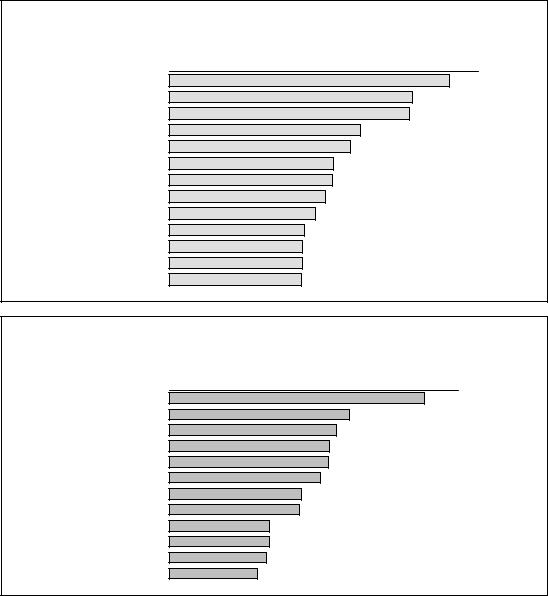
Country-level results are given in full in Appendix 2, Tables A2a-A2g. The country results can be grouped according to the absolute or relative extent of each soil constraint. Such analysis can be used for preliminary assessment of potential development strategies, or potential for soil management technology transfer (Nachtergaele and Brinkman, 1996). Countries having the greatest relative extent of each constraint, as percentages of their total land areas, are shown in Figures 1-8.
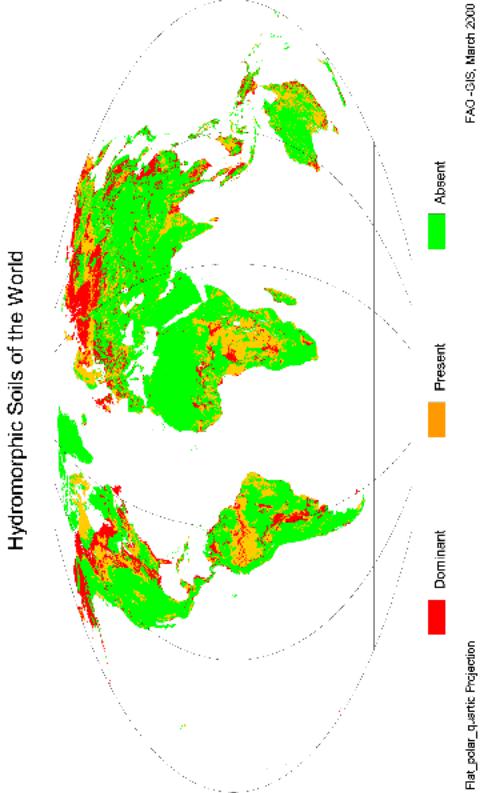
Hydromorphy (poor soil drainage)
Hydromorphy, wetness in the soil profile for all or part of the year, is governed mainly by physiography. Such land is generally flat and low-lying with respect to the surrounding land. Common environmental situations, each presenting distinctive management problems, include alluvial and coastal plains, deltas, and river valleys, the latter including the distinctive valleyfloors of the savanna zone, known in Africa by local names such as dambo, mbuga or fadama. Peat bogs are also extensive, mainly but not exclusively in the temperate and sub-polar zones, including on elevated plateaux under high rainfall.
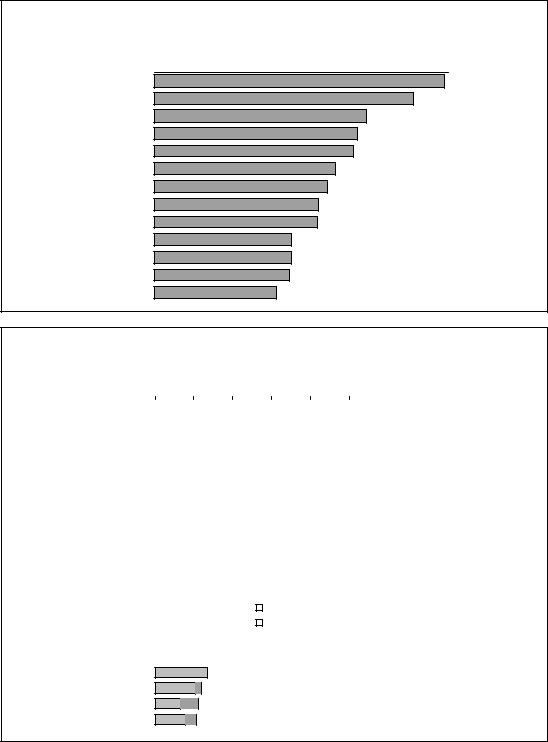
Some 20 countries have a substantial proportion (>25%) of their land affected by hydromorphic constraints, with the highest proportions (>50%) in the Falklands, the United Kingdom, and Bangladesh. In the case of Bangladesh, lying mainly in the deltaic zone of the Ganges, this would be expected. For the United Kingdom it comes as a surprise; the cause is a combination of peat moors, fenlands and clay vales, coupled with the high degree of generalization necessary in reducing the national soil map to the scale of the Soil Map of the World.
When under agricultural management, hydromorphic soils are often used for rice production in the tropics, and permanent grassland in the temperate zone. The dambo valley floors present a complex challenge to management, with alternative uses of seasonal grazing, rice or vegetables; under grazing, there is a serious danger of degradation from erosion and lowering of the water table (Koohafkan et al., 1997; Young, 1998). Wetlands are also highly valued as wildlife reserves, their drainage being restricted by law in some countries. A fundamental challenge is to harmonize agricultural sector policies with environmental considerations, in order to balance the different uses of wetlands, and to establish ecologically sound management practices.
Land resource potential and constraints at regional and country levels |
7 |
FIGURE 1
Countries most affected by soil constraints: hydromorphy
0 |
10 |
20 |
30 |
40 |
50 |
60 |
70 |
Falklands
United Kingdom
Bangladesh
Luxembourg
Republic of Ireland
Cambodia
Belarus
Finland
Estonia
The Netherlands
Latvia
Congo Republic
Brunei
FIGURE 2
Countries most affected by soil constraints: low cation exchange capacity
0 |
10 |
20 |
30 |
40 |
50 |
Botswana
Angola
Congo Republic
Niger
Senegal
Congo Democratic Republic
Zambia
Namibia
Central African Republic
Mozambique
Kuwait
Chad
Low cation exchange capacity (low inherent fertility)
Soils with a low cation exchange capacity (CEC) have topsoils with a low organic matter content, a low clay content, clay minerals with low CEC per gramme of clay, or all these properties. As such, these soils have a low inherent fertility and also a low capacity to retain nutrients added as fertilizer. For the most part, these are highly sandy soils (Arenosols).
Twelve countries, eleven of them in Africa, have more than 15% of their land affected by this constraint. Five of these twelve (Botswana, Niger, Namibia, Kuwait and Chad) lie in the semi-arid or arid zones. The others extend into subhumid or even humid regions, but have extensive areas of sandy or highly-weathered soils.
The low nutrient reserves, often accompanied by a low organic matter content and low soil moisture storage capacity, call for the relatively high inputs if these soils are expected to produce at other than low yield levels. However, owing to the low nutrient retention capacity, the addition
8 |
Soil constraints |
of fertilizers may not be economic. If ways can be found to raise the soil organic matter content (e.g. through agroforestry or green manuring), then fertilizer use efficiency can be improved.
Aluminium toxicity
These are soils in which the exchange complex is dominated by alumina. This is associated with a soil reaction of pH <5.5, often <5.0, and although technically less correct, the problem is commonly described as one of strongly acid soils. The main cause is strong leaching resulting from high rainfall.
This is predominantly a problem of the humid tropics, although found also in the subhumid tropics and in a few temperate-zone countries with areas of high rainfall, e.g. New Zealand. It affects some 8 M km2 in South America and 4 M km2 in both Africa and Asia (mainly SouthEast Asia). The eight countries most affected lie largely or entirely in the rain forest zone, and many of the remainder in Figure 3 possess substantial areas of rain forest. About a third of the 160 countries covered by this study have more than 25% of their territory affected by aluminium toxicity.
Although some crops (e.g. pineapple, tea) are tolerant of high levels of exchangeable aluminium, for most crops it is a serious constraint. This is one reason why the traditional subsistence agriculture of these regions is sometimes based on root crops (e.g. cassava, yams) rather than cereals. For most crops and cultivars, fertilizer response will be poor so long as the soil reaction remains strongly acid. Liming is a technically feasible solution, but at the high levels of lime required, this may not be economic, particularly because of high transport costs in countries which lack local supplies of lime.
FIGURE 3
Countries most affected by soil constraints:aluminium toxicity
0 |
20 |
40 |
60 |
80 |
French Guyana
Liberia
Malaysia
Congo Democratic Republic
Ivory Coast
Cameroon
Venezuela
Cambodia
Guyana
Gabon
Czech Republic
Myanmar

Land resource potential and constraints at regional and country levels |
9 |
FIGURE 4
Countries most affected by soil constraints: high phosphorus fixation
0 |
10 |
20 |
30 |
40 |
50 |
60 |
70 |
80 |
French Guyana
Trinidad/Tobago
Burundi
Brazil
Guyana
L a o s
S u r i n a m e
Congo Democratic Republic
High phosphorus fixation
This problem is caused primarily by a high content of free ferric oxides (Fe2O3) in the clay fraction, which fix phosphate ions in unavailable forms. It is a feature also found in strongly acid soils, and hence commonly associated with the previous constraint, aluminium toxicity.
Of the eight countries with more than 20% of land affected by high phosphorus fixation, all except two (Trinidad and Tobago, Burundi) appear also among the countries most affected by aluminium toxicity (Figure 3). Phosphorus fixation is found particularly in Brazil and a group of three countries along its northern borders.
The phosphorus deficiency caused by this constraint is difficult to overcome, since added phosphate fertilizers rapidly become fixed. Slow-release forms of phosphorus are preferable, and recent research on the addition of rock phosphate represents a significant attempt to ameliorate this problem.
Vertic properties
Vertic properties, the FCC term applicable largely to Vertisols (‘black cotton soils’), are the properties possessed by black or dark-coloured clayey soils which swell on wetting and shrink, causing wide cracks, in drying. The cause is a high clay content coupled with >50% 2:1 lattice (montmorillonitic) clay minerals.
The distribution of Vertisols is highly localized, being linked with mafic (basic) rocks, semiarid climates, or both these conditions. The greatest absolute extents are found in India (the lavas of the Deccan), Australia, and Sudan (especially the Gezira zone). Twelve countries, in all the major continental regions, have over 10% of their land with vertic properties, Uruguay and India having the highest relative extent.
Vertisols are chemically fertile and have moderate organic matter contents, but their management for cultivation is difficult owing to their physical properties: stiff and sticky when wet, hard when dry. Root damage can occur during development of cracks. Some Vertisols are under annual crops including, although by no means only, cotton, whilst others remain as pasture.
Salinity and sodicity
Saline and sodic (natric) soils occur naturally on low-lying sites in semi-arid to arid regions. They are caused by accumulation of free salts in the profile (salinity), or dominance of the exchange
10 |
Soil constraints |
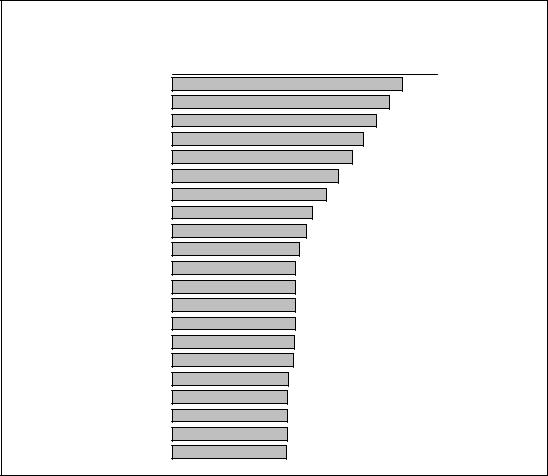
FIGURE 5
Countries most affected by soil constraints: vertic properties
0 |
5 |
10 |
15 |
20 |
25 |
Uruguay
India
Puerto Rico
Belize
Sudan
El Salvador
Jamaica
Israel
Cuba
Lebanon
Dominican Republic
Guatemala
Cyprus
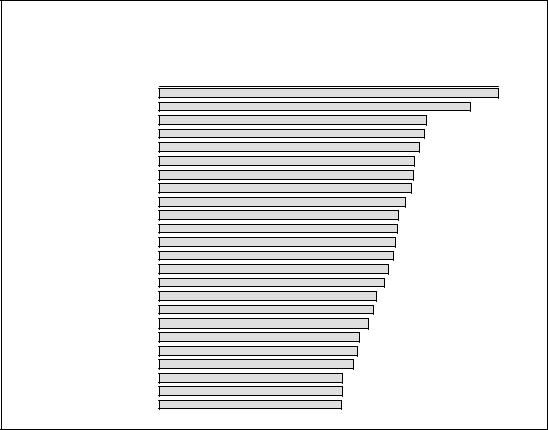
FIGURE 6
Countries most affected by soil constraints: salinity and sodicity
0 |
|
|
|
10 |
|
20 |
30 |
40 |
|
50 |
|||||||||
Kazakhistan |
|
|
|
|
|
|
|
|
|
|
|
|
|
|
|
|
|
|
|
|
|
|
|
|
|
|
|
|
|
|
|
|
|
|
|
|
|
|
|
|
|
|
|
|
|
|
|
|
|
|
|
|
|
|
|
|
|
|
|
|
|
|
|
|
|
|
|
|
|
|
|
|
|
|
|
|
|
|
|
Djibouti |
|
|
|
|
|
|
|
|
|
|
|
|
|
|
|
|
|
|
|
|
|
|
|
|
|
|
|
|
|
|
|
|
|
|
|
|
|
|
|
Paraguay |
|
|
|
|
|
|
|
|
|
|
|
|
|
|
|
|
|
|
|
Moldova |
|
|
|
|
|
|
|
|
|
|
|
|
|
|
|
|
|
|
|
|
|
|
|
|
|
|
|
|
|
|
|
|
|
|
|
|
|
|
|
Hungary |
|
|
|
|
|
|
|
|
|
|
|
|
|
|
|
|
|
|
|
|
|
|
|
|
|
|
|
|
|
|
|
|
|
|
|
|
|
|
|
|
|
|
|
|
|
|
|
|
|
|
|
|
|
|
|
|
|
||
Uzbekistan |
|
|
|
|
|
|
|
|
|
|
|
|
|
|
|
|
|
|
|
|
|
|
|
|
|
|
|
|
|
|
|
|
|
|
|
|
|
||
Australia |
|
|
|
|
|
|
|
|
|
|
|
|
|
|
|
|
|
|
|
|
|
|
|
|
|
|
|
|
|
|
|
|
|
|
|
|
|||
Pakistan |
|
|
|
|
|
|
|
|
|
|
|
|
|
|
|
|
|
|
|
|
|
|
|
|
|
|
|
|
|
|
|
|
|
|
|
|
|||
Argentina |
|
|
|
|
|
|
|
|
|
|
|
|
|
|
|
|
|
|
|
Turkmenistan |
|
|
|
|
|
|
|
|
|
|
|
|
|
|
|
|
|
||
|
|
|
|
|
|
|
|
|
|
|
|
|
|
|
|
|
|
|
|
|
|
|
|
|
|
|
|
|
|
|
|
|
|
|
|
|
|||
Qatar |
|
|
|
|
|
|
|
|
|
|
|
|
|
|
|
|
|
|
|
|
|
|
|
|
|
|
|
|
|
|
|
|
|
|
|
|
|||
Ukraine |
|
|
|
|
|
|
|
|
|
|
|
|
|
|
|
|
|
|
|
|
|
|
|
|
|
|
|
|
|
|
|
|
|
|
|
||||
Iran |
|
|
|
|
|
|
|
|
|
|
|
|
|
Saline |
|
|
|
|
|
|
|
|
|
|
|
|
|
|
|
|
|
|
|
||||||
Mongolia |
|
|
|
|
|
|
|
|
|
|
|
|
|
|
|
|
|
||
|
|
|
|
|
|
|
|
|
|
|
|
|
|
|
|
|
|||
Kenya |
|
|
|
|
|
|
|
|
|
|
Sodic |
|
|
|
|
||||
|
|
|
|
|
|
|
|
|
|
|
|
|
|
|
|
|
|||
|
|
|
|
|
|
|
|
|
|
|
|
|
|
|
|
|
|||
|
|
|
|
|
|
|
|
|
|
|
|
|
|
|
|
||||
Somalia |
|
|
|
|
|
|
|
|
|
|
|
|
|
|
|
|
|
|
|
|
|
|
|
|
|
|
|
|
|
|
|
|
|
|
|
||||
Iraq |
|
|
|
|
|
|
|
|
|
|
|
|
|
|
|
|
|
|
|
United Arab Emirates
Botswana
Chile
Tunesia
complex by sodium ions (sodicity). The areas shown on the Soil Map of the World, andthusrepresented in Figure 6 and Appendix 1, largely exclude secondary salinization caused by poor management of irrigation schemes.
Salinity is a problem in many parts of the semi-arid and arid zones. Of the 21 countries with over >15% of their land affected, 13 lie in a broad belt extending from the African Sahara and
Land resource potential and constraints at regional and country levels |
11 |
its bordering sahel zone through the Middle East and into Central Asia. Sodicity appears to be even more strongly localized, with six countries (three of them in Central Asia) affected over more than 10% of their extent. However, some of the contrasts are undoubtedly caused by differences of interpretation, as between countries, over what constitutes a sodic soil.
Reclamation of naturally saline soils is generally uneconomic or impractical, owing to the cost or unavailability of non-saline water, whilst schemes to reclaim salinized soils of irrigation schemes are extremely costly. Sodicity is still more difficult to overcome although methods exist, involving drainage, leaching and vegetation. Mildly saline soils can be used for salt-tolerant crops (e.g. date palm, barley, cotton).
Shallowness
The limitation of shallowness applies to soils with rock or a hard, cemented horizon near the surface. In the FCC a maximum depth of 50 cm is specified, but the majority of the mapped area has <30 cm depth. These soils are often stony or gravelly, prone to desiccation, and frequently occur on steeplands (see Chapter 3).
The world distribution of shallow soils (now known as Leptosols, formerly as Lithosols, Rendzinas and Rankers) shows a moderate degree of correspondence with major mountain ranges, together with some polar and arid regions. These three sets of environments account for most of the countries shown as most widely affected.
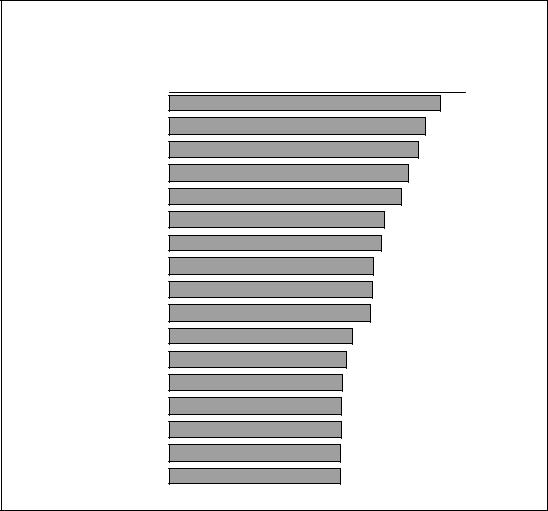
FIGURE 7
Countries most affected by soil constraints: shallowness
0 |
10 |
20 |
30 |
40 |
50 |
60 |
70 |
Slovenia
Armenia
Kyrgyzstan
Cyprus
Tajikistan
Iceland
Djibouti
Somalia
Korean Dem. Rep.
Afghanistan
Egypt
Mexico
Georgia
Syria
Guinea
Iraq
Haiti
Western Sahara
Lesotho
Yemen
Ethiopia
12 |
Soil constraints |
Pressure of population on land has resulted in the cultivation of shallow soils on steep slopes becoming quite widespread in the tropics. Such cultivation is likely to be short-lived unless measures are taken to check erosion; areas of irreversibly degraded, abandoned land are found (e.g. in Haiti). Most such land should be kept under natural vegetation, and used for grazing or recreational purposes. An exception is the case of Rendzinas, shallow soils over limestone, which under careful management can be highly productive for grain production, as in the UK.
Erosion hazard
Many attempts have been made to map degrees of erosion hazard. The basis employed here is to identify areas on the Soil Map of the World having predominantly very steep slopes (>30%), together with areas of steep slopes (8-30%) in conjunction with an abrupt textural contrast in the soil profile, denoting these as having a severe erosion hazard.
The world area having high erosion hazard is somewhat greater than for the other major soil constraints: shallowness, aluminium toxicity, and hydromorphy. This justifies the strong emphasis which has been given to control of erosion as a prerequisite for good soil management. The countries mapped as having the greatest relative area prone to erosion show a somewhat erratic distribution, far from coincident with those in which water erosion has, to date, been the most severe.
FIGURE 8
Countries most affected by soil constraints: erosion hazard
0 |
10 |
20 |
30 |
40 |
50 |
60 |
70 |
80 |
90 |
Myanmar
Vietnam
Malaysia
Thailand
Lesotho
Greece
Rwanda
Philippines
Albania
Slovenia
Laos
Bosnia Herzegovina
Bhutan
Macedonia
Fiji
Cambodia
Switzerland