

СЭГ Мира / 1 семестр / ПРАКТИКУМ СЭГ мира,часть 1 / ХРЕСТОМАТИЯ электронная / 08 CХ+УДОБРЕНИЯ / wsr
.pdfLand resource potential and constraints at regional and country levels |
23 |
STEEPLANDS
Agenda 21 (UNCED, 1992) identifies ‘mountain regions’ as a second fragile environment, but does not precisely define these. By implication, they are regarded as having a combination of steep slopes with high altitude, coupled with particular roles in forest production, as water catchments, as reserves of biological diversity, and for recreation.
Although often found at high altitudes, as mountain regions, steeplands need not necessarily be so. Low-altitude hill ranges and dissected scarplands (e.g. on the margins of the African Rift Valley) share many of the same problems. The dominant environmental feature is steep slopes, which in combination with deforestation bring about land degradation through landsliding and soil erosion. There is an established body of research on the problems of steeplands (e.g. Moldenhauer and Hudson, 1988).
Methods
The Soil Map of the World recognized three slope classes:
Level to gently undulating |
dominant slopes 0-8% |
Rolling to hilly |
dominant slopes 8-30% |
Steeply dissected to mountainous |
dominant slopes >30% |
Areas in the second and third of these classes are shown at country level in Appendix 4. However, it is clear from inspection of the areas mapped that it is the third class, with dominant slopes >30%, which should be taken as diagnostic of steeplands.
These slope classes were not the primary mapping units of the Soil Map of the World, but were added to the areas mapped for soils. It is therefore probable, on a priori grounds, that they are less accurate than would have been obtained from mapping specifically directed at landforms.
A means of comparing two independent sources was available from a current FAO digital soil and terrain map of East Africa at 1:1.5 million scale. Variations as between the two estimates are not systematic, and in many cases not large in terms of absolute area3. However, in terms of relative area, many of the differences are often substantial (Table 9). Unfortunately, the largest differences occur where slope is most significant, in the >30% slope class, for which the percentage areas shown by one source are often half, or twice or more, those shown by the other. It is likely that data reliability will be improved by the World Soils and Terrain Digital Database (SOTER) (ISRIC, 1993), in which slope forms an integral, rather than supplementary, part of the mapping procedure.
TABLE 9
Percentage areas by slope class for selected countries of East Africa. SMW: Soil Map of the World. DMEA: Digital Soil and Terrain Map of East Africa. Areas are rounded to the nearest whole percent.
|
<8% |
|
8-30% |
|
>30% |
|
|
SMW |
DMEA |
SMW |
DMEA |
SMW |
DMEA |
Burundi |
32 |
20 |
50 |
53 |
18 |
27 |
Egypt |
46 |
45 |
40 |
49 |
13 |
6 |
Kenya |
51 |
51 |
34 |
43 |
15 |
6 |
Rwanda |
21 |
8 |
45 |
36 |
34 |
56 |
Sudan |
63 |
66 |
29 |
31 |
8 |
3 |
Somalia |
53 |
64 |
35 |
30 |
12 |
6 |
Uganda |
52 |
43 |
39 |
49 |
12 |
6 |
3 |
It is not known which is the more correct, although the East Africa map is at a larger scale. |
|
24 |
Drylands and steeplands |
Results
Areas in the slope classes rolling to hilly (steep slopes) and steeply dissected to mountainous (very steep slopes) are shown by country in Appendix 4, Table 4a-g. Worldwide, steeplands occupy nearly 15 M km2 or 11% of the land area. The greatest absolute areas are found in China, the Russian Federation, the United States, and Canada. China’s problems in finding sustainable management for its vast tracts of steeplands are well-recognized. In Africa, the greatest extent is found in Ethiopia, whilst in Central and South America, Mexico and Peru both have over 340 000 km2 of steeply-sloping terrain.
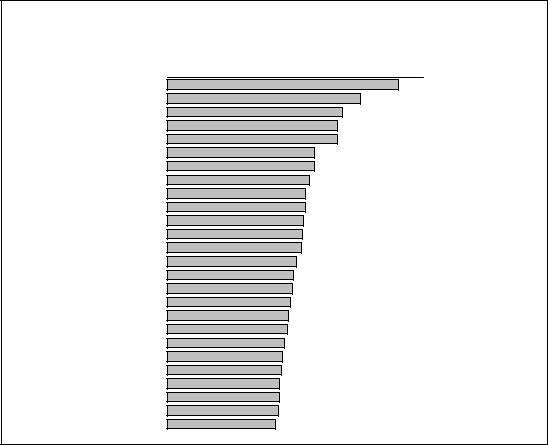
The countries with the highest relative extent of steeplands are shown in Figure 12. They fall into recognizable groups, mainly associated with the major mountain chains of Eurasia (Switzerland, Albania, Macedonia, Turkey, and 5 countries of Central Asia), the Andes of South America (Chile, El Salvador, Peru, and Honduras), south-east Asia (Laos, Korean Republic, Myanmar, Vietnam, and Thailand), and Oceania (New Zealand, Papua New Guinea, and Fiji). The three African countries represented, Rwanda, Lesotho, and Ethiopia, owe their steeplands not to recent folding but dissection of uplifted plateaux, whilst in two island states, the Falklands and Solomon Islands, the sloping lands are volcanic in origin.
The constraint of steep slopes is by no means confined to the most-affected group in Figure 12. Some 50 countries have >20% of their area under steeplands, those in the 20-25% range including some that are widely recognized as having mountainous or steeply-sloping hill regions, for example Haiti, Afghanistan, Nepal, Jamaica and Malawi. All these countries number the constraints of steeplands among their leading problems of land management, and conversely, benefit from the resource potential (for water, forestry, wildlife, etc.) which such areas offer.
FIGURE 12
Steeplands: countries with >25% of land dominated by very steep (>30%) slopes
0 |
10 |
20 |
30 |
40 |
50 |
60 |
Laos
NewZealand
KoreanRep.
Falklands
Fiji
Armenia
Myanmar
Vietnam
Chile
Macedonia
Georgia
Switzerland
PapuaNewGuinea
Albania
Ethiopia
Solomon Islands
Rwanda
Kyurgyzstan
El Salvador
Lesotho
Turkey
Peru
Thailand
Slovenia
Tajikistan
Honduras
Land resource potential and constraints at regional and country levels |
25 |
Chapter 4
Land degradation
Land degradation refers to the temporary or permanent reduction in the productive capacity of land as a result of human action. It is recognized that land degradation is a problem that is widespread, and in some areas severe. Until recently, however, there was little or no basis for estimating its extent and severity. Exaggerated claims were sometimes made for the extent of soil erosion and (supposed) desertification (Young, 1998).
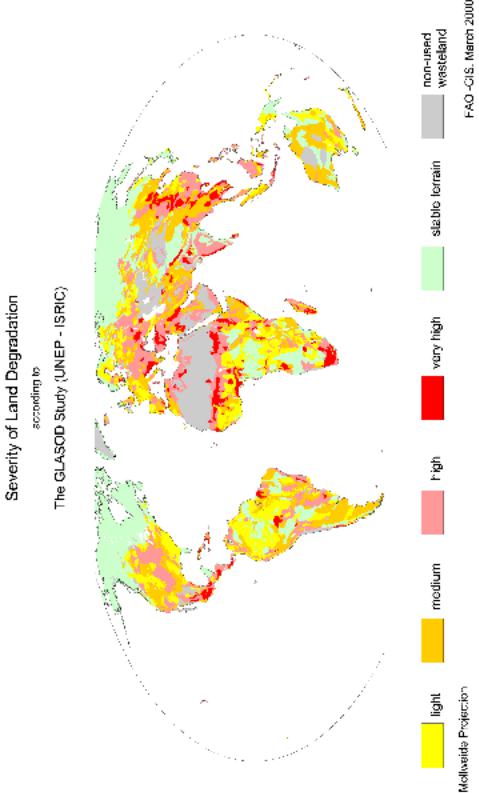
The first attempt to improve upon this absence of data was made in the late 1980s, when the International Soil Reference and Information Centre (ISRIC), in conjunction with UNEP, undertook a global inventory of the status of human-induced soil degradation (Oldeman et al., 1990, 1991; UNEP, 1992; Oldeman, 1994). The Global Assessment of Soil Degradation (GLASOD) was based on a structured recording of the type, severity and extent of degradation, together with its major causes. The GLASOD survey remains the only uniform global source of land degradation data.
METHODS
The GLASOD survey
The method employed for the GLASOD survey is set out in full in Oldeman et al. (1990). In summary, a set of mapping units, relatively homogeneous in their physical characteristics, was established. For each mapping unit, national experts were asked to estimate:
•Type of degradation: water erosion, wind erosion, chemical deterioration, physical deterioration, and subdivisions of these.
•Degree of degradation: light, moderate, strong, extreme.
•Relative extent of degradation, as percentage of the mapping unit affected.
•Causative factors of degradation: deforestation, overgrazing, agricultural activities (improper agricultural management), overexploitation of vegetation (cutting for fuelwood, etc.), industrial activities (pollution).
The full set of definitions may be found in Oldeman et al. (1990). For present purposes, it is important to note the degrees of degradation, defined in terms of reductions in land productivity. In abbreviated form, these definitions are as follows:
•Light: somewhat reduced agricultural suitability.
•Moderate: greatly reduced agricultural productivity.
•Strong: biotic functions largely destroyed; non-reclaimable at farm level.
•Extreme: biotic functions fully destroyed, non-reclaimable.

Land resource potential and constraints at regional and country levels |
27 |
Soil degradation severity is obtained by combining the degree of degradation with its spatial extent. With four classes for degree, and five for extent, twenty combinations are possible. These were grouped into four degradation severity classes: light, moderate, severe, and very severe (Figure 13)1. A very severely degraded area can mean, for example, either that extreme degradation affects 10-25% of a mapping unit, or that moderate degradation affects 50-100% of the unit.
FIGURE 13
Land degradation severity classes
Extent of degradation (% of mapping unit affected)
0-5% |
5-10% 10-25% 25-50% 50-100% |
|
|
|
||||
Degree of degradation |
|
|
|
|
Degradation severity classes |
|||
light |
|
|
|
|
|
|
|
light |
moderate |
|
|
|
|
|
|
|
moderate |
strong |
|
|
|
|
|
|
|
severe |
extreme |
|
|
|
|
|
|
|
very severe |
|
|
|
|
|
|
|
||
|
|
|
|
|
|
|
|
|
The results of the GLASOD survey were initially published as a map at a scale of 1:15 million, showing the dominant (most severe) type of degradation for each mapping unit as a colour, and the degradation severity as intensity of colour. This highlights which type of degradation is dominant in each region, but makes it difficult to isolate the degree of severity of each type. A clearer overview is given by the smaller scale maps in UNEP (1992), showing overall soil degradation severity (Map 4) and the severity of each type of degradation.
The GLASOD data were derived from estimates by over 290 national collaborators, moderated by 23 regional correlators. These estimates were based upon defined mapping units and a carefully structured set of definitions, but ultimately they were dependent on local knowledge rather than surveys. The results are thus to a degree subjective, and open to the criticism that local experts may have allowed perceived correlations with other factors, or even the vested interests of conservation institutions, to influence their judgment. Until methods are established for surveying and monitoring the status of land degradation, however, there is no better source of global data.
Interpretation of the GLASOD data in this study
The present study is based on analysis of the original GLASOD data, digitized, and identified for individual countries. It would have been possible to take either degree or severity of degradation as the basis. Degree of degradation answers the question, “What proportion of the total land area has its productivity reduced by the defined amount?” Table 10 shows degree of soil degradation by percentage of area covered2. Combining the world figures for strong and extreme degradation gives the best current estimate of land which has been largely, and for most practical purposes irreversibly, destroyed by land degradation. The total is 3.05 M km2, or 305 M ha. This may seem small if regarded as 2.3% of the world’s land area, but its seriousness is considerably
1The original GLASOD survey calls these classes low, medium, high and very high; Here terms more descriptive of degradation severity have been substituted.
2Because these data are taken directly from the GLASOD published results, the regional units are different from those employed in the present study.

28 |
Land degradation |
TABLE 10 |
|
|
|
|
|
Degree of soil degradation |
by subcontinental regions (% of total area) |
|
|
||
|
None |
Light |
Moderate |
Strong |
Extreme |
|
|
|
|
|
|
Africa |
83 |
6 |
6 |
4 |
0.2 |
Asia |
82 |
7 |
5 |
3 |
<0.1 |
Australasia |
88 |
11 |
0.5 |
0.2 |
<0.1 |
Europe |
77 |
6 |
15 |
1 |
0.3 |
North America |
93 |
1 |
5 |
1 |
0 |
South America |
86 |
6 |
6 |
1 |
0 |
|
|
|
|
|
|
World: |
|
|
|
|
|
Percentage |
85 |
6 |
7 |
2 |
<0.1 |
Area (‘000 km2) |
110 483 |
7490 |
9106 |
2956 |
92 |
|
|
|
|
|
|
Source: World Atlas of Desertification (UNEP,1992)
greater, for it is equivalent to 21% of the present arable area of 14.6 M km2 (this figure is quoted for purposes of comparison; by no means all of the strong degradation has taken place on arable land). The total area with some degree of degradation, and thus with reduced productivity, is 19.6 M km2.
Only one part of each mapping unit is affected by land degradation, although it is not known which part of the unit is degraded, and which is not. However, if only the actual degraded area is taken into account (as in Table 10), an underestimation of the problem area is likely to result for a number of reasons. First, it does not adequately consider the land surrounding the degraded site, and hence effects upon the farm enterprise. Secondly, off-site effects, such as sedimentation, are not included. Thirdly, land degradation on part of a farm, or other land use enterprise, has adverse effects upon the economy as a whole, whether at village, regional or national levels. Lastly, the percentages in Table 9 are on a base of total land area, and thus include deserts, mountains, and other land which is unused or used for non-agricultural purposes.
For these reasons, this paper takes soil degradation severity, a combination of the degree of degradation with its extent within mapping units, as the basis for analysis. Severity is an indicator of the overall seriousness of degradation, within a mapping unit, country or region.
SEVERITY OF DEGRADATION
Data for land degradation severity, together with the dominant causes and types of degradation, are shown by country in Appendix 5 Tables A5a-g. A regional summary of the severity data is given in Table 11. In South East Asia, virtually all land is regarded as degraded, more than 80% of it to at least a moderate degree. Ninety percent of the long-settled lands of Europe are degraded to some degree. The least degraded regions are North America and the AustraliaPacific region.
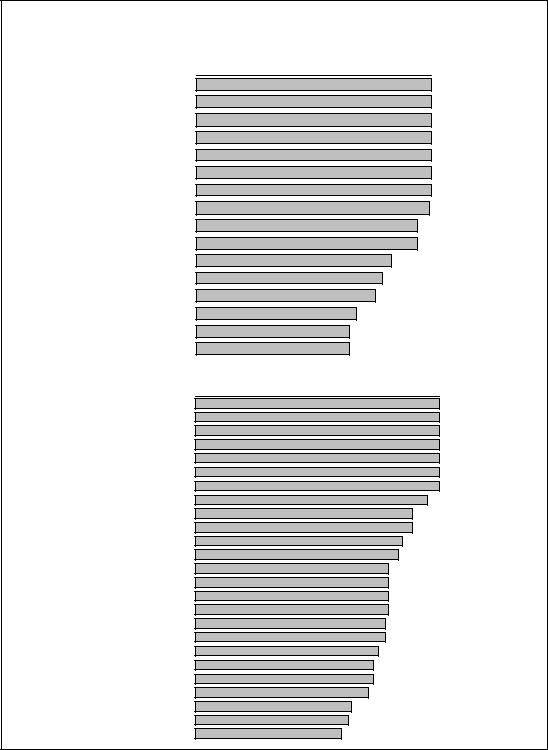
At country level, 58 countries, 21 of them in Europe, are reported as having no land at all in the severity class None, that is, every mapping unit in these countries has at least the Light degree of degradation severity. The countries with the highest proportion of land in the Severe and Very Severe classes are shown in Figure 151. Fifteen countries have 99-100% of their land
1It seems likely from inspection of the data that national correspondents differed in their interpretation of what constitutes Severe and Very Severe degradation. These classes have therefore been combined.
Land resource potential and constraints at regional and country levels |
29 |
TABLE 11
Land degradation severity by region (% of area by severity class)
|
|
|
None |
Light |
Moderate |
Severe |
Very |
Total |
Degradation: |
|
|
|
|
|
|
|
Severe |
degrada- |
Moderate – |
|
|
|
|
|
|
|
|
tion: Light – |
Very Severe |
|
|
|
|
|
|
|
|
Very Severe |
|
Sub-Saharan Africa |
33 |
24 |
18 |
15 |
10 |
65 |
42 |
||
North |
Africa |
& Near |
30 |
17 |
19 |
28 |
7 |
70 |
52 |
East |
|
|
|
|
|
|
|
|
|
Asia and Pacific |
28 |
12 |
32 |
22 |
7 |
72 |
61 |
||
North |
Asia, |
east of |
53 |
14 |
12 |
17 |
4 |
47 |
33 |
Urals |
|
|
|
|
|
|
|
|
|
South |
& |
Central |
23 |
27 |
23 |
22 |
5 |
77 |
50 |
America |
|
|
|
|
|
|
|
|
|
Europe |
|
|
9 |
21 |
22 |
36 |
12 |
90 |
70 |
North America |
|
51 |
16 |
16 |
16 |
0 |
44 |
29 |
|
World |
|
|
35 |
18 |
21 |
20 |
6 |
65 |
47 |
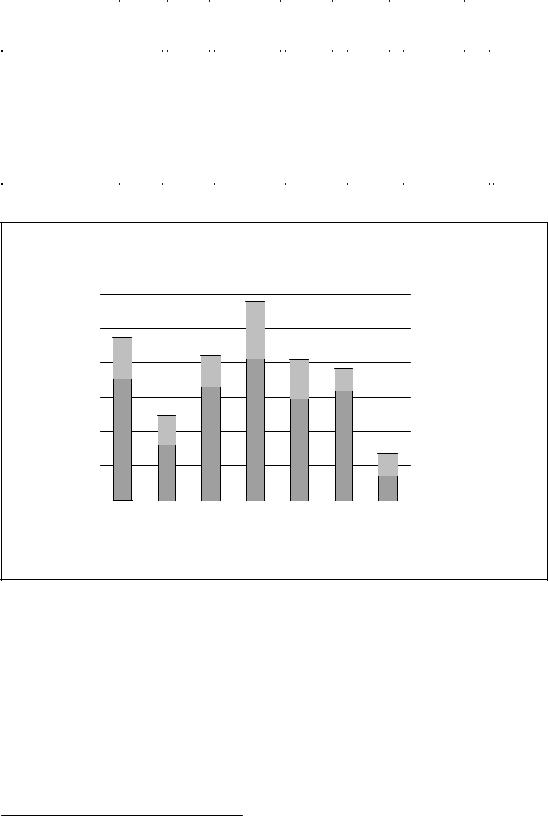
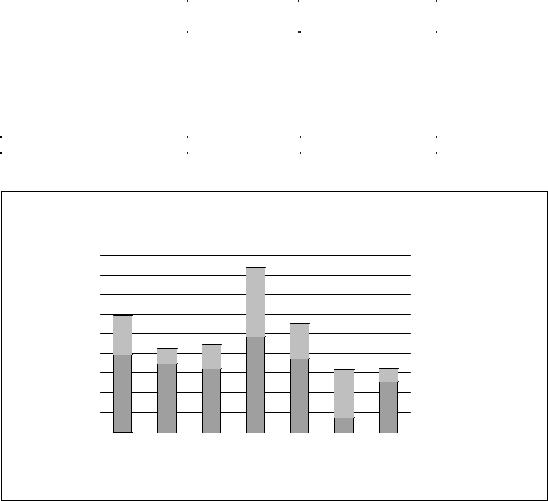
FIGURE 14
Human-induced land degradation (severe and very severe) as percentage of total land area
|
30 |
|
25 |
sq. km) |
20 |
|
|
(million |
15 |
|
|
Area |
10 |
|
|
|
5 |
|
0 |
Sub- |
North |
North |
Asia and |
South |
North Europe |
Saharan |
Africa |
Asia, |
Pacific |
and |
America |
Africa |
and Near |
east of |
|
Central |
|
|
East |
Urals |
|
America |
|

 Total humaninduced land degradation

 Total land
severely degraded. A further 17 have over 75% of land in this degradation severity class, and in total, 41 countries have over 60%. Some of these countries correspond with expectation from field experience. Lesotho, Haiti and Madagascar, for example, are known to have exceptionally severe soil erosion1. Others may seem unexpected, for example Malaysia and Belgium.
SEVERE LAND DEGRADATION DUE TO AGRICULTURAL ACTIVITIES
Annual cropping (including shifting cultivation) is often blamed as a major cause of land degradation, and an attempt was therefore made to isolate such degradation. The GLASOD survey contains no data on land use, so degradation on cultivated land cannot be identified. It
1 |
‘The world’s most severe soil erosion is possibly found in Ethiopia, Lesotho and Haiti.’ (Young, 1998). |
|
30 |
Land degradation |
FIGURE 15
Countries with >60% of land severely or very severely degraded: (a) Europe; (b) non-Europe
(a) Europe |
0 |
20 |
40 |
60 |
80 |
100 |
Bosnia Herzegovina
Bulgaria
Croatia
Cyprus
Czech Republic
Moldova
Romania
Turkey
Albania
Yugoslavia Fed.Rep.
Poland
Slovenia
Ukraine
Latvia
Belgium
Hungary
(b) Non-Europe |
0 |
20 |
40 |
60 |
80 |
100 |
Lesotho
Costa Rica
Jamaica
Trinidad/Tobago
Panama
Honduras
Iraq
Philippines
Thailand
Burundi
Guatemala
Southafrica
Syria
did, however, ask respondents to give, for each mapping unit, the principal causative factors of degradation, one of which was “agricultural activities”. When all such areas are mapped, they show a considerable degree of correspondence with the world’s cultivated land (UNEP, 1992). This causative factor (often recorded as a joint cause together with deforestation and overgrazing) can therefore be taken as an approximate indicator of degradation on agricultural land. Among
Land resource potential and constraints at regional and country levels |
31 |
Table 12 shows, for areas degraded by agricultural activities only, the regional extent of severely degraded land (the sum of Severe and Very Severe classes). The global extent of such land is 12.4 M km2, which is 35% of the total area of severely degraded land from all causes. The total area recorded, by land use statistics, as being presently under arable use is only slightly greater than this, 13.5 M km2. Country information for severely degraded land is given in Appendix 6. Fourteen countries have 100% of land with agriculturally-caused degradation in the Severe and Very Severe classes.
TABLE 12
Human-induced severe and very severe land degradation due to agricultural activities
Region |
Area extent |
% of total area |
% of severely |
|
(‘000 km²) |
|
degraded land |
Sub-Saharan Africa |
1996 |
8 |
34 |
North Africa and Near East |
759 |
6 |
18 |
North Asia, east of Urals |
1180 |
6 |
27 |
Asia and Pacific |
3506 |
12 |
42 |
South and Central America |
1795 |
9 |
32 |
North America |
2427 |
13 |
77 |
Europe |
727 |
11 |
22 |
World |
12391 |
9 |
35 |
FIGURE 16
Degradation due to agricultural activities as a percentage of total human-induced degradation
|
9 |
|
|
|
|
|
|
|
8 |
|
|
|
|
|
|
km) |
7 |
|
|
|
|
|
|
sq. |
6 |
|
|
|
|
|
|
(million |
|
|
|
|
|
|
|
5 |
|
|
|
|
|
|
|
|
|
|
|
|
|
|
|
area |
4 |
|
|
|
|
|
|
3 |
|
|
|
|
|
|
|
Degraded |
|
|
|
|
|
|
|
2 |
|
|
|
|
|
|
|
1 |
|
|
|
|
|
|
|
|
|
|
|
|
|
|
|
|
0 |
|
|
|
|
|
|
|
Sub- |
North |
North |
Asia and |
South |
North |
Europe |
|
Saharan |
Africa |
Asia, |
Pacific |
and |
America |
|
|
Africa |
and Near |
east of |
|
Central |
|
|
|
|
East |
Urals |
|
America |
|
|

 Degradation due to agricultural activities

 Degradation due to other causes
CAUSES OF DEGRADATION
General
The dominant causes of degradation, as given by GLASOD respondents, are shown at country level in the penultimate column of Tables A5a-g of Appendix 5. These causes are mapped at a world scale in UNEP (1992). At this broad level, the relations are very much as would be expected. As already noted, agricultural activities are given as a cause of degradation throughout most of the agricultural lands of the world, in all continents. Deforestation appears as a joint
32 |
Land degradation |
cause with agriculture over large parts of these lands (e.g. Togo, Malaysia, Honduras, Costa Rica, Cuba, and island states of the Caribbean), and as a cause in its own right over much of the remainder of the rain forest zone. A recent study (Kirschke, et al. 1999) of 73 developing countries has shown that deforestation rates are relevant as a causative factor for both wind and water erosion (including degradation through loss of nutrients and organic matter) under both humid and arid climate conditions, except for the combinatition wind erosion in dry countries, where the corelation is less clear.
Overgrazing is the dominant cause in most of the dryland countries, not only in developing countries (e.g. Libya, Tunisia, Iran, Iraq, Syria), and across virtually the whole of the sahel belt of Africa. It is also the major cause in many parts of Central Asia, Argentina, and in drylands of developed countries including Australia and Western United States. Overexploitation of vegetation for domestic use (fuelwood, domestic timber) is given as a more localized cause, important in the sahel belt of Africa, western Argentina, Iran and Pakistan. Biological degradation caused by industrial pollution (e.g. toxic wastes, acid rainfall) is a major cause of degradation in some European countries (e.g. Belgium, Lithuania, Luxembourg, The Netherlands, Norway, Sweden).
Soil erosion by water: erosion risk and observed erosion
Standardized, replicable methods of recording and mapping observed erosion have yet to be developed, and with the notable exception of the GLASOD survey, most attempts to map erosion have employed erosion hazard, the causative factors, rather than observed erosion. It is therefore of interest to compare the susceptibility of the soil to erosion with the severity of observed erosion. The present study contains, at a broad scale, both of these elements.
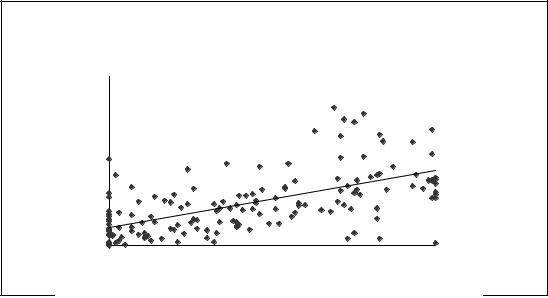
Figure 17 shows the relation between erosion hazard and actual water erosion, plotted at the country level. The vertical scale shows the percentage of each country having soils with high erosion risk (see Chapter 2). The horizontal scale is the percentage of land in the country which is degraded by water erosion (severity classes Moderate-Very Severe), taken from the GLASOD survey. Despite the high degree of generalization inherent in data at the national level, there is evidence of a clear linear relationship. The analysis of Kirschke et al. (1999) has shown that, regardless of the prevailing general climatic conditions, the prevalence of steep slopes (slopes >30%) is most relevant in the explanation of water erosion.
FIGURE 17
Erosion hazard and observed erosion, at country level. (R2=0.34; n=160)
|
100 |
|
|
|
|
|
|
80 |
|
|
|
|
|
risk |
60 |
|
|
|
|
|
Erosion |
|
|
|
|
|
|
40 |
|
|
|
|
|
|
% |
|
|
|
|
|
|
|
20 |
|
|
|
|
|
|
0 |
|
|
|
|
|
|
0 |
20 |
40 |
60 |
80 |
100 |
% Water erosion