

СЭГ Мира / 1 семестр / ПРАКТИКУМ СЭГ мира,часть 1 / ХРЕСТОМАТИЯ электронная / 08 CХ+УДОБРЕНИЯ / wsr
.pdfLand resource potential and constraints at regional and country levels |
33 |
There is scope to investigate the relationship between other types of land degradation and predictive factors for them. In the case of wind erosion, established methods are available; wind erosion is naturally favoured by large areas of levels and plains (or the absence of slopes >8%) (Kirschke et al. 1999). For soil chemical deterioration, it will be necessary to explore which inherent factors of the soil lead to a high susceptibility to degradation; relationships would be expected with net topsoil loss (e.g. Stocking, 1986) and nutrient imbalance as determined from farm system studies (Stoorvogel and Smaling, 1993). Degradation due to overgrazing might be expected to show a relation with livestock density (Wint and Rogers, 1998; Kruska et al., 1995).
Land degradation and population density
Given the expected importance of the spatial variation of population density as a factor influencing land degradation, an attempt was made to examine the relationship between population and degradation severity. Appendix 7 Tables 7a-g show, at national level, the population densities associated with each of the GLASOD degradation severity classes (Tobler et al., 1995). Table 13 provides an overview at regional level.
TABLE 13
Land degradation severity and population density by region. (Population density in number of inhabitants per km2)
|
None |
Light |
Moderate |
Severe |
Very Severe |
Sub-Saharan Africa |
8 |
20 |
29 |
34 |
50 |
North Africa & Near East |
2 |
22 |
34 |
15 |
22 |
North Asia, east of Urals |
4 |
11 |
10 |
19 |
20 |
Asia & Pacific |
19 |
5 |
13 |
26 |
8 |
South & Central America |
10 |
13 |
15 |
28 |
58 |
Europe |
31 |
74 |
108 |
101 |
86 |
North America |
5 |
23 |
25 |
21 |
NA |
World |
17 |
25 |
34 |
55 |
67 |
NA = not applicable
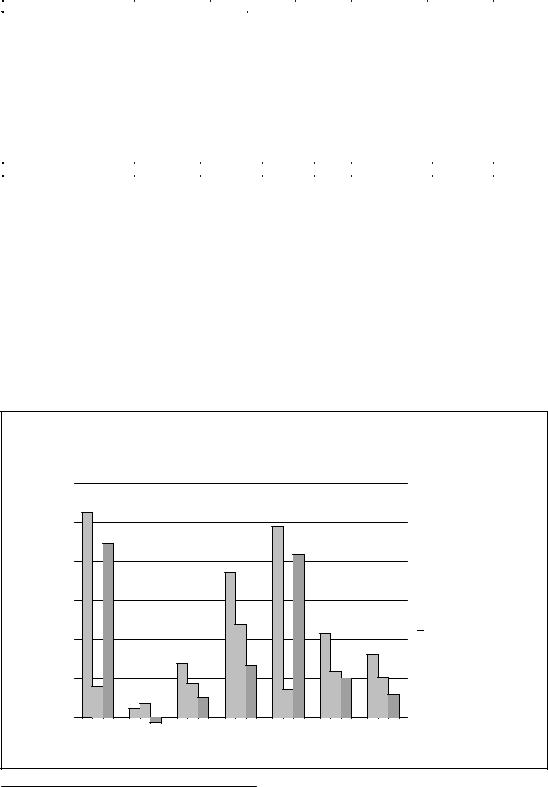
Inspection of the tables suggests a relationship between degradation and population density, which is plotted in Figure 18. In general, higher population densities are associated with land adjudged to be more severely degraded, notably in South and Central America and Sub-Saharan
FIGURE 18
Relationship between land degradation and population density. (Europe is omitted because its high population densities are mainly associated with urbanization.)
Population density
60
50
40
30
20
10
0 |
|
|
|
|
none |
light |
moderate |
severe |
very severe |
Sub-Saharan Africa
North Africa & Near East


 North Asia, east of Urals South & Central America North America
Asia and Pacific
34 |
Land degradation |
Africa. Among exceptions to this trend, the higher density for non-degraded land in Asia and the Pacific is probably linked with rice-growing land. In the case of the lower density on very severely degraded land in the same region, one might suspect out-migration from, or even abandonment of, degraded lands. Thus population density may be treated partly as a cause, but also to some degree as a consequence, of severity of degradation.
At country level, some of the most severe degradation is associated with very high population densities in sloping, highland countries (e.g. Burundi, Rwanda, Thailand, Vietnam, Haiti, Bosnia Herzegovina), or with high population density combined with deforestation (e.g. Togo, Cuba, Costa Rica).
It is commonly argued that population increase in rural communities with growing pressure on land, will lead to an indigenous response in which new techniques are applied, leading to intensification and higher land productivity, an hypothesis first due to Boserup (1965). This response is illustrated by the experience of the Machakos District of Kenya, where population pressure has induced actions that have led to successful land rehabilitation (Tiffen et al., 1994). The study of Kirschke (1999) implies that an intensification of the agricultural system and high levels of land scarcity lead to a higher degree of water erosion. However, the opposite seems true for wind erosion, e.g. low levels of land scarcity and agricultural intensification lead to more wind erosion. A recent study of 64 developing countries (Cuffaro, 1997) has shown that there may also be what are termed adjustment failures. If population densities and land pressures are already high, and population growth is associated with income inequalities and landlessness, then the change in effective demand may be insufficient to promote technical change. These circumstances can lead to a breakdown of communal property rights, a need for non-sustainable cultivation methods in order to produce immediate food needs, and hence to land degradation. A case in point is Malawi, where population increase coupled with land shortage has led to cereal monoculture and lowered soil fertility; but because of the small land holdings, farmers are unable to afford the fertilizer necessary to obtain satisfactory yields (Young, 1999b).
POTENTIAL FOR CARBON SEQUESTRATION ON PRESENTLY DEGRADED LAND
Land degradation leads to a release of carbon to the atmosphere through oxidation of soil organic matter. In the context of the present concern with increase in atmospheric carbon dioxide, it has been suggested that this process could be reversed: by improved agricultural practices and reclamation of degraded land, soil organic matter could be built up again, a process known as carbon sequestration. Among the land use changes which could be promoted with this objective are improved agricultural practices, the introduction of agroforestry, and reclamation of degraded land. By such means, the carbon stored in soils could be substantially increased, by amounts of the order of 30-50 t ha-1. Thus land use changes which are beneficial to local communities would, in addition, fulfil a global environmental objective.
The link between land degradation and carbon sequestration has been the subject of a recent FAO consultation (FAO, 1999). Papers from this meeting discuss the realistic possibilities for carbon sequestration through reversal of land degradation, and the magnitude of the increases in soil carbon storage by this means.
THE ECONOMIC COST OF LAND DEGRADATION
It is clearly important to combat degradation, in order to preserve land resources for future generations. In practice, most decisions on investment for development are taken primarily on

Land resource potential and constraints at regional and country levels |
35 |
economic grounds. It is therefore desirable to |
TABLE 14 |
|
|
|
convert the adverse effects of degradation into |
Annual cost of |
land degradation in the |
||
economic terms. Initial work relating the |
South Asian region (on-site effects) |
|
||
|
Cost, US$ thousand |
|||
GLASOD results to economic factors was |
Type of |
|
|
|
degradation |
|
million per year |
|
|
undertaken by Cuffaro and Heins (1998). |
Water erosion |
|
5.4 |
|
A full discussion of methods for measuring the |
Wind erosion |
|
1.8 |
|
Fertility decline |
|
0.6 - 1.2 |
|
|
economic cost of degradation lies beyond the scope |
Waterlogging |
|
0.5 |
|
of this study, but an example may be given. Taking |
Salinization |
|
1.5 |
|
|
|
|
|
|
the GLASOD estimates as a basis, a calculation |
Total annual cost |
|
9.8 – 10.4 |
|
was made for eight countries of the South Asian |
Source: Young (1994). |
|||
region, with a total population of 1200 million |
|
|
|
|
(Young, 1994; 1998). Relative production loss for the Light, Moderate and Strong degrees of degradation were taken as 5, 20 and 75% respectively. These reductions were applied to average cereal yields over the affected areas. Fertility decline was estimated on a nutrient replacement basis. The cumulative effect of human-induced land degradation was estimated to cost these countries a sum of the order of US$10 thousand million per year (Table 14).
The agricultural domestic product of these countries at the time of the survey was US$145 billion. The cost of degradation is therefore equivalent to a loss of 7% of the economic value of agricultural production. Inclusion of the off-site effects of water erosion (e.g. siltation of reservoirs), and other off-site and indirect effects (e.g. on-costs of processing) would increase this value substantially, certainly to more than 10%. This loss occurs annually, and will continue to do so unless measures are taken to check and reverse land degradation.
It would be possible to extend an estimate of this kind to global land degradation, using the GLASOD data as a basis, although to do so with adequate thoroughness would require calculations of some complexity. For example, the absolute cost of a given degree of degradation would be very much higher in developed regions – which overall are no less severely degraded. However, there is no reason to suppose that the economic cost of degradation, relative to agricultural production, would be any different for the world as a whole than was found for the case of South Asia. Hence it is likely that land degradation over the world as a whole has an economic cost equivalent to at least 10% of gross agricultural production.
The largest body of economic analysis related to land degradation is found in attempts to conduct cost:benefit analysis of soil conservation projects (e.g. Pimentel et al., 1995; Crosson, 1995). This raises questions of discounting, in assigning a present value to future costs and benefits. Powerful arguments have been advanced that conventional methods of economic analysis under-value land resources, and in particular, that the practice of discounting grossly undervalues future option values, the value of resources to peoples of the future (e.g. Price, 1993; Young, 1998).
DISCUSSION
There are still many problems in the measurement of land degradation, whether it be erosion, nutrient depletion, or other forms of soil degradation. The GLASOD survey is the first attempt at a systematic world coverage, comparable to the FAO-UNESCO Soil Map of the World in the field of soil survey. Soon after the publication of the results, it came to be realized that soil fertility decline, through nutrient imbalance and organic matter degradation, was more widespread than had been recognized at the time of the GLASOD survey. The more recent Asian Assessment
36 |
Land degradation |
of Soil Degradation (ASSOD) (Lynden and Oldeman, 1997) shows a greater and more extensive impact of soil fertility decline. It will be apparent from some of the anomalies in the results reported here that improvements are needed in the direction of recording and monitoring of land degradation, including by quantitative, objective and replicable methods.
There is still more controversy about estimating the effects on productivity, and interpreting the economic and social impact of degradation. Despite the high political profile attached to actions for mitigating the negative impacts of development on the environment, surprisingly little attention has been paid to the systematic measurement, compilation and interpretation of data of land degradation. Improvements in this area would provide national governments and international institutions with better information on which to base decisions on the appropriate type, location and scale of potential interventions.
Land resource potential and constraints at regional and country levels |
37 |
Chapter 5
Potential arable land for rainfed agriculture
INTRODUCTION AND RATIONALE
The most fundamental factor influencing the food production capacity of a country or region is its potential arable land, since it is this land which is responsible for growth of most of the major food crops, cereals and roots. After subtracting land needed for non-food crops, the result of multiplying potential arable land by estimated future crop yields gives estimates of future food production potential. Comparison of this potential with forecasts of future population indicate whether countries or regions have the capacity to feed their populations from their own land resources. This is the basic method that has been employed in many past studies, begun in the late 1970s (FAO/UNFPA/IIASA, 1983; FAO, 1984), and still continuing (Alexandratos, 1995; Fischer and Heilig, 1998).
The existence of a potential for expanding the area of cultivated land is basic to the agricultural planning of individual countries. It is clear that land settlement schemes, based on settlement of formerly uncultivated land, are becoming far less frequent, now that land is in short supply in many regions. Databases at FAO and collaborating institutions provide estimates of potential arable land and country level, whilst estimates of presently cultivated land are found in FAO Production Yearbooks (FAO, annual) and the FAO statistical database FAOSTAT (FAO, ongoing). These sources have been used to provide estimates of potential and actual arable land, and hence land still available for cultivation, at national level.
No account has been taken of the potential for expansion of the irrigated area onto land which is not suited to rainfed cultivation. Whilst some degree of expansion will certainly take place, the potential for this is by now extremely limited. Irrigation of arid lands takes very large quantities of water; whilst a high proportions of regions and countries in the dry zones are now experiencing water shortage.
The overall validity of the method employed, and hence of the results obtained, has been questioned. The sequence followed here will be to outline the method and present the results, followed by a summary of arguments which challenge these. The results presented in the section Results should therefore be read in conjunction with the reservations made in the section The reliability of estimates of available cultivable land.
METHODS
The main sources used to obtain estimates of the land with potential for rainfed agricultural production are the digitized Soil Map of the World, a global climatic database (see Chapter 1), and FAO database on climatic and soil requirements for the growth of crops. The basic approach is that of land evaluation, the comparison of the requirements of specified types of land use with the characteristics of mapped areas of land (FAO, 1976).

38 |
Potential arable land for rainfed agriculture |
In this study, the types of land use taken as the basis for evaluation were 21 major world crops, grown under rainfed conditions and at three different technology levels. These were compared with observed climatic and soil characteristics. Estimates were made, at country level, of the suitability of land for rainfed crop production, for each crop and at each level of technology, divided into five classes: very suitable (VS), suitable (S), moderately suitable (MS), marginal (M), and not suitable (NS). Land with rainfed crop production potential was taken as land classified as suitable or marginal (VS, S, MS, or M) for any one of the 21 crops, at the optimum technology level.
Earlier results based on this method have been previously presented, for 91 developing countries (excluding China), in World Agriculture: Towards 2010 (Alexandratos, 1995, Appendix Table A.8). The following account gives revised estimates for these countries (resulting from ongoing modifications to data and methods), and extends them to the 160 countries, developing and developed, of the present study.
RESULTS
Potential arable land for rainfed agriculture
The results at country level are given in Appendix 8 Tables A8a-g. As well as potential arable land, this shows the actual arable areas in 1994, together with the percentage of potentially arable land actually in under cultivation.
The data for potential arable land should be adjusted by making allowance for two nonagricultural uses of such land, protected land (for nature, etc.) and land for human settlement. Through the work of conservation agencies, data on protected areas is relatively good, and a reasonable working assumption is that such areas will neither be increased nor decreased in the future. Based on a calculation for 63 countries in Alexandratos (1995), it was assumed that half the protected areas occupied land classed as potentially arable. Data on land occupied by settlement is, rather remarkably, available for only a small number of countries, and past studies have made use of estimates on average land per person. A high proportion of such land, here assumed to be 100%, occupies potentially arable land.
Table 15 gives a regional summary of the data on potential arable land. The data show first the gross value, then the adjustments to make allowances for protected land and settlement, to give the net values for potential arable land. The last two columns show the land actually under arable use, and the percentage of potential land actually in use.
Taking these data at face value, and in relative terms, there is greatest potential for agricultural expansion in Sub-Saharan Africa and in South and Central America, which together form over 70% of the global potential increase. In North Asia, Asia and the Pacific, North America and Europe, 54-64% of potential arable land is already in use, hence opportunities for expansion appear to exist although on a more limited scale 1. The predominantly dryland region of North Africa and the Near East shows actual cultivation in excess of potential, because irrigated cultivation is not included the comparison.
Besides protected land and settlement, a further land requirement is for forest land, particularly rain forest, the clearance of which is considered undesirable in several respects. First, the
1 |
In fact, a high proportion of the available land for South and Central America is in South America. |
|
Land resource potential and constraints at regional and country levels |
39 |
TABLE 15
Comparison of actual and potential available arable land for rainfed agriculture
|
Gross potential |
Protected land |
|
Settlement |
Net potential |
Actual arable |
% of |
|
|
arable land |
% of |
% of |
(% of total |
arable land |
land (1994) |
potential |
|
|
(rainfed |
total |
potential |
area) |
(rainfed |
(1000 ha) |
arable land |
|
|
cultivation) |
area |
arable |
|
cultivation) |
|
(rainfed |
|
|
(1000 ha) |
|
|
|
|
(1000 ha) |
|
cultivation) |
|
|
|
|
|
|
|
|
actually in |
|
|
|
|
|
|
|
|
use (1994) |
Sub-Saharan Africa |
1 119 492 |
8.6 |
4.3 |
1.9 |
1 050 083 |
157 608 |
15 |
|
North Africa and Near East |
50 017 |
8.1 |
4.0 |
6.4 |
44 815 |
71 580 |
160 |
|
North Asia, east of Urals |
286 800 |
3.0 |
1.5 |
(2.3) |
275 902 |
175 540 |
64 |
|
Asia and the Pacific |
812 551 |
9.4 |
4.7 |
3.9 |
742 672 |
477 706 |
64 |
|
South and Central America |
1 048 071 |
10.6 |
5.3 |
1.2 |
979 946 |
143 352 |
15 |
|
North America |
463 966 |
9.9 |
4.9 |
(2.1) |
431 488 |
233 276 |
54 |
|
Europe |
363 120 |
10.1 |
5.0 |
(5.8) |
323 903 |
204 322 |
63 |
|
World |
4 144 017 |
8.9 |
4.4 |
2.6 |
3 848 809 |
1 463 384 |
38 |
|
Sources and Notes
Protected land Data from Green and Paine (1997); for the proportion on potential arable land, see text. Settlement Developing regions from Alexandratos (1995), taking forecast populations for 2010. Percentages shown as ( ) are based on 33 ha per 1000 population.
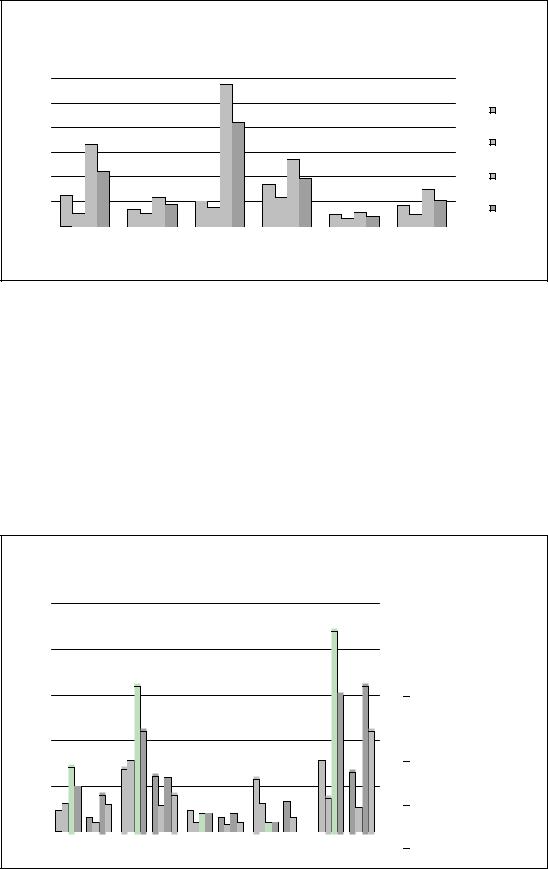
functions of forests are vital to human society, particularly to the welfare of the poor. Secondly, forests provide numerous ecosystem services, of very high economic value (Constanza et al., 1997). In particular, because of the capacity of forests (biomass and forest soils) to store and assimilate carbon dioxide, international opinion is currently strongly opposed to further forest clearance (although the most recent surveys indicate that the rate of forest clearance in the tropics is only slowing slightly (FAO, 1997a)1. It has been estimated that in developing countries, over half the ‘land balance’, of cultivable but non-cultivated land, is occupied by forest. In the two countries with the largest land balances, Brazil and the Congo Democratic Republic, much
FIGURE 19
Land balance in relation to net potential arable land for rainfed agriculture and actual arable land
|
1200 |
|
|
1000 |
|
|
800 |
|
ha) |
600 |
|
(million |
||
400 |
||
Area |
||
|
||
|
200 |
|
|
0 |
|
Sub- |
North Africa |
North Asia, |
Asia and |
South and |
North |
Europe |
|
Saharan |
and Near |
east of |
Pacific |
Central |
America |
|
-200 |
Africa |
East |
Urals |
|
America |
|
|
|
|
|
|
|
|
|

 Net potential arable land

 Actual arable land

 Land balance
1To put tropical forest clearance in perspective, it must be remembered that a high proportion of the forests of Europe, and substantial parts of North America, have been cleared, albeit at earlier dates.
In the UK, 93% of the original forest cover has been cleared.

40 |
Potential arable land for rainfed agriculture |
of this land is occupied by valued rain forest, and this applies also to other countries with large land balances (e.g. Bolivia, Central African Republic, Colombia, Peru, Venezuela). Fischer and Heilig (1998) go so far as to deduct the whole of forest land from the land balance1.
Finally, it must be borne in mind that substantial parts of the actual non-cultivated land is already under agricultural use, as pasture for livestock production2. Converting such land to arable use involves a loss of grazing land; and in some parts of the world such conversion has affected the welfare of communities and peoples dependent on grazing resources.
Land and population
The estimates of actual and potential arable land may be compared with population, past and present, to give a generalized overview of changes in land per caput. The potential arable land was adjusted for its quality by giving a weighting to the suitability classes as follows: Suitable x 0.7, Moderately Suitable x 0.5, Marginal x 0.3. Thus the weighted values give the equivalent areas of Very Suitable land. The comparison may be made in terms of agricultural population (as defined in UN statistics) or total population.
Comparison with agricultural population is relevant to questions concerning the well-being of farmers and the rural community. The right side of Table 16 compares actual arable land with agricultural population for 1965 and 1995. In Europe and North America, and to a lesser degree in South America, the arable land per farmer has increased, as farms have become larger and rural inhabitants migrated to the cities or moved into non-agricultural occupations. A change in
TABLE 16
Actual arable land (1965 and 1995), potential arable land and “equivalent” potential land for agricultural and total population
|
|
Agricultural population |
|
Total population |
||||
|
|
|
Potential |
Equivalent |
|
|
Potential |
Equivalent |
|
1965 |
1995 |
arable land |
potential |
1965 |
1995 |
arable |
potential |
|
|
|
per caput |
arable land |
|
|
land per |
arable land |
|
|
|
agric. |
per caput |
|
|
caput total |
per caput |
|
|
|
population |
total |
|
|
population |
total |
|
|
|
(1994) (ha) |
population |
|
|
(1994) |
population |
|
|
|
|
(1994) (ha) |
|
|
(ha) |
(1994) (ha) |
Africa |
0.86 |
0.47 |
2.8 |
1.9 |
0.62 |
0.26 |
1.64 |
1.11 |
Europe |
2.25 |
4.23 |
4.4 |
3.3 |
0.34 |
0.26 |
0.59 |
0.44 |
South America |
1.17 |
1.88 |
13.8 |
10.0 |
0.49 |
0.37 |
2.87 |
2.09 |
North & C. |
4.95 |
5.41 |
11.7 |
8.3 |
0.85 |
0.59 |
1.35 |
0.97 |
America |
|
|
|
|
|
|
|
|
Asia |
0.36 |
0.24 |
0.5 |
0.4 |
0.25 |
0.15 |
0.27 |
0.20 |
World |
0.78 |
0.59 |
1.6 |
1.1 |
0.42 |
0.23 |
0.74 |
0.53 |
Brazil |
0.72 |
2.14 |
17.7 |
12.7 |
0.37 |
0.40 |
3.5 |
2.5 |
Indonesia |
0.23 |
0.31 |
0.7 |
0.5 |
0.16 |
0.11 |
0.4 |
0.3 |
Nigeria |
0.69 |
0.78 |
1.6 |
1.1 |
0.61 |
0.29 |
0.6 |
0.4 |
China |
0.23 |
0.11 |
0.2 |
0.2 |
0.16 |
0.08 |
0.2 |
0.1 |
Pakistan |
0.57 |
0.31 |
0.1 |
0.1 |
0.34 |
0.15 |
0.0 |
0.0 |
Senegal |
0.78 |
0.37 |
2.2 |
1.5 |
0.65 |
0.27 |
1.6 |
1.1 |
Source: FAO Production Yearbooks 1976 and 1996
1An assumption which implies that only the savannas should be cleared, which is also unacceptable in many respects.
2Statistics on arable land include temporary grassland (under 5 years) but not improved permanent pastures.
Land resource potential and constraints at regional and country levels |
41 |
FIGURE 20
Shifts in actual arable land (1965 and 1995), potential arable land and equivalent potential arable land
|
3 |
|
|
|
|
|
(ha) |
2.5 |
|
|
|
|
1965 |
caput |
2 |
|
|
|
|
|
|
|
|
|
|
|
|
per |
1.5 |
|
|
|
|
1995 |
|
|
|
|
|
||
land |
1 |
|
|
|
|
Potential |
Arable |
|
|
|
|
||
0.5 |
|
|
|
|
arable land |
|
|
|
|
|
|
|
|
|
|
|
|
|
|
Equivalent |
|
0 |
|
|
|
|
potential |
|
|
|
|
|
arable land |
|
|
|
|
|
|
|
|
|
Africa |
Europe |
South America |
North and |
Asia |
World |
|
|
|
|
Central |
|
|
|
|
|
|
America |
|
|
this direction has also taken place in some countries of the developing world, including oilproducing countries and those which have experienced rapid agricultural expansion (e.g. Brazil, Indonesia, Nigeria) through absorption of labour in the non-agricultural sectors. In other parts of the developing world, however, actual arable land has substantially decreased, in Africa by 45% and in Asia by 33%, changes which have been associated with rural poverty and landlessness. This direction of change, illustrated by China, Pakistan and Senegal, is found among numerous predominantly rural developing countries.
Comparison with total population is relevant to one of the major questions facing the developing world, the extent to which regions and countries can provide adequate nutrition for their populations without food imports. The first two data columns of the left side of Table 16 compare actual arable land with total population for 1965 and 1995. In all continental regions there has been a
FIGURE 21
Available arable land (ha) per per caput in selected countries
|
2.5 |
|
|
|
|
|
2 |
|
|
|
|
(ha) |
|
|
|
|
|
arable land |
1.5 |
|
|
|
|
|
|
|
|
|
|
Available |
1 |
|
|
|
|
|
|
|
|
|
|
|
0.5 |
|
|
|
|
|
0 |
|
|
|
|
|
Indonesia |
Nigeria |
China |
Pakistan |
Senegal |

 1965
1965

 1995
1995

 Potential arable land

 Equivalent potential arable land

 Series6

 1965
1965

 1995
1995

 Potential arable land

 Equivalent potential arable land
42 |
Potential arable land for rainfed agriculture |
decrease in land per caput over every five-year period. In Asia this decrease has been 40%, and in Africa more than 50%. These falls apply also to five of the six sample countries shown, with falls to half or less of the 1965 arable area in four of them. The exception is the relatively landrich country of Brazil, where much of the increase has been achieved by clearance of rain forest.
THE RELIABILITY OF ESTIMATES OF AVAILABLE CULTIVABLE LAND
The challenge
The successive estimates, made by FAO and collaborating institutions, of land balances, that is, land which is potentially cultivable but not presently cultivated, have recently been challenged (Young, 1998; 1999a). The arguments presented apply particularly to developing countries, where data are less reliable. In this challenge, the method employed is characterized as “the approach of inventory and difference: assessment of the area cultivable, and subtraction of the area presently cultivated”. It is argued that the approach of inventory and difference greatly exaggerates the land balance, namely land which is cultivable but not presently cultivated, for three reasons:
•Over-estimation of cultivable land.
•Under-estimated of presently cultivated land.
•Failure to take sufficient account of land required for purposes other than cultivation.
The over-estimation of cultivable land arises through loss of non-cultivable areas (e.g. hills, rock outcrops, minor water bodies) when detailed soil maps are reduced to the smaller scales of national maps and the Soil Map of the World. Under-estimation of presently cultivated land occurs because governments often do not report illegal cultivation (e.g. shifting cultivation, incursions into protected areas). It is noted also that more than half the data for actual cultivation as reported in the FAO Production Yearbook carry the qualification “F”, meaning based on FAO estimates (as opposed to surveys or censuses); and that FAO has, on occasion, made substantial ‘adjustments’ to data on cultivated areas, sometimes increasing the original data by as much as 30% (Young, 1998; 1999b). With respect to land required for purposes other than cultivation, the estimates for protected land are accepted, but it is asserted that land taken up by human settlements (which includes not only housing but also, for example, industry and transport, recreation, military purposes) is currently under-estimated and is likely to increase, in per capita terms, in the future. Young (1999a) cites 24 countries for which, on the basis of field experience, he believes that the land balances are greatly over-estimated.
An example which illustrates the discrepancy between the assessed and observed land balance is Malawi. In this present study (see Appendix A5a), Malawi is reported as having potential arable land 6835 thousand hectares, actual arable (as at 1994) 1700, and thus only 25% of the potential land is cultivated. This was tested during a field reconnaissance tour, which found virtually no ’spare’ land in the more crowded southern and central regions, and very limited areas, almost all on steeply-sloping land, in the northern region (Young, 1999b).
A provisional adjustment is made, taking a hypothetical (developing) country with a land balance of 50%, i.e. cultivable land is reported as twice the area of presently cultivated land. Using approximate adjustments for the three sources of error given above, the land balance is reduced to 23-35%, or if it assumed to be desirable to preserve forest on some 10-20% of cultivable land, then “an original gross land balance of 50% is reduced to a realistic area of between 3% and 25%” (Young, 1999a). A reduction of this order of magnitude produces results