СЭГ Мира / 1 семестр / ПРАКТИКУМ СЭГ мира,часть 1 / ХРЕСТОМАТИЯ электронная / 08 CХ+УДОБРЕНИЯ / wsr
.pdfLand resource potential and constraints at regional and country levels |
13 |
There is a large body of research, published studies and technical manuals on control of soil erosion, including many produced by FAO (e.g. FAO 1977, 1987, 1991). The former focus on earth structures (bunds, terraces, etc.) has given way to the present approach (often known as better land husbandry) which places great emphasis on acceptance and adaptation of conservation practices by local farming communities, as well as on the use of biological methods (e.g. agroforestry) (Shaxson et al., 1989; Douglas, 1994). There is much to be learnt from indigenous soil conservation methods (FAO et al., 1998c). It is clearly recognized that the physical circumstances giving rise to a high potential erosion hazard, as identified here, are not the sole cause of erosion; equally important are the social and economic conditions of land users which may force them to cultivate (or graze upon) unsuitable land, or which fail to provide them with incentives for conservation. Since the circumstances of erosion, and the perceived benefits from adoption of conservation measures, vary so widely with site-specific physical, social and economic conditions, there is much scope for closer dialogue between concerned institutions and land users.
SOILS WITHOUT MAJOR CONSTRAINTS
A range of soils exists which are not affected by any of the eight major constraints covered above. Some fall into the dryland zone, discussed below, and others possess constraints within the soil fertility capability classification which are not included above, because they are either less severe or of relatively low extent.1 These certainly cannot be called ‘soils without problems’, as any farmer would testify! Based on the method by which these have been identified, they may be referred to simply as soils without major constraints.
In terms of the classes shown on the Soil Map of the World, the soils without major constraints fall particularly, but not entirely, into the major soil groups of Chernozems, Kastanozems, Nitisols, Luvisols, Phaeozems and Cambisols.
Just under a quarter of the world’s land area has soils which lack the eight major constraints of the fertility capability classification (Table 3). North Asia (east of the Urals) has the largest total and relative extent, caused particularly by the broad belt of Chernozems and Kastanozems which stretches across the region. The Asia-Pacific region and North America have the next highest total
extents of such soils, and six of the eight regions have between 18 and 31%. The exception is North Africa and the Near East with only 9%, to which must be added the constraint of dryness which affects most of the region.
A notable feature of the country-level results is that 22 of the 36 countries with over 40% soils without major constraints lie in Europe. This includes the extension of the ChernozemKastanozem belt into the Ukraine and adjacent countries. Among non-European countries, the
1These additional constraints are: acidity; dominance of allophane in the clay fraction (Andosols); potassium-deficiency; free calcium carbonate; acid sulphate soils (cat clays). Dryness (an ustic or xeric soil moisture regime) is also recognized by the fertility capability classification as a soil limitation.
14 |
Soil constraints |
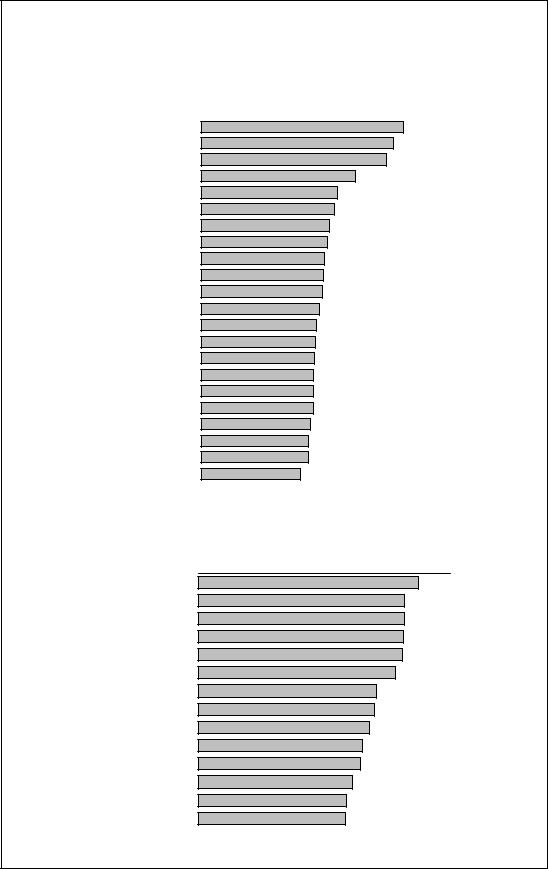
FIGURE 9
Countries with >40% of soils without major constraints: (a) Europe; (b) non-Europe
(a) Europe |
0 |
20 |
40 |
60 |
80 |
100 |
||
|
|
|
|
|
|
|
|
|
Malta
Moldova
Ukraine
Azerbaijan
Armenia
France
Belgium
Belarus
Denmark
Bulgaria
Bosnia Herzegovina
Turkey
Croatia
Czech Republic
Georgia
Romania
Slovenia
Greece
Albania
Cyprus
Lithuania
Latvia
(b) Non-Europe |
0 |
10 |
20 |
30 |
4 0 |
50 |
60 |
70 |
Gambia
Japan
Philippines
Korean Dem. Rep.
Lesotho
Jamaica
Dominican Republic
Haiti
El Salvador
Korean Rep.
Russian Federation
Mozambique
India
Benin
Land resource potential and constraints at regional and country levels |
15 |
greatest total extent by far is found in the Russian Federation (7.7 M km2). Next in order of absolute area are the United States, Canada, China, Australia, India and Argentina. There is a striking coincidence between countries with high total areas of soils without major constraints and the world’s leading grain-producing and exporting countries. Some of the smaller nonEuropean countries listed suggest, to those with personal knowledge of these countries, anomalies in the data.
16 |
Soil constraints |

Land resource potential and constraints at regional and country levels |
17 |
Chapter 3
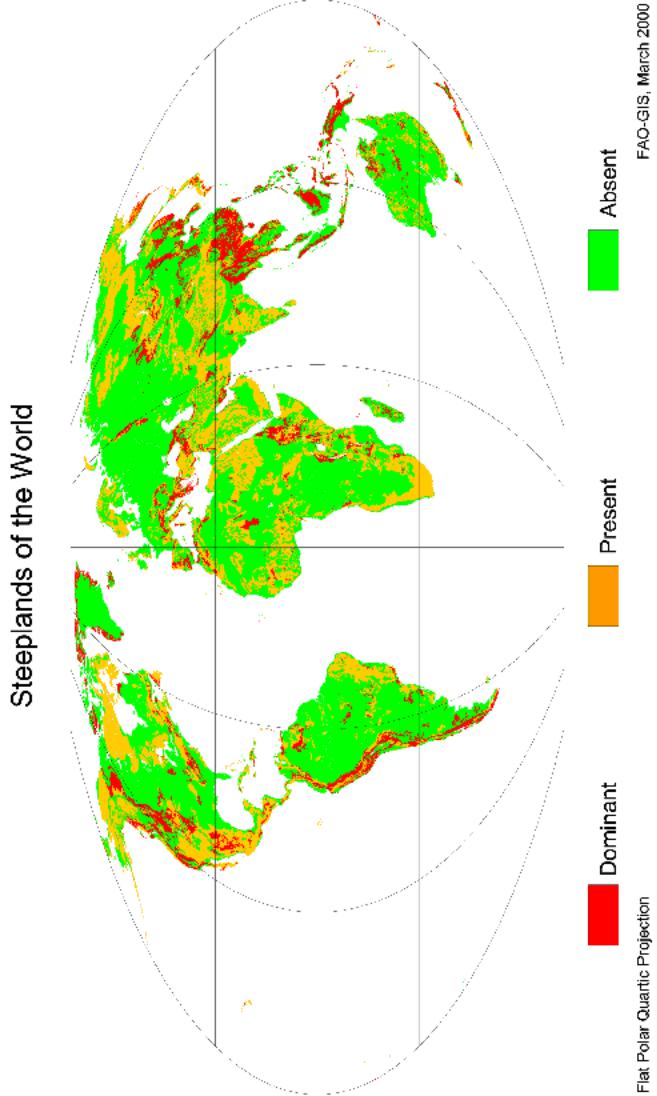
Drylands and steeplands
In Agenda 21, the programme of action arising out of the 1992 UN Conference on Environment and Development (UNCED, 1992), two sets of environmental conditions are identified as fragile ecosystems, namely drylands and mountain regions1. Drylands are described as such primarily because of their desertification hazard. Mountain regions are identified as fragile through a combination of problems, combining erosion hazard with forest clearance and other forms of land degradation. The special problems of these two types of environment, brought about respectively by climate and landforms, are additional to their soil constraints.
DRYLANDS
All the major continents face problems of land degradation in dryland areas, commonly known as desertification2. Dryland areas are ‘fragile’ in that they are extremely vulnerable to land degradation resulting from over-grazing and other forms of inappropriate land use. There have been a number of previous attempts to map desertification hazard (UNEP, 1984) and actual desertification (Middleton and Thomas, 1997). Here, an attempt is made to identify dryland conditions and desertification hazard in a similar manner to the soil constraints, estimating their world and regional extents, together with the countries most affected. Also identified are countries in which significant concentrations of population are found within drylands, extending previous work at the regional scale (Nachtergaele et al., 1996; UNSO-UNDP, 1997).
Methods
In the earlier FAO work, directed primarily at the tropics, agro-ecological zones were defined on the basis of length of growing period for annual crops, taken as the period during which the soil profile remained humid and temperature permitted crop growth (FAO, 1978). Since in temperate latitudes it is primarily temperature that restricts the growing period, it was necessary to redefine the length of growing period, taking the temperature factor into account in more detail (e.g. various temperature limits are used to define periods of dormancy and of killing frosts). This study makes use of the climatic database developed by Leemans and Cramer (1991), and identifies the length of growing period as limited both by temperature and soil moisture, based on the method of Fischer et al. (1995).
The results have been grouped into four classes of length of growing period (LGP):
1Agenda 21 also describes wetlands, small islands, and coastal areas as fragile ecosystems.
2Following the first UN Conference on Desertification in 1977, the term ‘desertification’ came to be loosely applied, sometimes to all forms of land degradation, and was subject to exaggerated claims. It is now defined as land degradation in arid, semi-arid and dry subhumid areas (UNEP, 1997)

Land resource potential and constraints at regional and country levels |
19 |
• |
Hyperarid: |
LGP zero days |
• |
Arid: |
LGP 1-59 days |
• |
Semi-arid: |
LGP 60-119 days |
• |
Dry subhumid: |
LGP 120-179 days |
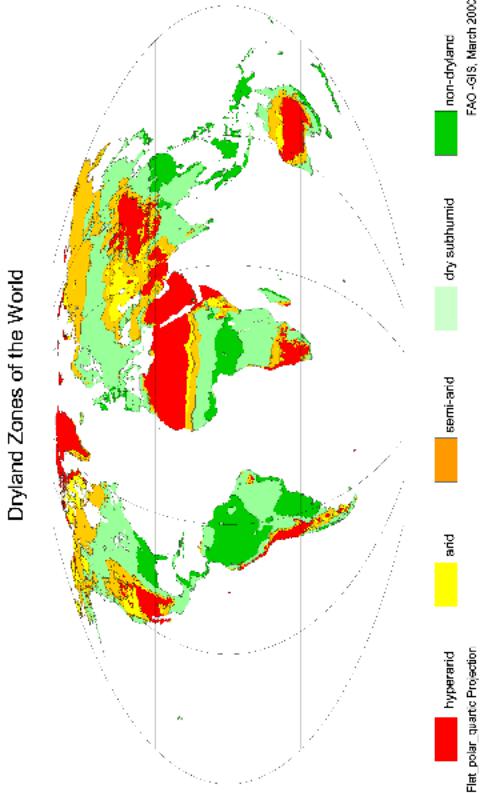
The concept of drylands continues to be debated (Eswaran, 1998). In this study, drylands are taken as areas with a potential hazard of desertification. The hyperarid zone is not subject to desertification and is therefore excluded. Hence drylands are defined as the arid, semi-arid and dry subhumid zones, or areas with lengths of growing periods of 1-179 days.
Results
The hyperarid, or extreme desert, environment covers 25.6 M km2, or 19% of the global land surface.
Drylands vulnerable to desertification cover 45% of the global land surface, with 7, 20 and 18% respectively in the arid, semi-arid and dry subhumid zones. The North Asia (east of Urals) region is dominated by dryland conditions (95%), but all regions have substantial parts of their land resources in the arid to semi-arid zones (Figure 10).
FIGURE 10
Percentage of total land area taken up by desert and dryland areas per region
100 |
|
|
|
|
|
|
|
80 |
|
|
|
|
|
|
|
60 |
|
|
|
|
|
|
|
40 |
|
|
|
|
|
|
|
20 |
|
|
|
|
|
|
|
0 |
|
|
|
|
|
|
|
Sub- |
North |
North Asia, |
Asia and |
South and |
North |
Europe |
World |
Saharan |
Africa and |
east of |
Pacific |
Central |
America |
|
|
Africa |
Near East |
Urals |
|
America |
|
|
|

 dry subhumid

 semi-arid

 arid
arid

 hyperarid
TABLE 4
Area of drylands by length of growing period zone and region
|
Hyperarid |
Arid |
Semi-arid |
Dry |
Drylands |
|
|
|
|
subhumid |
(total) |
|
% of total |
% of total |
% of total area |
% of total |
% of total area |
|
area |
area |
|
area |
|
Sub-Saharan Africa |
24 |
6 |
13 |
19 |
38 |
North Africa & Near East |
78 |
4 |
11 |
5 |
20 |
North Asia, east of Urals |
1 |
11 |
51 |
33 |
95 |
Asia and Pacific |
24 |
6 |
15 |
17 |
38 |
South & Central America |
9 |
11 |
6 |
10 |
45 |
North America |
7 |
12 |
28 |
23 |
63 |
Europe |
0 |
<0.5 |
13 |
16 |
29 |
World |
19 |
7 |
20 |
18 |
45 |

20 |
Drylands and steeplands |
TABLE 5
Population density by length of growing period zone and region
|
Hyperarid |
Arid |
Semi-arid |
Dry |
Drylands |
|
|
|
|
subhumid |
(total) |
Sub-Saharan Africa |
4 |
7 |
19 |
30 |
22 |
North Africa & Near East |
13 |
36 |
45 |
81 |
52 |
North Asia, east of Urals |
12 |
7 |
5 |
14 |
8 |
Asia and Pacific |
12 |
17 |
39 |
147 |
84 |
South & Central America |
12 |
13 |
15 |
32 |
24 |
North America |
6 |
2 |
3 |
6 |
4 |
Europe |
0 |
21 |
56 |
65 |
61 |
World |
6 |
2 |
10 |
26 |
28 |
FIGURE 11
Population density in desert and dryland areas
150
Populationdensity |
50 |
|
|
|
|
|
|
|
|
|
|
|
|
|
|
|
|
|
|
|
|
|
|
|
|
|
|
|
|
|
|
|
|
|
|
|
|
|
|
|
100 |
|
|
|
|
|
|
|
|
|
|
|
|
|
|
|
|
|
|
|
|
|
|
|
|
|
|
|
|
|
|
|
|
|
|
|
|
|
|
|
|
|
|
|
|
|
|
|
|
|
|
|
|
|
|
|
|
|
|
|
|
|
|
|
|
|
|
|
|
|
|
|
|
|
|
|
|
|
|
|
|
|
|
|
|
|
|
|
|
|
|
|
|
|
|
|
|
|
|
|
|
|
|
|
|
|
|
|
|
|
|
|
|
|
|
|
|
|
|
|
|
|
|
|
|
|
|
|
|
|
|
|
|
|
|
|
|
|
|
|
|
|
|
|
|
|
|
|
|
|
|
|
|
|
|
|
|
|
|
|
|
|
|
|
|
|
|
|
|
|
|
|
|
|
|
|
|
|
|
|
|
|
|
|
|
|
|
|
|
|
|
|
|
|
|
|
|
|
|
|
|
|
|
|
|
|
|
|
|
|
|
|
|
|
|
|
|
|
|
|
|
|
|
|
|
|
|
|
|
|
|
|
|
|
|
|
|
|
|
Sub-Saharan Africa
North Africa &Near East
North Asia, east of Urals
Asia and Pacific
 South and Central America
North America
Europe
World
0 |
|
|
|
hyperarid |
arid |
semi-arid |
dry subhumid |
It is not always appreciated how substantial a proportion of the world’s population lives in drylands. Approximately 1.7 thousand million people, or 38% of the world’s population, live in the arid, and the dry and moist semi-arid zones, and a further 270 million (6%) in the hyperarid zone. In the first comprehensive attempt to estimate the population carrying capacity, completed in the early 1980s, a notable feature of the maps and country results was how frequently the semi-arid zone was assessed as ‘critical’, that is, having current or future populations in excess of their capacity for food production (FAO/UNFP/IIASA, 1983; FAO, 1984).
Two approximate indicators of desertification risk, based on area and population respectively, have been produced by the Office to Combat Desertification and Drought (UNSO/UNDP, 1997). These are:
•area of drylands as a percentage of agriculturally productive land;
•population on drylands as a percentage of population on agriculturally productive land;
where: |
drylands = arid + dry semi-arid +moist semi-arid zones; |
|
agriculturally productive land = total land area – hyperarid zone. |
These indicators are shown for countries in Appendix 3, Tables A3a-g. A summary at regional level is given in Table 6.
Land resource potential and constraints at regional and country levels |
21 |
TABLE 6
Desertification risk and population level by region
Desertification risk (UNSO, 1997)
|
Population in |
Based on area of |
Based on population on |
|
drylands (%) |
drylands (%) |
drylands (%) |
Sub-Saharan Africa |
36 |
50 |
37 |
North Africa & Near East |
44 |
91 |
79 |
North Asia, east of Urals |
89 |
96 |
89 |
Asia and Pacific |
44 |
50 |
46 |
South & Central America |
24 |
19 |
25 |
North America |
19 |
68 |
19 |
Europe |
18 |
29 |
19 |
World |
38 |
57 |
41 |
Based on these indicators, 57% of the world’s potentially productive area is located in drylands, which carry 41% of world population. On the criterion based on area, over 90% of North Africa and the Near East are vulnerable to desertification, and at least 50% of land in four of the seven regions. On the criterion based on population, North Asia (east of the Urals) has an even higher risk than North Africa and the Near East.
At country level, in order to prevent exaggeration of desertification risk, countries lying largely or entirely in the hyperarid zone were first assigned a risk of zero. These nine countries are listed in Table 7.
Having excluded the hyperarid zone, desertification risk at country level was assessed on the two criteria above (Appendix 3, Table 3a-g). Globally, 25 countries have over 90% of their potentially productive land located in drylands, of which 12 have 100% (Table 8). Based on the criterion of population, 23 countries have >90% of their people living in drylands.
TABLE 7
Countries with >95% of territory in the hyperarid zone
Djibouti |
Kuwait |
Egypt |
Oman |
Libya |
Qatar |
Western Sahara |
Saudi Arabia |
|
United Arab Emirates |
TABLE 8
Countries with high vulnerability to desertification
Drylands 100 % of agriculturally productive area
Afghanistan |
Jordan |
Pakistan |
Armenia |
Mauritania |
Senegal |
Botswana |
Mongolia |
Somalia |
Cyprus |
|
Zimbabwe |
|
Drylands 90-100% of |
agriculturally productive area |
|
|
Botswana |
Senegal |
Iraq |
Mongolia |
Cyprus |
Chad |
Somalia |
Jordan |
Armenia |
Finland |
Eritrea |
Gambia |
Syria |
Pakistan |
Israel |
Mali |
Zimbabwe |
Yemen |
Uzbekistan |
Iran |
Mauritania |
Afghanistan |
Kazakhstan |
Namibia |
Macedonia |
Population on drylands >90% total population
Botswana |
Namibia |
Afghanistan |
Yemen |
Cyprus |
Burkina Faso |
Niger |
Iran |
Kazakhstan |
Israel |
Chad |
Somalia |
Iraq |
Mongolia |
Macedonia |
Eritrea |
Zambia |
Jordan |
Pakistan |
|
Mauritania |
Zimbabwe |
Libya |
Armenia |
|