

ppl_04_e2
.pdfID: 3658
Customer: Oleg Ostapenko E-mail: ostapenko2002@yahoo.com
Customer: Oleg Ostapenko E-mail: ostapenko2002@yahoo.com
C H A P T ER 2 : A T M O S P H ER
Figure 2.8, on the other hand, shows a fictional example of reported mean sea level pressures from meteorological stations across the Earth’s surface.
Figure 2.8 Pressure values at different locations, referenced to Mean Sea-Level.
To produce a Mean Sea Level Pressure Chart from the figures given in Figure 2.8, lines are drawn connecting all the stations with the same pressure readings. (See Figure 2.9.) These lines are called isobars (from Greek isos meaning equal and baros meaning weight).
Figure 2.9 Lines connecting locations of equal atmospheric pressure are called isobars.
From the pressure values and isobars, relative areas of low and high atmospheric pressure can be identified. Isobars centred on an area of low pressure values indicate a low pressure area, and isobars centred on an area of relatively higher pressure values indicate an area of high pressure. The dimensions of these high and low pressure area systems can range from tens of nautical miles wide to hundreds, and sometimes a thousand miles wide.
Low pressure areas are known as depressions. High pressure areas are known as anticyclones.
Around the British Isles, the pressure at mean sea-level fluctuates between extremes of 950 millibars and 1050 millibars, but is usually around 1 000 millibars.
An isobar is a
line drawn on a chart joining
points of equal atmospheric pressure at a given level.
Low pressure
areas are also called
depressions.
High pressure areas are also known as anticyclones.
17

Order: 6026
Customer: Oleg Ostapenko E-mail: ostapenko2002@yahoo.com
Customer: Oleg Ostapenko E-mail: ostapenko2002@yahoo.com
C H A P T ER 2 : A T M O S P H ER IC P R ES S U R E
THE PRESSURE GRADIENT FORCE.
The isobars themselves can reveal a great deal of useful information. Air will always tend to move from an area of high pressure to an area of low pressure. Consequently, a force exists which acts from the high pressure regions to the low pressure regions. This force is called the pressure gradient force. The direction of action of the pressure gradient force is shown in Figure 2.10.
Tightly spaced isobars
indicate strong winds. Widely
spaced isobars indicate light winds.
Figure 2.10 The force acting from the high pressure area (H) to the low pressure area (L) is called the P r e s s u r e G r. a d i e n t F o r c e
The spacing between isobars is indicative of the relative strength of the pressure gradient force.
Isobars may be compared to contour lines on a topographical map, where the contour line spacing indicates the gradient of a slope. Closely spaced isobars show a large change in the pressure over a short distance, indicating the presence of a large pressure gradient force; this is common within low pressure areas. Widely spaced isobars show a small change in the pressure over a large distance, indicating a small pressure gradient force; this is common within high pressure areas. Wind speed and direction will be discussed in greater detail in Chapter 12.
VERTICAL PRESSURE VARIATION.
The relative number and distribution of air molecules shown in Figure 2.11, opposite, indicates that the higher an aircraft climbs in the atmosphere, the smaller will be the mass of air above the aircraft, and, therefore, the lower will be the atmospheric pressure exerted on the aircraft. So, as we have already mentioned, atmospheric pressure decreases with increasing altitude.
Atmospheric pressure falls very quickly with altitude near the Earth’s surface, but, at high altitude, the rate of pressure reduction with height is much less marked. This is because most of the air is located close to the Earth’s surface.
18

ID: 3658
Customer: Oleg Ostapenko E-mail: ostapenko2002@yahoo.com
Customer: Oleg Ostapenko E-mail: ostapenko2002@yahoo.com
C H A P T ER 2 : A T M O S P H ER
Figure 2.11 Pressure decreases with altitude. The rate at which pressure decreases with altitude also falls as altitude increases.
In the ICAO Standard Atmosphere (ISA), the fall in pressure with height, close to sealevel, is approximately 1 millibar for every 27 feet. However, at 10 000 feet the rate of pressure decrease with altitude is less, being approximately 1 millibar for every 36 feet gain of height.
For the purposes of pressure versus height calculations, it is assumed that the average change of pressure with height, below the Tropopause, is 1 millibar for every 30 feet.
The significance of pressure variations horizontally and vertically, will be covered in detail in the chapters on Pressure Systems, Wind, and Altimetry.
Pressure
decreases with increasing
height but the
rate of pressure decrease with height is lower at higher
altitudes.
For
calculations involving
pressure
versus height, assume that 1 mb = 30 ft,in the lower atmosphere.
T h e Ef f e c t o f T e m p e r a t u r e o n V e r t i c a l P r e s s u |
||||
However, even in identical atmospheric layers, the rate of pressure change with |
Temperature |
|||
altitude is not always constant. Sometimes, pressure falls more rapidly with increasing |
||||
affects the |
|
|
||
altitude than at other times. The reason for this is the variations in temperature over |
|
|
||
rate at which |
||||
the Earth’s surface. In Figure 2.12 you will see three different columns of air. For |
||||
pressure |
||||
simplicity, we have included only six molecules of air per column. |
decreases with altitude. In |
|||
cold air, the rate of pressure decrease with altitude is greater than in warm air.
Figure 2.12 Cold air causes pressure to fall more rapidly with height. Warm air causes pressure to fall more slowly with height.
19

Order: 6026
Customer: Oleg Ostapenko E-mail: ostapenko2002@yahoo.com
Customer: Oleg Ostapenko E-mail: ostapenko2002@yahoo.com
C H A P T ER 2 : A T M O S P H ER IC P R ES S U R E
Examine the column in the middle of Figure 2.12, which we will assume represents a “normal” atmosphere. As there are six molecules represented in each column, we will express the pressure at the Earth’s surface, caused by the column of air, as six units. However, at high altitude, there are only two molecules, so we will express the atmospheric pressure at high altitude, in this column, as two units.
Now, look at the left hand column of air in Figure 2.12. Here, the air is colder, and, as a result, the air has become denser, with the air molecules collecting at the bottom of the column. Surface pressure is still six units, because there are still six molecules bearing down on the surface. However, because the air in this column is cold, there are no molecules at all at altitude; so pressure at altitude in this column, is approaching zero units. You can now see that cold air has caused the pressure to decrease much more rapidly with height than in the warmer air of the “normal” atmosphere. You will not be surprised to find that the opposite is true when the air is warmer than normal.
Examine the column of air on the right. Since this column represents warmer than normal air, the molecules have risen to the top of the column. There are still six molecules above the surface, so the pressure at the surface is still six units, but at altitude there are now four molecules; so pressure at altitude, in this column is ‘four units’.
Notice how the warm air has caused the pressure to decrease with altitude much more slowly than normal.
In cold air, the rate of
pressure decrease with
altitude is higher than in warm air.
Figure 2.13 Cold air compacts pressure levels and warm air expands pressure levels.
The effect that temperature has on pressure change with height can also be shown in another way. Figure 2.13 depicts a column of cold air on the left, and a column of warm air on the right. Notice that, since cold air causes pressure to fall more rapidly with height, the pressure levels in the cold air column are compressed towards the Earth’s surface, whereas, in the warm air column, they expand away from the surface.
20

ID: 3658
Customer: Oleg Ostapenko E-mail: ostapenko2002@yahoo.com
Customer: Oleg Ostapenko E-mail: ostapenko2002@yahoo.com
C H A P T ER 2 : A T M O S P H ER
T h e Ef f e c t o f T e m p e r a t u r e o n A l t i m e t e r R e a d i
The altimeter is calibrated in ISA conditions, so, if the temperature is other than the ISA value, the altimeter indication will be in error. You have already learnt that pressure changes with altitude at different rates, depending on the temperature of the air. Therefore, an altimeter is subject to temperature error.
So, the altimeter will read correctly only when ISA conditions prevail, which is almost never. However, altimeter temperature errors are not excessive.
The principle of altimeter temperature error is described briefly below.
In the ISA, if the atmospheric pressure were to be 300 millibars (or hectopascals), an altimeter would register a height of 30 000 ft. (See Figure 2.14.) However, if the atmosphere were to be colder than ISA, as shown on the left of Figure 2.14, the 300 millibar pressure level would be at a lower true altitude than 30 000 ft. But, because the altimeter has been calibrated to ISA, it would still read 30 000 ft at the 300 millibar level. The altimeter is, however, clearly in error, as the true altitude of the altimeter in the column of cold air is less than 30 000 ft. In the column of cold air, therefore, the altimeter is over-reading.
When flying from warm air into cold air,
the altimeter
will over-read, indicating that the aircraft is higher than it actually is.
Figure 2.14 Cold air causes the altimeter to over-read. Warm air causes the altimeter to under-read.
If the air were to be warmer than ISA, as shown on the right of Figure 2.14, the 300 millibar pressure level would be higher than its 30 000 ft level in ISA. Nevertheless, in warmer air, an altimeter calibrated to ISA would continue to read 30 000 ft at the 300 millibar level, even though the altimeter was clearly higher than the true altitude of 30 000 ft. Here, then, in the column of warm air, the altimeter is under-reading.
A useful phrase to recall in order to remember what you have just learnt is: “from warm to cold, don’t be bold”. Another way to remember this is to use “Hi-lo-hi, from high to low, altimeter reads high”. This phrase refers to the fact that when flying from warm air into cold air, the altimeter will over-read, giving the impression that you are at a higher altitude than you actually are. This situation obviously has inherent risks. For example, if you were at an altitude of 2 000 feet, with an outside temperature of -10ºC, well below the ISA value for that altitude, your altimeter would be over-reading by about 200 feet.
21

Order: 6026
Customer: Oleg Ostapenko E-mail: ostapenko2002@yahoo.com
Customer: Oleg Ostapenko E-mail: ostapenko2002@yahoo.com
C H A P T ER 2 : A T M O S P H ER IC P R ES S U R E Q U ES T IO NS
R |
e p r e s e n t a t i v e |
P P L - t y p e q u e s t i o n s |
k n o w l e d g e o f A |
t m o s p h e r i c P r e s s u r e |
|
1.What effect does cold air have on the vertical distribution of isobars?
a.It compacts them
b.It expands them
c.It has no effect on them
d.It raises them
2.A line drawn on a chart joining locations of equal barometric pressure at the same level is:
a.An isotherm
b.An isogonal
c.A contour
d.An isobar
3.What do tightly-spaced isobars indicate?
a.A steep pressure gradient and strong winds
b.A weak pressure gradient and light winds
c.A weak pressure gradient and strong winds
d.A steep pressure gradient and light winds
4.The pressure of the atmosphere:
a.decreases at an increasing rate as height increases
b.decreases at a constant rate as height increases
c.decreases at a decreasing rate as height increases
d.decreases at a constant rate up to the Tropopause and then remains constant
5.Compared to ISA, how does warm air affect the vertical distance represented by 1 hPa change in pressure?
a.Increases it
b.Decreases it
c.Not at all
d.It is impossible to determine
6.What is the name of the instrument which gives a continuous printed reading and record of variations in atmospheric pressure?
a.Barometer
b.Hygrometer
c.Anemograph
d.Barograph
Question |
1 |
2 |
3 |
4 |
5 |
6 |
|
|
|
|
|
|
|
Answer |
|
|
|
|
|
|
T h e a n s w e r s t o t h e s e q u e s t i o n s c a n b e
22
Customer: Oleg Ostapenko E-mail: ostapenko2002@yahoo.com
CHAPTER 3
ATMOSPHERIC DENSITY
23

Order: 6026
Customer: Oleg Ostapenko E-mail: ostapenko2002@yahoo.com
Customer: Oleg Ostapenko E-mail: ostapenko2002@yahoo.com
C H A P T ER 3 : A T M O S P H ER IC DENS IT Y
24

ID: 3658
Customer: Oleg Ostapenko E-mail: ostapenko2002@yahoo.com
Customer: Oleg Ostapenko E-mail: ostapenko2002@yahoo.com
C H A P T ER 3 : A T M O S P H
ATMOSPHERIC DENSITY.
Density is defined as: “mass per unit volume”. Air density is a measure of how much mass of air is contained within a given volume of air. Atmospheric density is commonly expressed in terms of grams per cubic metre, or in kilograms per cubic metre. In the ICAO Standard Atmosphere (ISA), at mean sea-level, the density of the atmosphere is described as 1 225 grams per cubic metre (gm/m3).
FACTORS AFFECTING ATMOSPHERIC DENSITY.
A number of factors affect atmospheric density. These factors are: pressure, temperature, altitude, and the quantity of water vapour within a given mass of air.
Density is
defined as mass per unit
volume. The
density of air at sea level in the ICAO Standard Atmosphere is 1 225 gm/m³.
T h e V a r i a t i o n o f A i r De n s i t y w i t h P r e s s u r e .
Atmospheric
density is directly
proportional
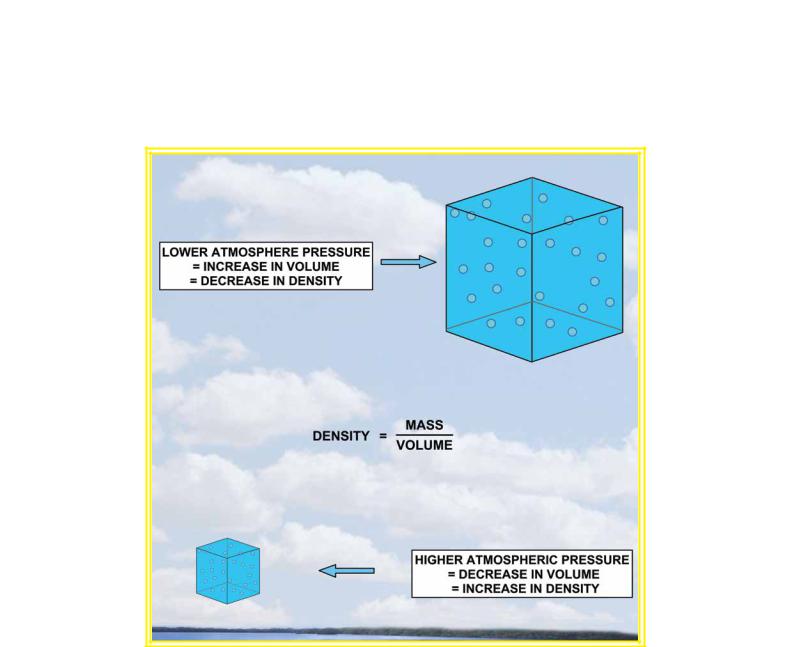
to atmospheric pressure. An increase in air pressure will increase the density of air. A decrease in air pressure will reduce the density of the air.
Figure 3.1 Atmospheric Density is directly proportional to atmospheric pressure.
Figure 3.1 depicts two identical air masses contained within different volumes. At the lower left of the diagram, because the atmospheric pressure surrounding the volume of air is high, the volume of air is compressed, and the density of the air within the “air parcel” that we are considering is relatively high. On the upper right, the atmospheric pressure surrounding an identical mass of air is lower. The molecules of air within this second parcel of air, and which are in constant motion, therefore occupy an expanded volume. Thus, we have the same number of air molecules in a greater volume of air. The density of this second parcel of air is, consequently, relatively low.
25

Order: 6026
Customer: Oleg Ostapenko E-mail: ostapenko2002@yahoo.com
Customer: Oleg Ostapenko E-mail: ostapenko2002@yahoo.com
C H A P T ER 3 : A T M O S P H ER IC DENS IT Y
An increase in temperature
will reduce the density of
a parcel of air. A decrease in temperature will increase the density of the air.
Physical experiments confirm that density is directly proportional to pressure. As atmospheric pressure increases, density increases. As atmospheric pressure decreases, density decreases.
T h e V a r i a t i o n o f A i r De n s i t y w i t h T e m p
Changes in temperature will affect atmospheric density.
If a ‘parcel’ of air is heated, the energy of the molecules of air increases and they move about more rapidly, causing the parcel of air to expand, thus reducing the density of the air. Conversely, if the ‘parcel’ of air is cooled, the air molecules move around less vigorously and the air parcel shrinks in volume, causing air density to increase.
Therefore, density is inversely proportional to temperature. The lower the temperature of air, the greater is its density. The higher the air temperature, the lower is the density of the air.
T h e V a r i a t i o n o f A i r De n s i t y w i t h A l t i t
We have already established that, in the Troposphere, as altitude increases atmospheric temperature falls. Therefore, given the above observations on the effect of temperature on atmospheric density, we might expect density to increase with increasing altitude. However, as altitude increases, atmospheric pressure falls, and, as we have seen, this causes air density to decrease. So what is the net effect of increasing altitude on air density? The dominant effect on the atmosphere is the change in atmospheric pressure. The fall in pressure reduces air density more than the decrease in temperature causes air density to increase.
Air density decreases with altitude.
Figure 3.2 Air density decreases with altitude, but the rate of decrease also decreases with altitude.
Consequently, as altitude increases, air density decreases. However, as shown in Figure 3.2, in the same way as air pressure, air density decreases with altitude, at a decreasing rate.
T h e Ef f e c t o f W a t e r V a p o u r o n A i r De n s
As explained in the Chapter 1, the proportion of water vapour in the atmosphere is small but without it, there would be no weather.
The amount of water vapour present in a ‘parcel’ of air will affect air density.
26