

ppl_04_e2
.pdfID: 3658
Customer: Oleg Ostapenko E-mail: ostapenko2002@yahoo.com
Customer: Oleg Ostapenko E-mail: ostapenko2002@yahoo.com
C H A P T ER 3 : A T M O S P H
The density of water vapour is lower than the density of the other constituent gases in a sample of dry air. Therefore, the more water vapour there is in a “parcel” of air to displace the denser gases, the lower will be the density of that “parcel” of air. In other words, the more humid a given volume of air, the lower is its density.
An increase in humidity will reduce the density of air.
T h e Ef f e c t s o f R e d u c e d A i r De n s i t y o n A i r c r a f
So far, it has been shown that high altitude, high temperature and high humidity will cause air density to decrease. Because changes in atmospheric density affect aircraft performance, it is, therefore, vital that pilots understand the nature and extent of this phenomenon.
Lift is directly proportional to air density; therefore, a reduction in air density will |
|
|
|
|
cause a reduction in lift. This is a performance-reducing characteristic that is not |
|
|
|
|
immediately obvious, and may be explained as follows. |
|
|
|
|
For an aircraft to fly there needs to be a certain amount of lift generated by the |
|
|
|
|
wings. Now, the amount of lift generated depends on the mass flow of air around |
|
|
|
|
the wings. If the rate of mass flow of air around the wings reduces, because the air |
|
|
|
|
is less dense, then, to recover the loss in the lift force the aircraft will have to travel |
|
|
|
|
faster in order to restore the required amount of mass flow of air around the wings. |
|
|
|
|
This effect is especially important in the take-off phase of flight. Achieving a higher |
|
|
|
|
take-off speed in conditions of low air density will require a greater length of runway. |
|
|
|
|
Consequently, extra care in flight planning must be taken when operating in low |
|
|
|
|
density environments. |
|
|
|
|
Air density affects piston engine performance, too. The lower the density of air, |
|
|
|
|
A reduction |
||||
the less oxygen there will be in any given volume of air. Oxygen is essential for |
||||
in air density |
|
|
||
combustion to take place, and, therefore, a reduction in air density will cause a |
|
|
||
will lead to |
||||
reduction in engine power. The combined effect on engine and wing efficiency of |
a reduction |
|||
reduced atmospheric density obviously needs to be accounted for by the pilot in his |
in aircraft performance, and |
|||
performance calculations. |
vice-versa. |
|||
Figure 3.3 Short field take-off distance graph for a PA-28-161 Warrior.
27

Order: 6026
Customer: Oleg Ostapenko E-mail: ostapenko2002@yahoo.com
Customer: Oleg Ostapenko E-mail: ostapenko2002@yahoo.com
C H A P T ER 3 : A T M O S P H ER IC DENS IT Y
Most density changes can be accounted for by using performance graphs, such as the take-off distance graph, depicted in Figure 3.3 on the previous page, which incorporate altitude and temperature parameters. (See highlighted values in Figure 3.3) Note that the input parameters required by the graph are pressure altitude and temperature, which, together, give us density altitude.
Pressure altitude and density altitude are explained later in the chapter.
RELATIVE DENSITY.
The atmospheric density at mean sea-level in the ICAO Standard Atmosphere (ISA) can be used as a benchmark against which to compare the air density prevailing at any particular time and in any particular place.
The ISA density of 1 225 grams per cubic metre at mean sea-level is taken to be one hundred percent.
If, in a given place, or at sea-level, the actual density were 1 000 grams per cubic metre, this density would be approximately 82 percent of the ISA mean sea-level density, as depicted in Figure 3.4.
Figure 3.4 Relative density is a measure of the prevailing air density relative to the density in ISA, at mean sea-level, expressed as a percentage. At sea level in ISA, the relative density
is 100%.
This method of expressing atmospheric density is called Relative Density.
Relative Density is a comparison of the prevailing air density to the ISA mean sea-level air density.
DENSITY ALTITUDE.
It is essential that pilots understand the concept of density altitude, as it plays a vital role in the calculation of aircraft performance, especially in hot, high or humid atmospheric conditions.
28
ID: 3658
Customer: Oleg Ostapenko E-mail: ostapenko2002@yahoo.com
Customer: Oleg Ostapenko E-mail: ostapenko2002@yahoo.com
C H A P T ER 3 : A T M O S P H
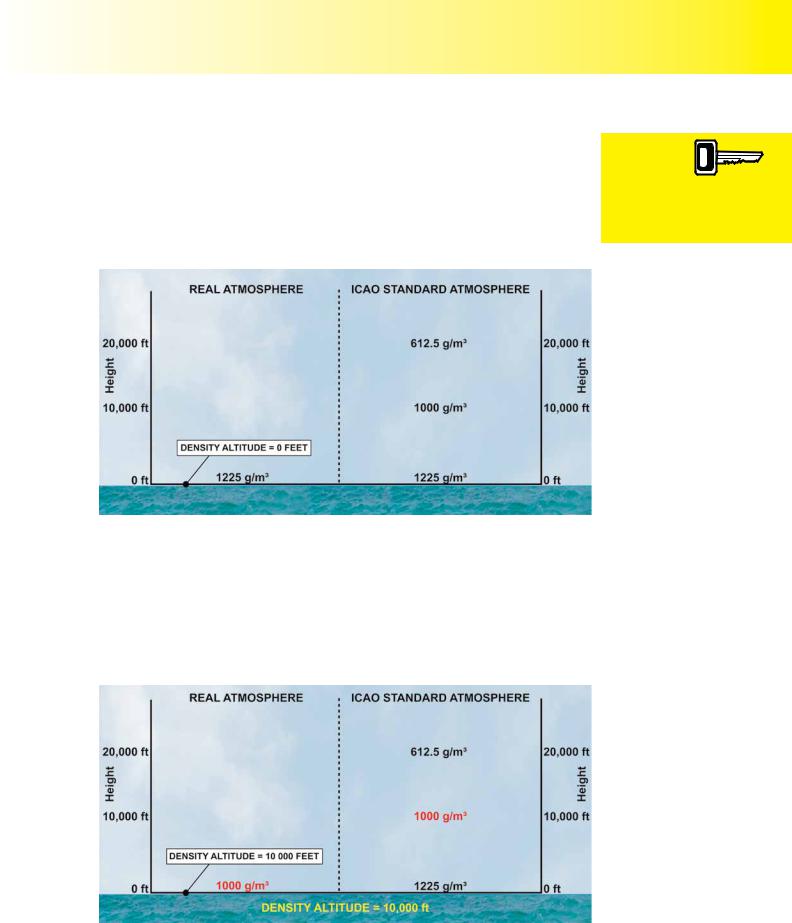
Density Altitude is, simply defined, the altitude in the ICAO Standard Atmosphere
(ISA), at which the actual prevailing density would occur.
If, for example, an aircraft were to be about to take off from an aerodrome at sea-level, and the atmospheric conditions of the day happened to be exactly the same as ISA conditions, the air density at sea-level in the real atmosphere would correspond exactly to that found at 0 feet in ISA, and the aircraft’s density altitude would be 0 feet. (See Figure 3.5.)
Figure 3.5 “Density altitude” is defined as the altitude in ISA at which the prevailing air density would be found.
However if, on a different day, atmospheric density at sea-level in the real atmosphere were to be 1 000 grams per cubic metre, this lower atmospheric density would correspond to a density found at an altitude in ISA, higher than sea-level (0 feet). Figure 3.6 shows that the atmospheric density at sea-level, in this second example, equates to a density found at 10 000 ft in ISA. Consequently, the density altitude at mean sea-level in the real atmosphere, at this location, on this particular day, is
10 000 ft.
Figure 3.6 A surface density of 1 000 g/m³ would give a density altitude of 10 000 ft at the surface.
Density
Altitude is the altitude
in the ICAO
Standard Atmosphere at which the actual prevailing density would occur.
29

Order: 6026
Customer: Oleg Ostapenko E-mail: ostapenko2002@yahoo.com
Customer: Oleg Ostapenko E-mail: ostapenko2002@yahoo.com
C H A P T ER 3 : A T M O S P H ER IC DENS IT Y
As we have mentioned, density altitude is an important parameter for determining aircraft performance, because an aircraft’s published performance figures most commonly assume that ISA conditions prevail. It is particularly important when calculating take-off and landing distance required, that the density altitude of the aerodrome concerned is calculated by the pilot. Density altitude is usually taken into account when pressure altitude and temperature are entered into standard performance graphs.
C a l c u l a t i n g De n s i t y A l t i t u d e .
There are two simple ways of calculating density altitude. One method is to use a navigation computer (see Volume 3; ‘Navigation’), and the other, described below, is by using a simple mathematical formula.
Expressed in words, the mathematical formula tells us that every one degree Celsius deviation from ISA conditions corresponds to a difference in altitude of 118.8 feet. The altitude we use for our calculations is the aircraft’s pressure altitude; that is, its altitude with respect to the Standard Pressure Setting of 1013.2 millibars (hectopascals).
The formula, itself, is expressed as follows:
DENSITY ALTITUDE = PRESSURE ALTITUDE ± (ISA DEVIATION × 118.8) feet
If the actual temperature is higher than ISA, density altitude will be greater than the measured pressure altitude. If the actual temperature is lower than ISA, the density altitude will be lower than the measured pressure altitude.
For example, on a given day, let the pressure altitude be 2 000 feet and the temperature at that altitude, 25°C.
In the ISA, the temperature at 2 000 feet would be 11°C. (Remember, ISA sea-level temperature is 15°C, and the ISA temperature lapse rate is approximately 2°C per 1 000 feet.)
So, in our example, at 2 000 feet, the temperature of 25°C is 14°C higher than the
ISA temperature, at that altitude. Therefore, the ISA deviation is ISA+14.
So, applying the formula for density altitude, we obtain:
DENSITY ALTITUDE = PRESSURE ALTITUDE ± (ISA DEVIATION × 118.8) feet
DENSITY ALTITUDE = 2 000 + (14 × 118.8) = 3 663 feet
Therefore, in our example, the density altitude, on the day in question, at a measured pressure altitude of 2 000 feet, is 3 663 feet.
30

ID: 3658
Customer: Oleg Ostapenko E-mail: ostapenko2002@yahoo.com
Customer: Oleg Ostapenko E-mail: ostapenko2002@yahoo.com
C H A P T ER 3 : A T M O S P H ER IC DE
R |
e p r e s e n t a t i v e |
P P L - t y p e |
k n o w l e d g e o f A |
t m o s p h e r i c |
|
q u e s t i o n s t o t De n s i t y .
1.Generally, within the Troposphere, as altitude increases:
a.temperature decreases and density increases
b.temperature, pressure and density decrease
c.temperature and pressure increase and density decreases
d.temperature decreases, pressure and density increase
2.What is the effect of reduced density on aircraft performance?
a.There will be an increase in performance
b.There will be a decrease in performance
c.There will be no change in performance
d.There will be less lift but more engine power
3.Density is defined as:
a.mass per unit volume
b.mass per unit area
c.weight of air per unit area
d.volume divided by mass
4.Under which of the following conditions would the air density at a given location be least?
a.Low altitude, high temperature and high humidity
b.High altitude, high temperature and low humidity
c.High altitude, high temperature and high humidity
d.Low altitude, low temperature and low humidity
5.What is the density at sea-level in the ICAO Standard Atmosphere?
a.1225 g/m³
b.12.25 g/m³
c.1.225 g/m³
d.122.5 g/m³
6.Air density at the Earth’s surface will be low when:
a.pressure is high and temperature is high
b.pressure is high and temperature is low
c.pressure is low and temperature is low
d.pressure is low and temperature is high
Question |
1 |
2 |
3 |
4 |
5 |
6 |
|
|
|
|
|
|
|
Answer |
|
|
|
|
|
|
T h e a n s w e r s t o t h e s e q u e s t i o n s c a n b e f o u n d
31
Customer: Oleg Ostapenko E-mail: ostapenko2002@yahoo.com
32

Customer: Oleg Ostapenko E-mail: ostapenko2002@yahoo.com
CHAPTER 4 TEMPERATURE
33

Order: 6026
Customer: Oleg Ostapenko E-mail: ostapenko2002@yahoo.com
Customer: Oleg Ostapenko E-mail: ostapenko2002@yahoo.com
C H A P T ER 4 : T EM P ER A T U R E
34
ID: 3658 |
|
Customer: Oleg Ostapenko E-mail: ostapenko2002@yahoo.com |
|
Customer: Oleg Ostapenko E-mail: ostapenko2002@yahoo.com |
C H A P T ER 4 : T EM P |
|
INTRODUCTION.
This chapter will investigate temperature and demonstrate its importance to Aviation Meteorology.
In the atmosphere, the temperature of the air varies throughout the course of any given day, from day to day, from season to season, from one altitude to another, and from location to location, increasing as one moves from the Poles to the Equator. This diurnal, seasonal, vertical, and regional variation in temperature has a great influence on our weather.
Temperature is defined as “a measure of the heat energy derived from the movement and collision of molecules (kinetic energy) in a gas or system”. The higher the kinetic energy possessed by the gas molecules within any given system, such as the atmosphere, the higher will be the temperature of that system.
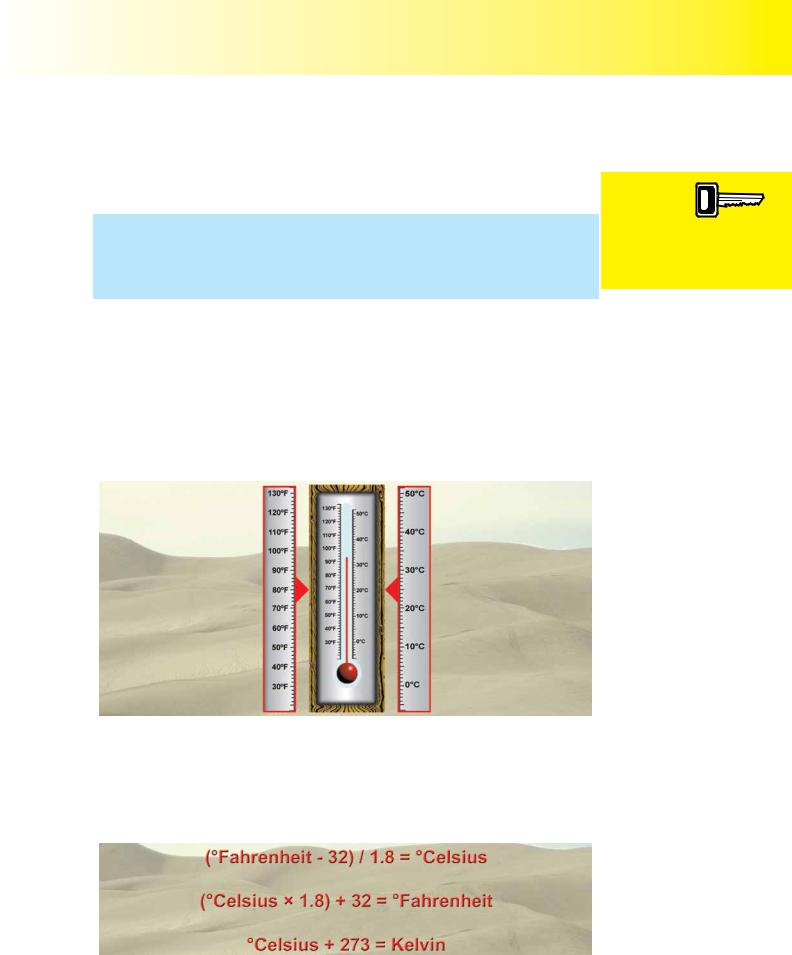
TEMPERATURE SCALES.
Temperature can be measured on a variety of scales. The two most common scales are: degrees Celsius (sometimes called Centigrade) and degrees Fahrenheit. These scales are depicted in Figure 4.1.
Figure 4.1 Temperature Scales: Fahrenheit (ºF) and Celsius (ºC).
There is another well-known scale of temperature known as the Kelvin Scale. The Kelvin scale, which measures absolute temperature, is rarely used in aviation meteorology, but you may see it in scientific formulae. At absolute zero, or 0 Kelvin, all molecular activity has ceased. 0 Kelvin is equal to -273º Celsius.
Celsius is the scale the we will use throughout this book.
Figure 4.2 Temperature Scale Conversions.
The diurnal,
seasonal, vertical and
regional
variations in temperature have a great influence on the world’s weather.
35

Order: 6026
Customer: Oleg Ostapenko E-mail: ostapenko2002@yahoo.com
Customer: Oleg Ostapenko E-mail: ostapenko2002@yahoo.com
C H A P T ER 4 : T EM P ER A T U R E
There is often a requirement to convert from one temperature scale to another. To convert degrees Fahrenheit into degrees Celsius, subtract 32º from the Fahrenheit value and then divide the answer by 1.8. To convert degrees Celsius to degrees
Fahrenheit, multiply the Celsius value by 1.8 and add 32º to find the answer. To convert Celsius into Kelvin, add 273º. These conversions are illustrated in
Figure 4.2.
Instead of dividing by 1.8, you may find it easier to divide by 9 and multiply by 5.
Instead of multiplying by 1.8, you could divide by 5 and multiply by 9.
There is a conversion scale for Fahrenheit and Celsius on most flight navigation computers. (See Figure 4.3.)
Figure 4.3 Temperature Conversion scale on the Navigation Computer.
MEASURING TEMPERATURE.
The instrument used to measure temperature is called a thermometer (see Figure 4.1). In meteorology, thermometers which are used to measure the temperature of free air are usually housed in a Stevenson Screen as illustrated in Figure 4.4.
Figure 4.4 Measuring free air temperature: a Stevenson Screen.
The Stevenson Screen is located 4 feet above ground level, allowing the free passage of air through the housing, but preventing direct exposure to the Sun’s radiation.
36