Is the standard deviation of all possible sample average of the volume, which is called the standard error of the mean, depends on the standard deviation of the population, and on the sample size.
As we increase the sample size, the sample mean and standard deviation of X- s provide more accurate estimates of the mean μ and standard deviation σ in the aggregate. Increasing the accuracy of the estimate is reflected in a decrease in the average standard error of the mean. Accumulated enough Martians, you can make a standard error of the mean arbitrarily small. In contrast to the standard deviation of the standard error of the mean does not say anything about the spread of the data - it only shows the accuracy of the sample estimate of average. Although the difference between the standard deviation and standard error of the mean is quite obvious, they are often confused.
Most researchers in the publications give standard error of the average value, which is certainly less than the standard deviation. The authors think that this form of data inspire more confidence. Maybe the way it is, but the trouble is that the standard error of the mean measure is the average accuracy of the estimate, but not scatter in the data, which is interesting to the reader. The moral is that, in describing the totality, you should always give the value of the standard deviation. However, the standard deviation can be calculated to - it needs to multiply the standard error of the mean square root of the sample size (number of groups). However, for this you need to know what exactly causes the author - the standard deviation or standard error of the mean.
Conclusions
• When the set of normally distributed, it is exhaustively described by the parameters of distribution - mean and standard deviation. When raspredeleniesilno different from the normal, more informative median and percentiles.
• Since observe the totality rarely possible, we estimate the parameters of the distribution of the sample, randomly extracted from the aggregate.
• The standard error of the mean is a measure of the accuracy with which the sample mean is an estimate of the average for the population. These values are not only useful for describing the population or sample. They can also be used for statistical hypothesis testing, such as the differences between the groups.
Analysis of the data in MS Excel
analysis package
1. Package Analysis - Built-in spreadsheet function, which allows for statistical analysis. Tools - Analysis of the data, if the function is not enabled, enable it to Tools - Add-ins - Package Analysis,

- Using analysis package to generate 100 random numbers (general population)
- Take a sample from the general population in an amount of 30 numbers
- To analyze the data
- Plot the distribution of random variables
Execution order (will be used in distributed according to the number of normal distribution)
1. Generating a random number.
Put the cursor in cell A2, Tools - Data Analysis - Generate random numbers. When field is filled in according to the picture window and click OK

The result has the form

2. Sampling. Put the cursor in cell B2. Menu Data Analysis - Sample

the result set

3. produce a statistical analysis of the obtained sample. Menu Data analysis - Descriptive Statistics

The result is a table of the form

4. Analyze the results. Given that we obviously know the distribution of the random variables in the table highlight the parameters that are used to plot the normal distribution. Write in front of each parameter definition. What other way can obtain the required data descriptive statistics?
5. Construction of the graph of a normal distribution. To plot the distribution in Excel, you create a table of frequencies. for this
- Introduce a factor of k = 5lgN, where N - sample (30 lab)
- And look forward to the width of the interval Interval = (value from the table) / k
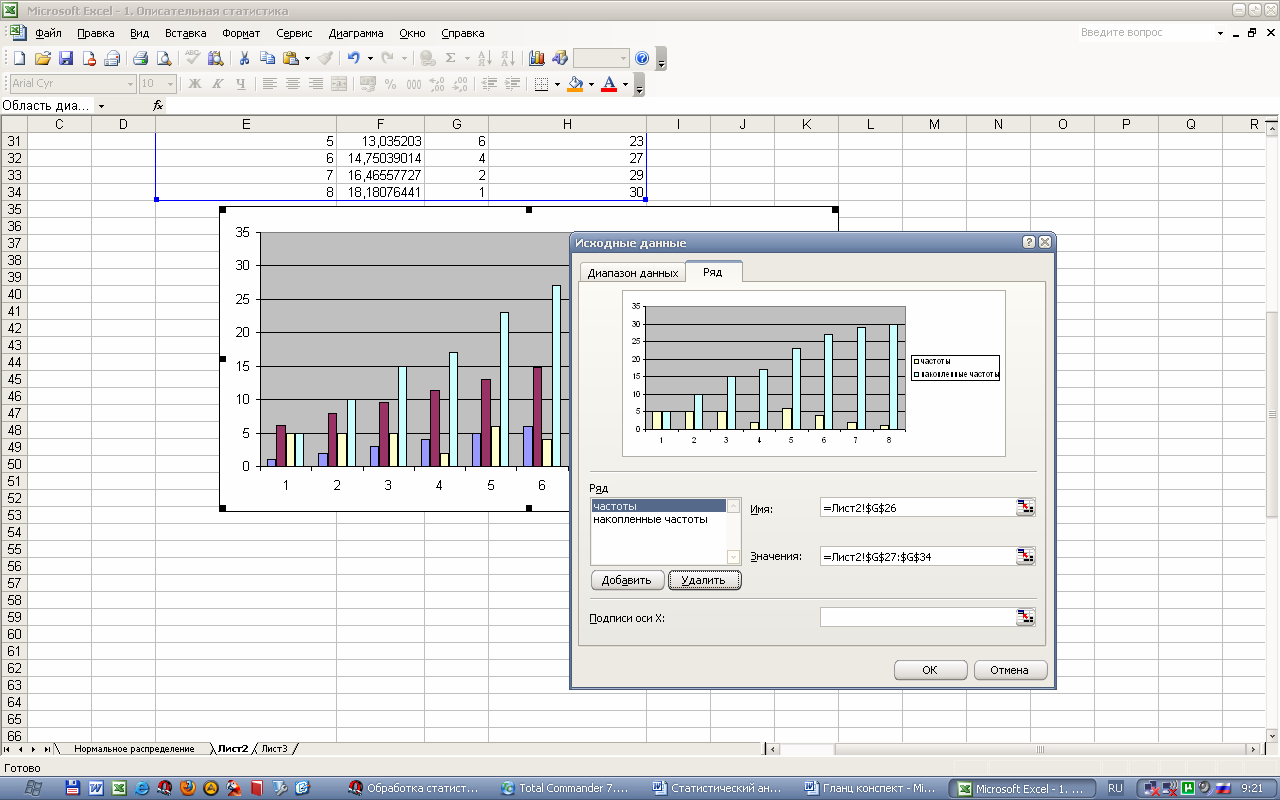
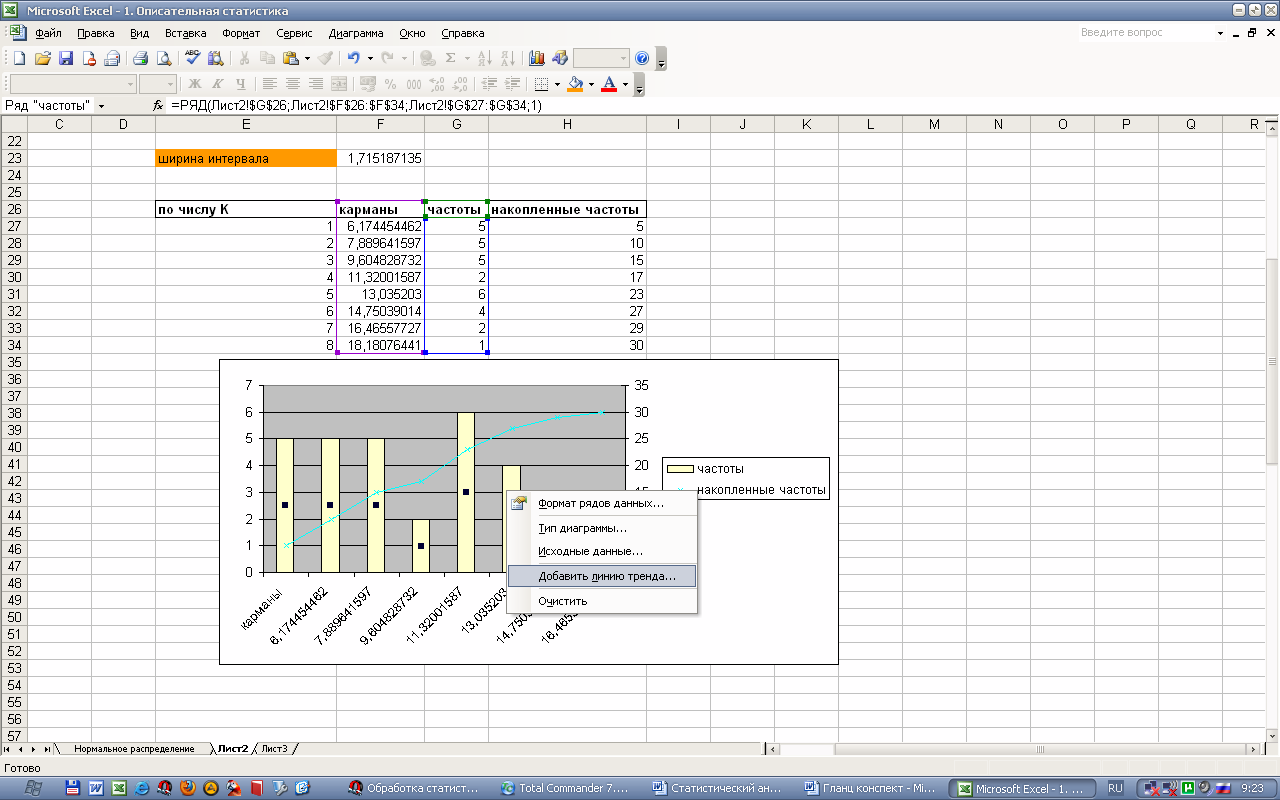
- Draw up a table pockets species
Column Frequencies completed as follows. Select the entire frequency range.

Call a function of frequency, fill the window function according to the results and tables. Dataset - the number in the sample, the array intervals - column Pockets

Press the key combination CTRL + SHIFT + Enter.

- Cumulative frequencies are calculated as follows:

- построение графика распределения