

vk.com/id446425943
Goldman Sachs
X5: From growth to value and dividends; reiterate Buy
Russia Retail
We remain Buy rated on X5 with 23% upside (total shareholder return of 28%) to our revised 12m price target of US$29.6 (up from US$28.7, reflecting estimate changes and a very minor change in our target multiple) - X5 remains our top pick in Russian food retail. In this section, we attempt to answer key investor questions on X5 into 2019.
(1) Is it just the high level of openings driving the decline in EBITDA margin YTD?
We find that the margin decline YTD has been mainly driven by weaker operating leverage owing to slower CPI and wage increases rather than the impact of openings.
(2)Can X5 keep its EBITDA margin in 2019 close to the 2018 level? We believe ongoing margin pressure in capitals will be offset by increasing sales density/margins in other regions and an improvement in shrinkages; we forecast only a c.0.1pp margin decline in 2019.
(3)Is X5 a dividend story now? We now expect X5 to maintain c.2x leverage in the medium term (based on comments at the CMD), which, coupled with improving FCF generation, should allow for 100% net income payout, on our estimates, implying an 8% dividend yield in 2019E, materially above Bloomberg consensus’ 5% estimate.
(1) Deep-dive into margin trends over the past 12 months
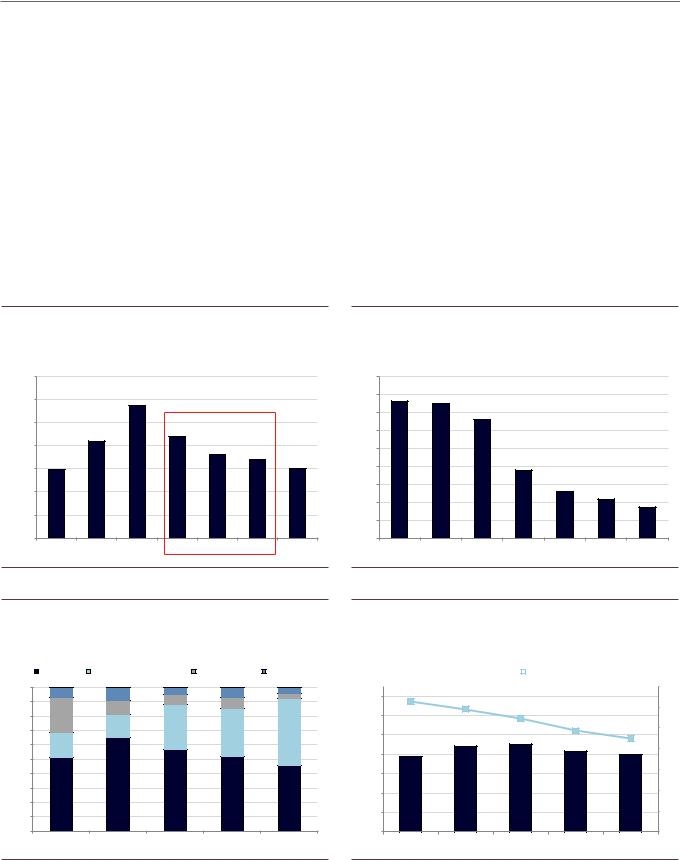
X5 opened a record number of proximity stores (c.3,000 on a gross basis) in 2017, which coincided with EBITDA margin declines from 3Q17 to 2Q18 (Exhibit 19). We have attempted to dissect the EBITDA margin drivers in 9M18 (Exhibit 21). On our estimates, most of the margin decline YTD has been driven by negative operating leverage owing to weaker inflation (which declined from +3.6% in 9M17 to +1% in 9M18) as well as wage increases (X5 indexed wages since 3Q17, by 3%-5%, on our estimates). At the same time, the direct impact of new openings, in our view, may have accounted for up to 0.3pp, partially including an increase in shrinkages and other costs. We also note that X5 has improved EBITDA margins in core Pyaterochka stores during periods of rapid selling space additions (c.40% yoy in 2015-17 - Exhibit 22), implying that cost control and operating leverage could be more meaningful drivers of its margins.
Exhibit 19: X5’s EBITDA margin was under pressure in 3Q17-2Q18... |
Exhibit 20: ...coinciding with a record number of new openings |
Adjusted EBITDA margin change, yoy |
Proximity store openings |
1.0% |
0.8% |
|
|
0.6% |
0.7% |
|
|
|
|
|
900 |
|
|
0.4% |
|
|
|
|
|
|
800 |
||
0.5% |
|
0.2% |
|
|
|
|
|
|
|
||
|
|
|
|
|
|
|
|
0.1% |
|
||
|
|
|
|
|
|
|
|
|
700 |
||
|
|
|
|
|
|
|
|
|
|
||
0.0% |
|
|
|
|
|
|
|
|
|
|
600 |
|
|
|
|
|
|
|
|
|
|
|
|
-0.5% |
|
|
|
|
|
-0.5% |
|
|
|
|
500 |
|
|
|
|
|
|
|
|
|
|
400 |
|
-1.0% |
|
|
|
|
|
|
|
|
|
|
|
|
|
|
|
|
|
|
|
-0.9% |
|
300 |
|
|
|
|
|
|
|
|
-1.2% |
|
|
||
-1.5% |
|
|
|
|
|
|
|
|
|
200 |
|
|
|
|
|
|
|
|
-1.4% |
|
|
||
|
|
|
|
|
|
|
|
|
|
|
|
-2.0% |
|
|
|
|
|
|
|
|
|
|
100 |
2Q16 |
3Q16 |
4Q16 |
1Q17 |
2Q17* |
3Q17 |
4Q17 |
1Q18 |
2Q18 |
3Q18 |
|
|
|
0 |
* 2Q17 Adjusted for Rub1.5bn release of provisions
|
|
|
|
|
793 |
744 |
|
|
|
|
|
|
|
686 |
|
|
|
|
|
|
623 |
|
639 |
|
|
|
|
|
|
|
576 |
|
|
|
572 |
|
|
||
528 |
|
|
|
|
|
517 |
508 |
||
|
|
|
|
|
|
|
|||
2Q16 |
3Q16 |
4Q16 |
1Q17 |
2Q17* |
3Q17 |
4Q17 |
1Q18 |
2Q18 |
3Q18 |
Source: Company data |
Source: Company data |
28 November 2018 |
11 |

vk.com/id446425943
Goldman Sachs
Russia Retail
Exhibit 21: We estimate most of the margin decline YTD has been driven by negative operating leverage (due to lower inflation) / wage increases
Adjusted EBITDA margin change and key factors, 9M17/9M18
Exhibit 22: X5 improved EBITDA margins in proximity stores despite its fast rollout (6.5k stores opened in 2015-17)
EBITDA margin and selling space growth in Pyaterochka
8.5% |
|
|
|
|
|
|
|
|
|
8.0% |
7.9% |
|
|
|
|
|
|
10.0% |
|
8.0% |
|
|
+0.5% |
|
|
|
|||
|
-0.3% |
|
|
|
|
|
|||
|
|
|
-0.8% |
|
|
9.5% |
|||
7.5% |
|
|
|
-0.1% |
|
||||
|
|
|
|
|
7.2% |
|
|||
|
|
|
|
|
|
9.0% |
|||
7.0% |
|
|
|
|
|
|
|
||
|
|
|
|
|
|
|
|
||
6.5% |
|
Partially |
|
|
|
|
|
8.5% |
|
|
|
Lower inflation |
|
|
|
||||
|
|
impacted by |
|
|
8.0% |
||||
6.0% |
|
new |
|
|
and |
|
|
|
|
|
|
openings |
|
indexations |
|
|
7.5% |
||
5.5% |
|
|
|
|
|
|
|
7.0% |
|
|
|
|
|
|
|
|
|
||
5.0% |
|
|
|
|
|
Other |
EBITDA |
6.5% |
|
EBITDA |
EBITDA |
Shrinkage |
Commercial |
Impact of |
|||||
|
|||||||||
9m17 |
9m17* |
|
|
margin |
operating |
|
9m18 |
6.0% |
|
*Adjusted for Rub1.5bn release of provisions |
|
leverage |
|
|
|||||
|
|
|
|
||||||
|
|
|
|
|
|||||
|
|
|
EBITDA margin |
|
|
|
Selling space growth |
|
|
|
|
|
45% |
|
38% |
37% |
|
|
40% |
|
|
|
33% |
|
35% |
|
|
|
|
|
|
24% |
|
8.3% |
8.3% |
23% |
30% |
|
25% |
||||
|
7.8% |
|
|
|
|
7.5% |
|
|
7.6% |
20% |
|
|
|
|
|||
|
|
|
|
|
15% |
|
|
|
|
|
10% |
|
|
|
|
|
5% |
2014 |
2015 |
2016 |
2017 |
1H18 |
0% |
|
Source: Company data, Goldman Sachs Global Investment Research |
Source: Company data |
(2) Key trends in 2019 for X5
Moscow to remain an important region for new space additions
Despite X5’s active expansion into more distant regions, capitals (Moscow, Moscow region, Saint Petersburg and Leningrad region, where margins are c.2x higher than in other regions), have been important drivers of new space additions over the last three years (accounting for c.35%-40% of new space, on our estimates). While we see a diminishing opportunity for X5 to open new stores in St. Petersburg and the Moscow region owing to market share limitations (already over 25% as of 1H18 in the former and close to 23% in the latter, as per Infoline), we see potential for openings in the city of Moscow (only c.14% market share as of 1H18). We believe X5 will likely keep the share of openings in capitals relatively high in the near term (20%-30% of new space in 2019-20, on our estimates), given its key competitor Magnit plans to expand more actively in Moscow. Overall, given that capitals still account for a significant share of new space, we do not expect a material decline in their contribution to group sales over the next two years (Exhibit 24).
Exhibit 23: We expect capitals (Moscow in particular) to remain an important driver of new space additions for X5...
Net selling space addition breakdown, k sqm
|
|
Capitals |
Other regions |
New space |
|
|
1,400 |
|
1,178 |
|
|
|
|
1,200 |
|
|
|
|
||
969 |
|
|
|
|
||
1,000 |
|
949 |
842 |
|
||
|
|
|
774 |
|||
|
|
|
|
|||
800 |
|
65% |
|
|
||
|
|
|
|
|||
600 |
65% |
|
70% |
70% |
|
|
|
|
|
||||
|
|
|
|
80% |
||
400 |
|
|
|
|
||
|
|
|
|
|
||
200 |
35% |
35% |
30% |
30% |
|
|
|
|
20% |
||||
- |
|
|
|
|
||
2016 |
2017 |
2018E |
2019E |
2020E |
||
|
Exhibit 24: ...and do not expect a material decline in their contribution to total sales
X5 sales, Rub bn, and breakdown by regions
Capitals (Moscow, St. Petersburg) |
Other regions |
Total sales |
2,500
1,996
2,000 |
1,767 |
|
|
1,529 |
|
|
1,500 |
1,295 |
|
51% |
53% |
1,034 |
|
50% |
|
|
|
|
|
||
1,000 |
48% |
|
|
|
|
|
|
||
46% |
|
|
|
|
500 |
52% |
50% |
49% |
47% |
54% |
|
|||
|
|
|
|
|
- |
|
|
|
|
2016 |
2017 |
2018E |
2019E |
2020E |
Source: Company data, Goldman Sachs Global Investment Research |
Source: Company data, Goldman Sachs Global Investment Research |
28 November 2018 |
12 |

vk.com/id446425943
Goldman Sachs
Russia Retail
Sales density to improve on slower expansion and higher inflation
Sales per sqm growth has been negative since 2015, although it has been broadly stable at -5% yoy. We note that food CPI has decelerated from over 20% in 2015 to just 1.6% in 3Q18, implying that real sales density growth, adjusted for inflation, has even been improving (Exhibit 25). Going forward, we expect sales densities to be supported by (1) accelerating food inflation (our economists expect food CPI to reach +4%-5% in 1Q-2Q18, discussed in more detail in our September note) and (2) a maturing store base profile (we expect the share of stores opened in the last 1.5 years to drop from 35%-40% in 2017 to below 20% in 2019-20). On our estimates, these factors will lead to an improvement in sales densities in other regions and partially offset an adverse impact on Moscow’s sales densities from competition (primarily from specialised stores and a minor impact from Magnit’s accelerated store openings). Overall, in 2019, we see sales per sqm growth turning positive for the first time since 2015 (Exhibit 28).
Exhibit 25: Sales density has been largely stable despite slowing food inflation
Sales/sqm growth yoy, food inflation
|
|
|
|
|
Pyaterochka |
|
Food CPI |
|
|
|
|
|
|
|||||
25.0% |
|
|
|
|
|
|
|
|
|
|
|
|
|
|
|
|
|
|
20.0% |
|
|
|
|
|
|
|
|
|
|
|
|
|
|
|
|
|
|
15.0% |
|
|
|
|
|
|
|
|
|
|
|
|
|
|
|
|
|
|
10.0% |
|
|
|
|
|
|
|
|
|
|
|
|
|
|
|
|
|
|
5.0% |
|
|
|
|
|
|
|
|
|
|
|
|
|
|
|
|
|
|
0.0% |
|
|
|
|
|
|
|
|
|
|
|
|
|
|
|
|
|
|
-5.0% |
|
|
|
|
|
|
|
|
|
|
|
|
|
|
|
|
|
|
-10.0% |
|
|
|
|
|
|
|
|
|
|
|
|
|
|
|
|
|
|
1Q14 |
2Q14 |
3Q14 |
4Q14 |
1Q15 |
2Q15 |
3Q15 |
4Q15 |
1Q16 |
2Q16 |
3Q16 |
4Q16 |
1Q17 |
2Q17 |
3Q17 |
4Q17 |
1Q18 |
2Q18 |
3Q18 |
Exhibit 26: On the back of slower openings, we expect the store maturity profile to improve
Share of Pyaterochka stores <1.5 years old
40% |
|
|
|
|
|
|
|
|
|
|
|
|
|
35% |
|
|
|
|
|
|
|
|
|
|
|
|
|
30% |
|
|
|
|
|
|
|
|
|
|
|
|
|
25% |
|
|
|
|
|
|
|
|
|
|
|
|
|
20% |
|
|
|
|
|
|
|
|
|
|
|
|
|
15% |
|
|
|
|
|
|
|
|
|
|
|
|
|
10% |
|
|
|
|
|
|
|
|
|
|
|
|
|
5% |
|
|
|
|
|
|
|
|
|
|
|
|
|
0% |
|
|
|
|
|
|
|
|
|
|
|
2019E |
2020E |
1Q16 |
2Q16 |
3Q16 |
4Q16 |
1Q17 |
2Q17 |
3Q17 |
4Q17 |
1Q18 |
2Q18 |
3Q18 |
4Q18E |
Source: Company data, Goldman Sachs Global Investment Research, Rosstat |
Source: Company data, Goldman Sachs Global Investment Research |
Exhibit 27: We expect further acceleration in food inflation
Food CPI, yoy
Food |
|
Food ex F&V |
|
7.0%
6.0%
5.0%
4.0%
3.0%
2.0%
1.0%
0.0%
-1.0%
Exhibit 28: Rising store maturity and firmer inflation likely to provide support
Sales/sqm growth
3% |
|
|
|
Capitals (Moscow, St. Petersburg) |
|
|
|
Other regions |
|
|
Total |
|
|
|
|
|
|
|
|
||||
|
|
|
|
|
|
|
|
|
2% |
||
|
|
|
|
|
|
|
|
|
|
||
2% |
|
|
|
|
|
|
|
|
|
|
|
|
|
|
|
|
|
|
|||||
1% |
|
|
0.5% |
0% |
|
|
|
-1% |
|
-1% |
-1% |
|
-2% |
|
|
-2% |
|
|
|
|
|
|
|
-3% |
|
-3% |
|
-4% |
|
|
|
-5% |
|
-4% |
|
|
2017 |
2018E |
2019E |
Source: Rosstat, Goldman Sachs Global Investment Research |
Source: Company data, Goldman Sachs Global Investment Research |
28 November 2018 |
13 |

vk.com/id446425943
Goldman Sachs
Russia Retail
Improving regional margins to offset mounting pressure in Moscow
We expect further margin compression for X5 in capitals (from low double-digit to high single-digit territory), driven by specialised store expansion and the planned acceleration of Magnit’s openings in Moscow. However, we believe most of the decline will be offset by improving profitability in other regions owing to growing economies of scale and improving sales densities (discussed earlier), as well as ongoing improvement in the level of shrinkages. Overall, we expect adjusted EBITDA margin (before LTI costs) to reach 6.9% in 2019, driven by weaker margins in capital cities and a growing share of other regions - our expectation is broadly in line with Bloomberg consensus.
Exhibit 29: We expect margins to decline in capitals and expand in other regions
Adjusted EBITDA margin, %
|
|
|
Capitals |
|
|
|
Other regions |
|
Total |
|
|
|
|
|
|
|
12.0%
10.0% |
|
|
|
7.7% |
7.0% |
|
|
8.0% |
6.9% |
6.7% |
|
|
|
|
|
6.0% |
|
|
|
4.0% |
|
|
|
2.0% |
|
|
|
0.0% |
|
|
|
2017 |
2018E |
2019E |
2020E |
Exhibit 30: With weaker margins in capital cities and a growing share of other regions, we expect a decline in group margin to 6.9% in 2019
EBITDA margin change decomposition
7.2% |
7.0% |
|
|
|
|
|
|
7.0% |
|
|
|
|
6.9% |
||
|
-0.2% |
|
|
||||
|
|
|
|
|
|
||
|
|
|
0.1% |
|
|
|
|
6.8% |
|
|
|
-0.05% |
|||
|
|
|
|
||||
|
|
|
|
|
|
|
|
6.6%
6.4%
6.2%
6.0%
2018E |
Impact of marginImpact of margin |
Impact of |
2019E |
|
|
decline in |
improvement in |
regional mix |
|
|
capitals |
regions and |
change |
|
|
|
shrinkages |
|
|
Source: Company data, Goldman Sachs Global Investment Research |
Source: Goldman Sachs Global Investment Research |
Exhibit 31: 2019E EBITDA margin sensitivity
Base case: +0.5% sales/ sqm growth and +2.5% SG&A / growth in 2019E (-3% / +2.5% in 2018E respectively)
|
EBITDA margin |
|
Sales density growth |
|
|
||||
|
|
2019 |
|
|
|
||||
|
|
|
|
|
|
|
|
||
|
|
6.9% |
3% |
1% |
0% |
-1% |
-3% |
|
|
|
|
|
|
|
|
|
|
|
|
|
growthsqm |
|
0% |
7.7% |
7.4% |
7.2% |
7.1% |
6.8% |
|
|
|
2% |
7.3% |
7.1% |
6.9% |
6.7% |
6.4% |
|
|
|
|
|
1% |
7.5% |
7.2% |
7.1% |
6.9% |
6.6% |
|
|
/ |
|
|
|
|
|
|
|
|
|
SG&A |
|
3% |
7.2% |
6.9% |
6.7% |
6.5% |
6.3% |
|
|
|
|
|
||||||
|
|
|
4% |
7.0% |
6.7% |
6.6% |
6.4% |
6.1% |
|
|
|
|
|
|
|
|
|
|
|
|
|
|
|
|
|
|
|
|
|
Exhibit 32: 2019E EV/EBITDA multiple sensitivity
Base case: +0.5% sales/ sqm growth and +2.5% SG&A / growth in 2019E (-3% / +2.5% in 2018E respectively)
|
2019E EV/EBITDA |
|
|
Sales density growth |
|
|
|
|
|
|
|
|
|
|
|
|
|
|
|
503.8% |
3% |
1% |
0% |
-1% |
-3% |
|
|
|
|
|
|
|
|
|
|
|
growthsqm |
0% |
4.5x |
4.7x |
4.8x |
5.0x |
5.3x |
|
|
2% |
4.7x |
4.9x |
5.1x |
5.3x |
5.6x |
|
|
|
|
1% |
4.6x |
4.8x |
5.0x |
5.1x |
5.4x |
|
|
/ |
|
|
|
|
|
|
|
|
SG&A |
3% |
4.8x |
5.0x |
5.2x |
5.4x |
5.7x |
|
|
|
|
||||||
|
|
4% |
4.9x |
5.2x |
5.3x |
5.5x |
5.9x |
|
|
|
|
|
|
|
|
|
|
|
|
|
|
|
|
|
|
|
Source: Goldman Sachs Global Investment Research |
Source: Goldman Sachs Global Investment Research |
28 November 2018 |
14 |
vk.com/id446425943
Goldman Sachs
(3) We see upside risks to market expectations on dividends
Russia Retail
Taking into account growing market concerns over returns and X5’s guidance (1,800 proximity stores in 2019), we expect a gradual decrease in annual store additions from a peak level in 2017, both in absolute and relative terms (Exhibit 33). With slower store openings, we expect more capex to be dedicated to IT/online development and maintenance and forecast total capex in 2019/20 to remain broadly stable at around Rub80 bn (Exhibit 36). At the same time, we expect declining capex as % of sales to result in improved FCF generation from 2019 (Exhibit 37). Based on management comments during the CMD, we assume X5 will maintain its net debt/EBITDA close to 2x going forward (implying net debt could increase in absolute terms given growing EBITDA) and that cash flows after allowing for leverage to be kept at this level will be distributed to shareholders. This underpins our assumption of 100% dividend payout in 2018-20, which implies a 8%-9% dividend yield in 2019/20, materially above consensus expectations of c.5%-6% yield (Exhibit 40).
Exhibit 33: Organic expansion by X5 is likely to be more moderate |
Exhibit 34: ...implying lower selling space growth |
in absolute terms... |
Total selling space growth, % |
New proximity store openings |
|
3,500 |
|
|
|
|
|
|
45% |
3,000 |
|
2,862 |
|
|
|
|
40% |
|
|
|
|
|
|
||
|
|
|
|
|
|
|
35% |
2,500 |
2,098 |
|
2,200 |
|
|
|
30% |
|
|
|
|
|
|||
2,000 |
|
|
|
1,800 |
1,700 |
|
25% |
1,476 |
|
|
|
|
1,500 |
|
|
|
|
|
|
|
20% |
||
1,500 |
|
|
|
|
|
|
|
|
|
|
|
|
|
|
|
1,000 |
|
|
|
|
|
|
15% |
|
|
|
|
|
|
|
|
|
|
|
|
|
|
|
10% |
500 |
|
|
|
|
|
|
5% |
|
|
|
|
|
|
|
|
- |
|
|
|
|
|
|
0% |
2015 |
2016 |
2017 |
2018E |
2019E |
2020E |
2021E |
|
38% |
37% |
|
|
|
|
|
|
|
33% |
|
|
|
|
|
|
|
19% |
|
|
|
|
|
|
|
13% |
11% |
|
|
|
|
|
|
9% |
|
|
|
|
|
|
|
|
2015 |
2016 |
2017 |
2018E |
2019E |
2020E |
2021E |
Source: Company data, Goldman Sachs Global Investment Research |
Source: Company data, Goldman Sachs Global Investment Research |
Exhibit 35: With slower store openings, we expect more capex to be dedicated to IT/online development and maintenance
Capex breakdown
Openings |
IT, Maintenance and other |
Refurbishments |
Logistics |
100% |
7% |
9% |
5% |
7% |
4% |
90% |
7% |
4% |
|||
|
9% |
7% |
|
||
|
|
|
|||
80% |
24% |
|
|
|
|
16% |
|
|
|
||
70% |
|
32% |
34% |
46% |
|
|
|
|
|||
60% |
17% |
|
|
|
|
50% |
|
|
|
|
|
40% |
|
|
|
|
|
30% |
52% |
65% |
57% |
52% |
|
|
46% |
||||
20% |
|
|
|||
|
|
|
|
||
|
|
|
|
|
|
10% |
|
|
|
|
|
0% |
2016 |
2017 |
2018 |
2019 |
2020 |
|
Exhibit 36: We expect capex to decline as a % of sales...
Capex, Rub bn and % of sales
|
|
|
Capex |
|
|
|
% of sales |
|
7.5% |
|
|
|
|
9.0% |
140.0 |
6.8% |
|
|
|
|
|
|
5.9% |
|
|
|
||
120.0 |
|
|
|
|
7.0% |
|
|
|
|
4.7% |
|
|
|
|
|
|
|
4.0% |
5.0% |
|
100.0 |
|
88.3 |
90.5 |
|
||
77.9 |
83.2 |
79.7 |
|
|||
|
|
|
3.0% |
|||
80.0 |
|
|
|
|||
|
|
|
|
|
|
|
60.0 |
|
|
|
|
|
1.0% |
|
|
|
|
|
|
|
40.0 |
|
|
|
|
|
-1.0% |
|
|
|
|
|
|
|
20.0 |
|
|
|
|
|
-3.0% |
|
|
|
|
|
|
|
0.0 |
2016 |
2017 |
2018E |
2019E |
2020E |
-5.0% |
|
|
Source: Company data, Goldman Sachs Global Investment Research |
Source: Company data, Goldman Sachs Global Investment Research |
28 November 2018 |
15 |
vk.com/id446425943
Goldman Sachs
Russia Retail
Exhibit 37: ...leading to improved FCF generation |
Exhibit 38: We do not forecast significant deleveraging, as we |
FCF, Rub bn and FCF yield |
believe X5 will maintain leverage close to c.2x... |
|
|
|
|
|
|
|
Net debt/EBITDA, x |
|
|
|
|
|
|
FCF |
FCF yield |
|
|
|
2.0 |
|
1.9 |
|
|
|
|
|
7.7% |
|
|
|
|
|
|||
|
|
|
|
|
10.0% |
1.9 |
|
|
|
|
|
|
|
|
|
|
|
|
|
|
|
||
40.0 |
|
|
|
3.8% |
32.2 |
|
1.8 |
|
|
1.7 |
|
-0.7% |
|
|
5.0% |
1.8 |
1.7 |
|
|
||||
|
|
|
|
|
|
||||||
30.0 |
|
-2.8% |
|
|
|
|
|||||
|
-5.1% |
|
|
0.0% |
1.7 |
|
|
|
1.6 |
||
20.0 |
|
|
15.1 |
|
|
|
|
|
|||
|
|
|
|
-5.0% |
1.6 |
|
|
|
|
||
|
|
|
|
|
|
|
|
|
|||
|
|
|
|
|
|
|
|
|
|
|
|
10.0 |
|
|
|
|
|
-10.0% |
1.5 |
|
|
|
|
|
|
|
|
|
|
|
|
|
|
||
|
|
|
|
|
|
|
|
|
|
|
|
- |
|
|
|
|
|
-15.0% |
1.4 |
|
|
|
|
|
|
|
|
|
|
|
|
|
|
||
|
-2.4 |
|
|
|
|
|
|
|
|
|
|
-10.0 |
|
|
|
|
-20.0% |
|
|
|
|
|
|
|
|
|
|
|
1.3 |
|
|
|
|
||
|
|
|
|
|
-25.0% |
|
|
|
|
||
|
|
|
|
|
|
|
|
|
|
|
|
-20.0 |
|
|
-14.3 |
|
|
-30.0% |
1.2 |
|
|
|
|
-30.0 |
|
-28.6 |
|
|
|
-35.0% |
1.1 |
|
|
|
|
-40.0 |
|
|
|
|
|
1.0 |
|
|
|
|
|
|
|
|
|
|
-40.0% |
|
|
|
|
||
|
2016 |
2017 |
2018E |
2019E |
2020E |
|
2016 |
2017 |
2018E |
2019E |
2020E |
Source: Company data, Goldman Sachs Global Investment Research Source: Company data, Goldman Sachs Global Investment Research
Exhibit 39: ...and increase dividends payments, which we forecast |
Exhibit 40: We see meaningful upside to consensus expectations |
||
at 100% of net income from 2019 |
on dividends |
||
Dividends, Rub bn; payout as % of NI |
Dividend yield, % |
||
Dividend |
|
Payout as % of Net Income |
GS Consensus |
|
|||
|
|||
60.0 |
|
|
|
120% |
10% |
|
|
|
|
100% |
100% |
9% |
|
50.0 |
|
|
|
100% |
8% |
|
|
|
|
|
40.2 |
||
|
|
|
|
7% |
||
40.0 |
69% |
70% |
36.1 |
80% |
||
6% |
||||||
|
|
|
|
|
||
30.0 |
|
|
|
60% |
5% |
|
20.0 |
21.6 |
21.0 |
|
40% |
4% |
|
|
|
|
3% |
|||
|
|
|
|
|
||
10.0 |
|
|
|
20% |
2% |
|
|
|
|
1% |
|||
|
|
|
|
|
||
- |
|
|
|
0% |
0% |
|
|
2017 |
2018E |
2019E |
2020E |
|
|
|
|
|
9% |
|
|
|
8% |
|
|
|
|
|
6% |
5% |
5% |
5% |
5% |
|
2017 |
2018E |
2019E |
2020E |
|
Source: Company data, Goldman Sachs Global Investment Research |
Source: Company data, Goldman Sachs Global Investment Research, Bloomberg |
28 November 2018 |
16 |