


vk.com/id446425943
Goldman Sachs
Russia Retail
Lenta: Operational performance to remain challenged, Neutral
Despite Lenta’s underperformance, and its recently announced buyback plans and change in openings strategy (both of which make sense in the current environment, in our view), we remain Neutral on the stock (with a revised 12m price target of US$4.24, vs. US$4.70 previously, reflecting our estimate changes) for the following reasons:
(1)We see limited support to total shareholder returns from improved FCF generation, given Lenta could consider M&A, and the sustainability of cash distribution to shareholders is difficult to predict post 2019.
(2)Operational performance is likely to remain under pressure in the short term.
We expect LFL growth to decline given Lenta’s slower expansion (diminishing support from new stores) and ongoing pressure on sales densities from rising competition.
(3) Structural challenges are likely to weigh on hypermarkets in the midto
long-term. With an increasing focus on convenience, growing online penetration and a diminishing number of suitable locations for ‘big box’ stores, we believe hypermarkets are set to underperform other formats.
(1) Limited benefits to total shareholder returns from improved FCF generation
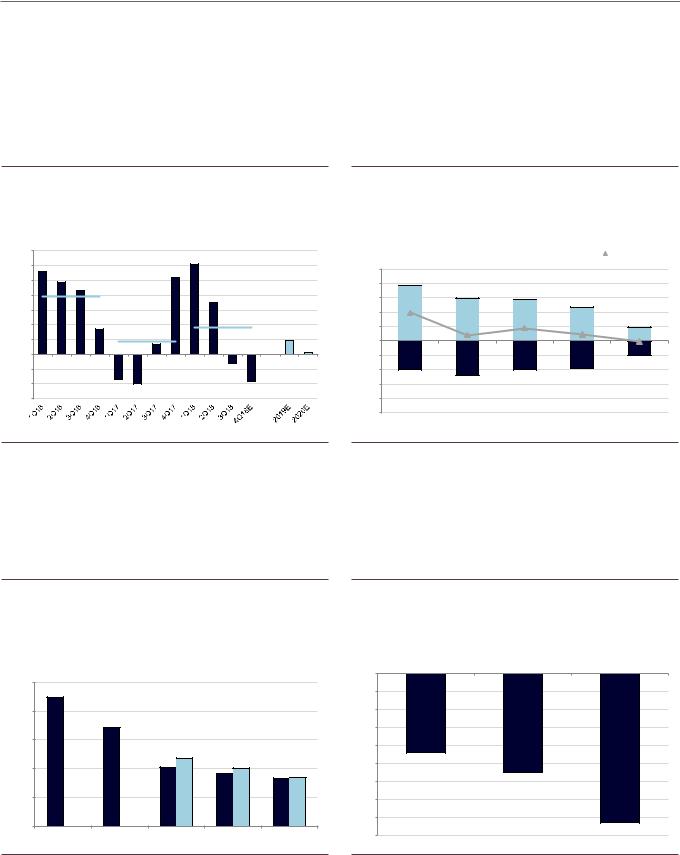
In October 2018, Lenta announced its intention to materially slow down new openings given a challenging consumer environment and fierce competition. Lenta also launched a buyback programme for the GDRs until October 2019, with total purchases of up to RUB11.6 bn, taking into account its expectation of becoming free cash flow positive in 2019. We believe the slowdown in openings and a more rational approach to capital allocation make strategic sense in the current challenging environment, but we note the following: (1) Unlike X5, Lenta intends to undertake share buybacks, the occurrence and timing of which are difficult to predict; (2) As per Lenta, the authorised amount for buybacks would not be applied in full given the low liquidity currently; (3) Lenta has indicated that it could still consider acquisitions if suitable opportunities arise, which implies uncertainty related to potential cash distribution to shareholders.
Exhibit 53: Lenta has announced plans to materially slow down hypermarket openings…
Number of hypermarket openings, total group selling space growth
|
New hypermarkets |
|
Total selling space growth |
|
60 |
|
|
|
35% |
30% |
|
|
|
|
50 |
|
|
|
30% |
|
|
|
|
|
40 |
21% |
|
|
25% |
|
|
|
|
|
30 |
|
|
|
20% |
|
|
|
15% |
|
51 |
|
9% |
|
|
20 |
40 |
|
|
|
|
|
10% |
||
|
|
|
4% |
|
10 |
|
|
4% |
|
|
18 |
|
||
|
|
5% |
||
|
|
|
9 |
9 |
0 |
|
|
|
0% |
2016 |
2017 |
2018E |
2019E |
2020E |
Exhibit 54: …which should help reduce capex and materially improve FCF
FCF yield and capex as % of sales, 2016-20E

 FCF yield
 Capex / sales
20% |
18% |
|
15% |
15% |
|
13% |
|
|
|
||
10% |
7% |
7% |
|
5% |
|
3% |
3% |
0% |
|
|
|
-5% |
-2% |
-5%
-10%
-15%
-14%
-20%
2016 |
2017 |
2018E |
2019E |
2020E |
Source: Company data, Goldman Sachs Global Investment Research |
Source: Company data, Goldman Sachs Global Investment Research |
28 November 2018 |
22 |
vk.com/id446425943
Goldman Sachs
Russia Retail
(2) Operational performance likely to remain under pressure in the short term
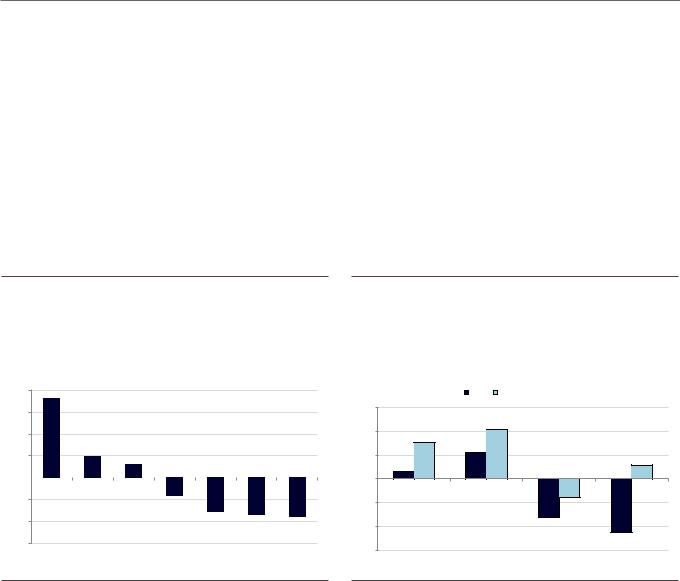
We remain cautious on Lenta’s LFL growth over the next two years (Exhibit 55) as we believe that moderating cannibalisation effects (as a result of slower expansion) will not be sufficient to offset the fading LFL boost from new openings (Lenta’s hypers mature over three years and contribute to LFL growth after 12 months of operation). We are also mindful of increasing competition that may lead to a further decline in Lenta’s vintage store sales (we define vintage stores as those that operate over three years).
Exhibit 55: We expect Lenta’s LFL growth to deteriorate… |
Exhibit 56: …as we expect a lower LFL boost from new openings |
LFL growth |
and the growing impact of increasing competition on vintage |
|
stores |
|
LFL boost from new openings and LFL in vintage stores |
7.0% |
|
|
|
|
|
6.0% |
|
|
|
|
10% |
|
|
|
|
|
|
5.0% |
3.9% |
|
|
|
8% |
|
|
|
|
||
4.0% |
|
|
|
|
|
|
|
|
|
6% |
|
|
|
|
|
|
|
3.0% |
|
1.8% |
|
|
4% |
2.0% |
|
|
|
2% |
|
0.9% |
|
1% |
|
||
1.0% |
|
|
0% |
||
|
|
|
0% |
||
0.0% |
|
|
|
|
|
|
|
|
|
-2% |
|
-1.0% |
|
|
|
|
-4% |
-2.0% |
|
|
|
|
-6% |
-3.0% |
|
|
|
|
-8% |
|
|
|
|
|
-10% |
|
|
|
LFL vintage stores |
|
|
|
LFL boost from new openings |
|
LFL hypers |
|
|
|
|
|
|
|
3.9% |
|
|
0.8% |
1.8% |
0.9% |
|
||
|
|
-0.1% |
2016 |
2017 |
2018E |
2019E |
2020E |
Source: Company data, Goldman Sachs Global Investment Research |
Source: Company data, Goldman Sachs Global Investment Research |
In terms of margins, we expect EBITDA margin to continue declining (Exhibit 57) primarily on the back of our more conservative LFL/sales density forecasts and increasing lease expenses (owing to supermarket expansion). Our expectations of a slower growth profile and a more conservative view on profitability put us 3%/4% below company-compiled consensus on EBITDA/net income over the next two years.
Exhibit 57: We expect EBITDA margin to continue declining on the back of our more conservative LFL/sales density forecasts and increasing lease expenses
EBITDA margin, 2016-20E
 GS
GS  Bloomberg cons
10.5%
10.2%
10.0% |
9.7% |
|
|
|
|
|
|
|
|
9.5% |
|
9.2% |
|
|
|
|
|
|
|
9.0% |
|
9.0% |
8.9%9.0% |
8.8% 8.8% |
|
|
|
||
8.5% |
|
|
|
|
8.0% |
|
|
|
|
2016 |
2017 |
2018E |
2019E |
2020E |
Exhibit 58: We are below consensus on all key lines for the next two years
GS vs. Company-compiled consensus , FY19-20
0% |
Sales |
EBITDA |
NI |
|
|
|
|
-1% |
|
|
|
-1% |
|
|
|
-2% |
|
|
|
-2% |
|
|
|
-3% |
-2% |
|
|
-3% |
|
-3% |
|
-4% |
|
|
|
-4% |
|
|
|
-5% |
|
|
-4% |
|
|
|
Source: Company data, Goldman Sachs Global Investment Research |
Source: Goldman Sachs Global Investment Research, Company-compiled consensus |
28 November 2018 |
23 |
vk.com/id446425943
Goldman Sachs
Russia Retail
(3) Structural challenges to weigh on hypermarkets in the medium to long term
As we highlighted in our primer on Russian retail, we believe hypermarkets are set to underperform other formats over the next decade, given an increasing consumer focus on convenience, reduction in the price gap vs. small formats, and the diminishing number of suitable locations for big boxes. We note that hypermarkets are increasingly facing competitive pressure coupled with weak consumption, which has led to particularly weak performance across the key large format chains in 1H18 (Exhibit 59).
In our view, hypermarkets are also more exposed to the risk of disruption from online than any other retail format given higher exposure to non-food as well more distant location from a customer (a trip to a distant store is not worth the benefits). We also note that Lenta is the only leading hypermarket chain in Russia with no own online sales yet and no plans at present.
Exhibit 59: We note that hypermarkets are increasingly facing competitive pressure from small formats, which coupled with weak consumption, has led to weak performance across the key large format chains
Revenue growth of key large format chains in 1H18, % YoY
20% 18%
15%
10%
5% |
|
5% |
3% |
|
|
|
|
|
|
||
0% |
|
|
|
|
|
|
|
|
|
|
|
-5% |
|
|
-4% |
|
|
|
|
|
|
|
|
-10% |
|
|
-8% |
-8% |
-9% |
-15% |
Lenta |
Hyper |
Karusel Magnit Auchan |
Metro |
OKEY |
|
|||||
|
|
Globus |
hypers |
|
|
Exhibit 60: Given that O’KEY is barely expanding its hypermarket business, its LFL growth largely reflects performance of mature stores, which is comparable with what we estimate for Lenta’s vintage stores (as shown in Exhibit 56)
O’KEY LFL growth in hypermarkets vs. selling space increase in hypermarkets
LFL |
Selling space growth |
6% |
|
|
4% |
|
4% |
|
3% |
|
|
|
|
2% |
|
2% |
1% |
1% |
|
|
|
|
0% |
|
|
-2% |
|
-2% |
-4% |
|
-3% |
|
|
-5% |
-6%
2015 |
2016 |
2017 |
2018E |
Source: Company data, Infoline |
Source: Company data, Goldman Sachs Global Investment Research |
28 November 2018 |
24 |
vk.com/id446425943
Goldman Sachs
Russia Retail
Valuation, price target and estimate changes
Valuation
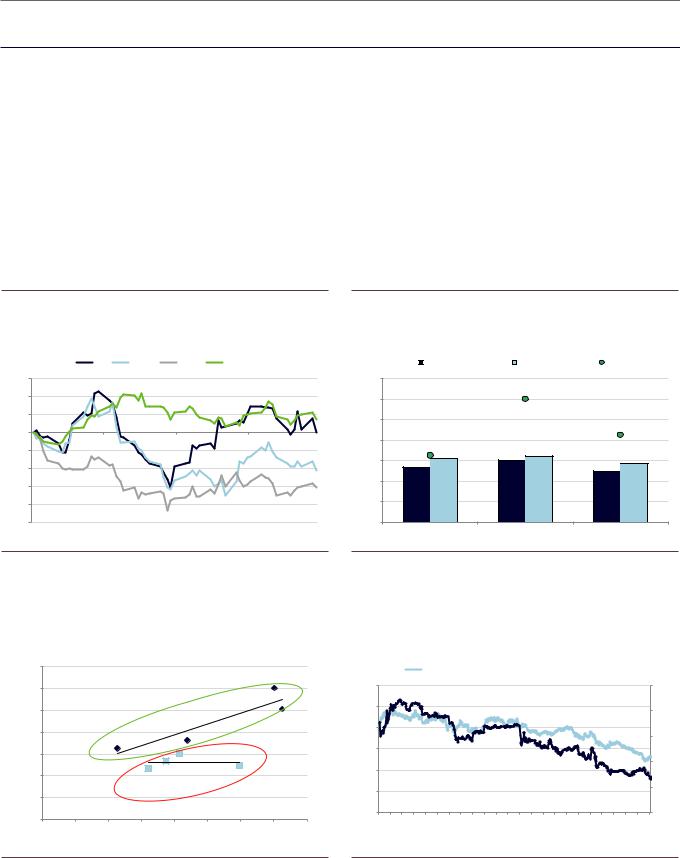
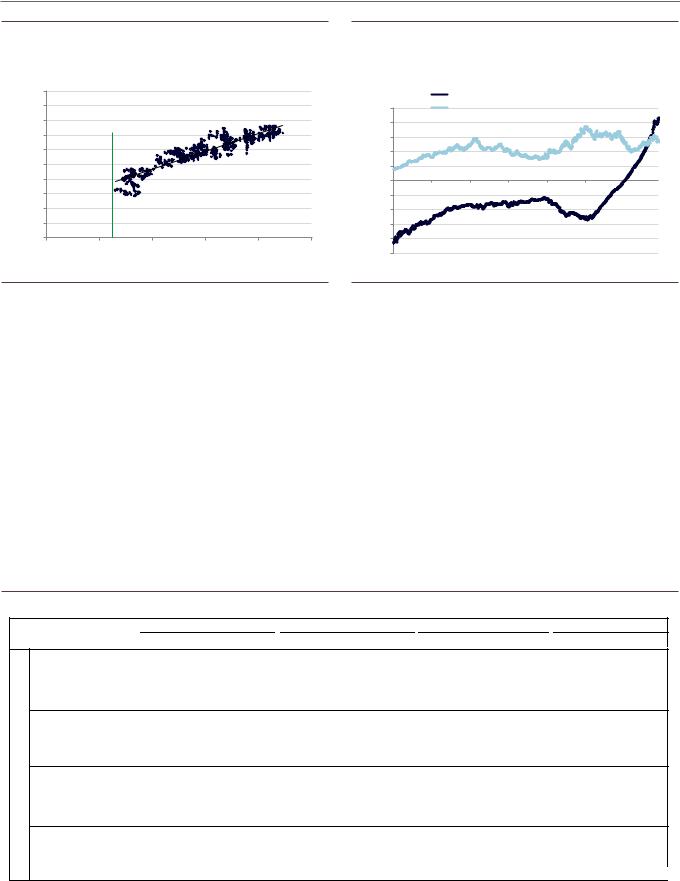
In our September update we adjusted our EV/EBITDA target multiples across our Russian food retail coverage: we value the largest retailers (X5, Magnit and Lenta) at c.6x 2019E EV/EBITDA, which implies c.10% upside to current 2019 valuation multiples. Based on our analysis of historical retail valuations, we see a strong correlation between EV/EBITDA multiples and expected growth profiles, which we believe supports our target valuation for the food retailers (Exhibit 65). We also note that our earnings-based valuation does not yet incorporate an improving FCF profile (FCF yields appear to be more attractive now vs. SA food retail), and we would view this as potential upside to retail valuations together with improving macro momentum.
Exhibit 61: X5 has outperformed its peers over the last three |
Exhibit 62: We value all the largest retailers at c.6x 2019 EV/EBITDA |
months, but it is still below the Russian market average |
2019E EV / EBITDA (market valuation, target multiple) vs. 5y average |
Share price performance |
|
|
X5 |
MGNT |
LNTA |
MSCI RU |
15% |
|
|
|
14.0 |
10% |
|
|
|
12.0 |
|
|
|
|
|
5% |
|
|
|
10.0 |
|
|
|
|
|
0% |
|
|
|
8.0 |
|
|
|
|
|
-5% |
|
|
|
|
-10% |
|
|
|
6.0 |
|
|
|
|
|
-15% |
|
|
|
4.0 |
|
|
|
|
|
-20% |
|
|
|
2.0 |
|
|
|
|
|
-25% |
|
|
|
- |
Sep-18 |
Sep-18 |
|
Oct-18 |
Nov-18 |
2019E current valuation |
2019E Target multiple |
5y average |
X5 |
Magnit (GDR) |
Lenta |
Source: FactSet |
|
Source: FactSet, Goldman Sachs Global Investment Research |
|
|
|
Exhibit 63: We now see limited correlation between EBITDA |
|
Exhibit 64: Based on our analysis, we see earning growth as the |
margin and the valuation multiple |
|
key driver of retailers’ valuations over the last three years... |
EBITDA margin vs EV /EBITDA, 2016 and 2019E |
|
12m fwd EV/EBITDA (X5, Magnit, Lenta) and Y2 (next year) EBITDA |
|
|
growth |
EV / EBITDA
14.0x |
|
|
|
|
|
|
|
|
12.0x |
|
|
2016 |
|
MGNTq.L |
|
||
|
|
|
|
|
||||
|
|
|
|
|
|
|
||
10.0x |
|
|
|
|
|
|
|
LNTAq.L |
|
|
|
|
|
|
|
|
|
8.0x |
|
|
OKEYq.L |
|
PJPq.L |
|
|
|
|
|
|
|
|
|
|
||
|
|
|
|
|
|
|
|
|
6.0x |
|
|
|
MGNTq.L |
|
|
|
|
|
|
|
|
|
|
|
||
4.0x |
|
|
OKEYq.L |
PJPq.L |
LNTAq.L |
|
|
|
|
|
|
|
|
|
|
||
|
|
|
|
|
|
|
|
|
2.0x |
|
|
|
|
|
2019E |
|
|
0.0x |
|
|
|
|
|
|
|
|
3.0% |
4.0% |
5.0% |
6.0% |
7.0% |
8.0% |
9.0% |
10.0% |
11.0% |
EBITDA margin
12m fwd EV / EBITDA (lhs) |
|
Y2 EBITDA growth (rhs) |
|
12.0 |
|
|
|
|
|
|
|
|
|
|
|
|
|
|
|
|
|
|
|
|
|
|
30% |
10.0 |
|
|
|
|
|
|
|
|
|
|
|
|
|
|
|
|
|
|
|
|
|
|
25% |
|
|
|
|
|
|
|
|
|
|
|
|
|
|
|
|
|
|
|
|
|
|
|
|
8.0 |
|
|
|
|
|
|
|
|
|
|
|
|
|
|
|
|
|
|
|
|
|
|
20% |
|
|
|
|
|
|
|
|
|
|
|
|
|
|
|
|
|
|
|
|
|
|
|
|
6.0 |
|
|
|
|
|
|
|
|
|
|
|
|
|
|
|
|
|
|
|
|
|
|
|
4.0 |
|
|
|
|
|
|
|
|
|
|
|
|
|
|
|
|
|
|
|
|
|
|
15% |
|
|
|
|
|
|
|
|
|
|
|
|
|
|
|
|
|
|
|
|
|
|
|
|
2.0 |
|
|
|
|
|
|
|
|
|
|
|
|
|
|
|
|
|
|
|
|
|
|
10% |
|
|
|
|
|
|
|
|
|
|
|
|
|
|
|
|
|
|
|
|
|
|
|
|
0.0 |
|
|
Jul-15 |
|
|
|
|
|
Jul-16 |
|
|
|
|
|
Jul-17 |
|
|
|
|
|
Jul-18 |
|
5% |
Jan-15 |
Mar-15 |
May-15 |
Sep-15 |
Nov-15 |
Jan-16 |
Mar-16 |
May-16 |
Sep-16 |
Nov-16 |
Jan-17 |
Mar-17 |
May-17 |
Sep-17 |
Nov-17 |
Jan-18 |
Mar-18 |
May-18 |
Sep-18 |
Nov-18 |
Source: Goldman Sachs Global Investment Research, FactSet |
Source: Bloomberg, Goldman Sachs Global Investment Research |
28 November 2018 |
25 |
vk.com/id446425943
Goldman Sachs
Russia Retail
Exhibit 65: ...and c.6x EV/EBITDA is supported by historical analysis
12m fwd EV/EBITDA (X5, Magnit, Lenta) and Y2 (next year) EBITDA growth
|
12.0 |
|
|
|
|
|
|
11.0 |
2019-20E EBITDA |
|
|
R† = 0.8514 |
|
|
10.0 |
|
|
|
||
EV/EBITDA |
7.0 |
growth for Russian retail |
|
|
|
|
|
9.0 |
|
|
|
|
|
|
8.0 |
|
|
|
|
|
fwd |
6.0 |
|
|
|
|
|
12m |
5.0 |
|
|
|
|
|
|
|
|
|
|
|
|
|
4.0 |
|
|
|
|
|
|
3.0 |
|
|
|
|
|
|
2.0 |
|
|
|
|
|
|
5% |
10% |
15% |
20% |
25% |
30% |
Expected Y2 EBITDA growth
Source: Bloomberg, Goldman Sachs Global Investment Research
Exhibit 66: Our target multiples are largely growth driven and do not yet reflect improving FCF generation
12m fwd FCF yield, Russia and SA food retail
|
|
|
Russian retail 12M fwd free cash flow yield, % |
|
|||
|
5.0% |
|
SA retail 12M fwd free cash flow yield, % |
4.3% |
|||
|
|
|
|
|
|
|
|
% |
4.0% |
|
|
|
|
|
|
3.0% |
|
|
|
|
|
|
|
yield, |
|
|
|
|
|
2.7% |
|
2.0% |
|
|
|
|
|
||
flow |
1.0% |
|
|
|
|
|
|
cash |
0.0% |
|
|
|
|
|
|
free |
-1.0% |
|
|
|
|
|
|
fwd |
|
|
|
|
|
|
|
-2.0% |
|
|
|
|
|
|
|
12M |
|
|
|
|
|
|
|
-3.0% |
|
|
|
|
|
|
|
|
|
|
|
|
|
|
|
|
-4.0% |
|
|
|
|
|
|
|
-5.0% |
|
|
|
|
|
|
|
Jan-12 |
Jan-13 |
Jan-14 |
Jan-15 |
Jan-16 |
Jan-17 |
Jan-18 |
Source: FactSet, Goldman Sachs Global Investment Research
Price target and estimate changes
We revise our estimates for the food retailers in our coverage, incorporating latest results, updated management guidance and other changes (Exhibit 67). For X5, our EPS estimates decline by 12% for 2018-20, largely as a result of higher leverage assumptions, as we now expect more capital to be allocated towards dividends (we expect 100% payout in 2019-20) rather than deleveraging (we marginally increase our target multiple to reflect this - owing to rounding, our target multiple stays at 6x). For Lenta, we incorporate a weaker margin outlook (as a result of negative operating leverage), slower expansion plans from 2019 and its recently announced buyback programme. For Magnit, we incorporate lower growth/EBITDA margin assumptions in 2019, as we now expect a recovery in 2020 vs. 2019 previously as new refurbishments need time to achieve scale. For O’Key, we incorporate recent results, which drives a 14% cut in our EPS estimates for 2018-20.
Exhibit 67: Summary of estimate changes
|
|
|
|
|
Sales |
|
|
EBITDA |
|
|
EBITDA margin |
|
|
EPS, Rub |
|
|
|
|
|
|
2018E |
2019E |
2020E |
2018E |
2019E |
2020E |
2018E |
2019E |
2020E |
2018E |
2019E |
2020E |
|
|
|
Magnit GDR |
New |
1,235,507 |
1,379,908 |
1,573,945 |
89,576 |
98,361 |
115,532 |
7.3% |
7.1% |
7.3% |
68.0 |
73.1 |
90.3 |
|
|
|
|
||||||||||||||
|
|
Rub mn |
old |
1,235,146 |
1,404,451 |
1,587,648 |
90,674 |
103,696 |
116,776 |
7.3% |
7.4% |
7.4% |
68.9 |
80.6 |
93.1 |
|
|
|
|
% chng |
0.0% |
-1.7% |
-0.9% |
-1.2% |
-5.1% |
-1.1% |
-0.1p.p. |
-0.3p.p. |
0.0p.p. |
-1.3% |
-9.3% |
-3.0% |
|
|
|
|
% vs cons |
-1.8% |
-0.1% |
2.6% |
-2.3% |
-3.8% |
1.4% |
1.8p.p. |
1.6p.p. |
1.9p.p. |
-3.8% |
-8.2% |
-1.3% |
|
|
|
X5 Retail Group |
New |
1,529,474 |
1,767,428 |
1,995,710 |
105,761 |
119,315 |
132,159 |
6.9% |
6.8% |
6.6% |
110.5 |
132.9 |
147.9 |
|
|
|
Rub mn |
old |
1,535,117 |
1,809,412 |
2,060,004 |
105,737 |
124,729 |
141,280 |
6.9% |
6.9% |
6.9% |
116.4 |
153.2 |
178.8 |
|
|
|
|
% chng |
-0.4% |
-2.3% |
-3.1% |
0.0% |
-4.3% |
-6.5% |
0.0p.p. |
-0.1p.p. |
-0.2p.p. |
-5.0% |
-13.2% |
-17.3% |
|
|
Russia |
|
% vs cons |
-0.3% |
-0.1% |
0.1% |
-1.1% |
-2.5% |
-2.9% |
-0.1p.p. |
-0.2p.p. |
-0.2p.p. |
-8.7% |
-9.1% |
-12.7% |
|
|
O’KEY Group |
New |
160,467 |
166,619 |
177,098 |
8,821 |
9,947 |
11,096 |
5.5% |
6.0% |
6.3% |
5.0 |
9.4 |
12.7 |
|
|
|
|
|
||||||||||||||
|
|
Rub mn |
old |
162,414 |
172,008 |
187,825 |
9,091 |
10,623 |
11,818 |
5.6% |
6.2% |
6.3% |
5.8 |
11.3 |
14.5 |
|
|
|
|
% chng |
-1.2% |
-3.1% |
-5.7% |
-3.0% |
-6.4% |
-6.1% |
-0.1p.p. |
-0.2p.p. |
0.0p.p. |
-14.3% |
-16.1% |
-12.8% |
|
|
|
|
% vs cons |
-8.0% |
-10.5% |
-11.3% |
-8.6% |
-5.6% |
-5.9% |
0.0p.p. |
0.3p.p. |
0.4p.p. |
-4.7% |
na |
na |
|
|
|
Lenta |
New |
418,214 |
459,292 |
485,192 |
37,749 |
40,941 |
42,877 |
9.0% |
8.9% |
8.8% |
27.8 |
32.6 |
37.2 |
|
|
|
Rub mn |
old |
426,358 |
485,265 |
546,890 |
39,162 |
43,812 |
48,756 |
9.2% |
9.0% |
8.9% |
29.6 |
36.9 |
42.9 |
|
|
|
|
% chng |
-1.9% |
-5.4% |
-11.3% |
-3.6% |
-6.6% |
-12.1% |
-0.2p.p. |
-0.1p.p. |
-0.1p.p. |
-6.0% |
-11.7% |
-13.2% |
|
|
|
|
% vs cons |
-0.8% |
-1.0% |
-3.4% |
-2.5% |
-2.1% |
-3.4% |
-0.2p.p. |
-0.1p.p. |
0.0p.p. |
-4.1% |
-4.6% |
-3.8% |
|
|
|
|
|
|
|
|
|
|
|
|
|
|
|
|
|
|
Source: Goldman Sachs Global Investment Research, Bloomberg
28 November 2018 |
26 |

vk.com/id446425943
Goldman Sachs
Russia Retail
Exhibit 68: Summary of changes to our 12-month price targets
Last close is as of November 26, 2018
|
Company |
12m TP |
Share |
Upside, % |
Rating |
|
Methodology |
Key Risks |
|
||
|
New |
Old |
price |
|
|
|
|
|
|||
|
|
|
|
|
|
|
|
|
|||
|
X5 Retail Group |
$29.6 |
$28.7 |
$24.1 |
23% |
Buy |
6x |
@ 2019E |
EV/EBITDA |
(1) Intensifying competition, (2) Further changes in the management team, (3) Macro risks, (4) Capex |
|
|
overruns caused by increased store openings, (5) worse-than-expected cost control, and (6) value-eroding |
|
|||||||||
|
|
|
|
|
|
|
|
|
|
acquisitions |
|
|
Lenta |
$4.24 |
$4.70 |
$3.5 |
21% |
Neutral |
6x |
@ 2019E |
EV/EBITDA |
(1) increasing/softening competition, (2) higher/lower-than-expected LFL sales, (3) better/worse cost |
|
|
control, (4) improvement/deterioration in macro. |
|
|||||||||
|
|
|
|
|
|
|
|
|
|
|
|
|
Magnit (GDR) |
$15.0 |
$16.0 |
$13.0 |
16% |
Neutral |
6x |
@ 2019E |
EV/EBITDA |
|
|
|
|
|
|
|
|
|
|
|
|
(1) a deteriorating/improving macro backdrop and consumer situation in Russia, (2) higher/lower |
|
|
|
|
|
|
|
|
|
|
|
competition, (3) better/worse execution on its operational turnaround, cost optimisation and capital |
|
|
|
|
|
|
|
|
|
|
|
investments |
|
|
Magnit (Locals) |
RUB 4,100 |
RUB 4,470 |
RUB 3,490 |
17% |
Neutral |
5x |
@ 2019E EV/EBITDA |
|
|
|
|
O’KEY Group |
$1.9 |
$2.1 |
$1.7 |
14% |
Neutral |
5x |
@ 2019E |
EV/EBITDA |
(1) Higher/lower discounter openings, (2) lower/higher-than-expected LFL sales, (3) increasing/lower |
|
|
competition, (4) worse/better cost control |
|
|||||||||
|
|
|
|
|
|
|
|
|
|
|
|
|
|
|
|
|
|
|
|
|
|
|
|
|
|
|
|
|
|
|
|
|
|
|
|
Source: Goldman Sachs Global Investment Research, FactSet
28 November 2018 |
27 |