


vk.com/id446425943
Goldman Sachs
Russia Retail
Magnit: We see a bumpy road for operational turnaround, remain Neutral
Despite Magnit’s recent share price underperformance, we remain Neutral rated and our 12-month price targets fall to Rub4,100 for MGNT.MM and US$15.0 for the GDRs (from Rub4,470 and US$16.0, respectively, mainly reflecting estimate changes). While the company’s turnaround plan presented in September 2018 makes strategic sense to us, we highlight risks to operational performance over the next 12 months:
1.We now expect a delay in LFL recovery. We now see a recovery in LFL traffic as likely in 2H19, as new refurbishments need time to achieve scale, while competition in regions where Magnit is expanding is likely to remain tough.
2.There could be downside risks from the announced SIA Group acquisition.
Magnit is yet to reveal SIA’s financials - it is likely to do so in March or August 2019, when working capital could be in focus. Moreover, simplistically assuming an EBITDA margin for SIA Group in line with its key listed peer would imply downside risks to Magnit’s overall 2019 margin.
3.We see risks to group EBITDA margin in 2019, mainly owing to uncertainty over the speed of refurbishments and openings, execution on cost control and higher shrinkages. We now forecast a further decline in EBITDA margin to 7.1% in 2019 (excluding any potential dilutive impact from SIA Group) from 7.3% in 2018 (vs. our previous expectation of flat levels).
We expect a recovery in LFLs to be delayed to 2H19
Although we remain constructive on Magnit’s turnaround programme, we are now more cautious on the timing of LFL acceleration and expect a sustainable improvement (driven by renovations, changes in customer value proposition and promotional activity rather than low-quality factors such as food inflation or an easy base) to be delayed to 2H19 (Exhibit 46) owing to the following reasons:
1.The “2.0+” refurbishment programme still needs to gain scale. Magnit has been opening stores according to the new redesign programme (“redesign 2.0+”) only since July 2018, and they account for just c.5% of the total store base. At this point, we believe the new redesign programme appears to be more efficient than the old programme (new concept stores are showing a c.20% uplift in sales densities on average, per the company). However, on our calculations, these stores can reach a material share of the total base only from 2Q19 (20%+ of total stores, Exhibit 42), assuming 1,200/1,500 refurbishments in 2018/2019. Thus, we expect a positive impact from refurbishments on LFL growth to be visible only from 2H19.
2.Regional expansion plans. As per the CEO’s comments during the CMD, the key regions of growth for Magnit are expected to be Moscow, St. Petersburg and Siberia. We note that all these regions have strong existing players - e.g., X5 in Moscow and St. Petersburg and Maria-Ra/Holiday Classic in Siberia - which already occupy the best locations, in our view. Thus, we believe expansion into these regions could lead to risks of overpaying for locations and over-investing in
28 November 2018 |
17 |

vk.com/id446425943
Goldman Sachs
Russia Retail
prices/marketing to attract traffic and build brand recognition owing to which the efficiency of new store openings may decline.
3.Macro/competition may impede the turnaround. The competitive and consumer environment has changed since the time X5 underwent a turnaround (Exhibit 43); as a result, it may take longer for Magnit to make improvements. In addition, we also note the fast expansion of specialised stores in Russia that offer a unique value proposition vs. federal retail chains. As we highlighted in our previous reports, the key specialised retailers include alcohol mini-markets Krasnoe & Beloe (c.7k stores as of October 2018) and the Bristol chain (3k stores) that operate across almost all regions of Russia, as well as health food retailer Vkusvill, which enjoys strong brand recognition in Moscow.
Exhibit 41: Magnit started a new version of refurbishments from |
Exhibit 42: We expect the share of new concept stores to reach a |
July 2018 |
material level only from 2Q19 |
Number of Magnit’s convenience stores |
Share of “2.0” stores in total store base and LFL base |
Old stores |
Refurbishment "v. 1.0" |
Refurbishment "v. 2.0 and above" |
14,000 |
|
|
|
|
|
|
50% |
12,000 |
|
|
|
|
|
|
45% |
|
|
|
|
|
|
40% |
|
|
|
|
|
|
|
|
|
10,000 |
|
|
|
|
|
|
35% |
8,000 |
|
|
|
|
|
|
30% |
|
|
|
|
|
|
25% |
|
|
|
|
|
|
|
|
|
6,000 |
|
|
|
|
|
|
20% |
4,000 |
|
|
|
|
|
|
15% |
|
|
|
|
|
|
10% |
|
|
|
|
|
|
|
|
|
2,000 |
|
|
|
|
|
|
5% |
- |
|
|
|
|
|
|
0% |
|
|
|
|
|
|
|
|
1Q’17 |
2Q’17 |
3Q’17 |
4Q’17 |
1Q’18 |
2Q’18 |
3Q’18 |
4Q’18 |
-2,000 |
|
|
|
|
|
|
|
Share of "2.0" refurbished stores
Share newly refurbished "2.0" stores in total LFL store base
1Q |
2Q |
3Q |
4QE |
1QE |
2QE |
3QE |
4QE |
1QE |
2QE |
3QE |
4QE |
|
2018 |
|
|
2019 |
|
|
2020 |
|
|||
Source: Company data, Goldman Sachs Global Investment Research
Exhibit 43: We believe it may be difficult to achieve an operational turnaround similar to X5 in terms of speed and magnitude given a different macro environment now...
Average level of promo (X5, Magnit) |
Top 5 market share in modern retail |

 Overlap between X5 and Magnit
70% |
|
65%+ |
|
60% |
|
|
|
50% |
|
40% |
|
40% |
|
||
31% |
25-35% |
||
30% |
|||
|
20% |
||
20% |
10-20% |
||
|
|||
10% |
|
|
|
0% |
2013 |
2018 |
|
|
Source: Goldman Sachs Global Investment Research
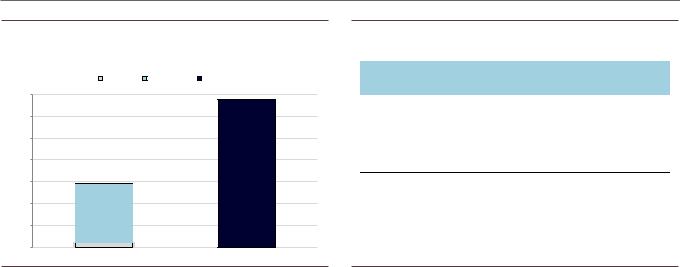
Exhibit 44: ...as well as growing competition from specialised stores
Number of selected specialised stores
|
Krasnoe & Beloe |
|
Bristol |
|
Fix Price |
|
Vkusvill |
|
|
|
|
||||
|
|
|
|
14.0 |
|
|
|
|
|
|
12.0 |
|
|
|
|
0.7 |
|
|
|
|
0.5 |
2.5 |
||
10.0 |
|
|
|
|||
|
|
0.4 |
2.5 |
|
||
|
|
|
3.1 |
|||
|
|
|
|
|||
8.0 |
|
|
2.3 |
|
||
|
0.4 |
3.0 |
|
|||
6.0 |
|
|
|
|||
|
2.1 |
2.7 |
|
|
||
|
0.3 |
|
|
|||
|
|
|
|
|||
4.0 |
2.0 |
|
|
|
||
1.7 |
|
|
6.9 |
|||
|
|
5.3 |
||||
2.0 |
1.1 |
|
3.9 |
|
||
2.6 |
|
|
||||
|
1.7 |
|
|
|
||
0.0 |
|
|
|
|
||
2014 |
2015 |
2016 |
2017 |
9m18 |
||
|
Source: Goldman Sachs Global Investment Research, Infoline |
Source: Company data, Infoline |
28 November 2018 |
18 |

vk.com/id446425943
Goldman Sachs
Russia Retail
Exhibit 45: We expect LFL in convenience to turn positive in 1Q19, |
Exhibit 46: ...while traffic will likely turn positive from 3Q19 on the |
largely supported by higher inflation and an easy base effect... |
back of refurbishments |
Convenience stores LFL decomposition |
Convenience stores LFL traffic and basket |
|
|
|
Contribution of "2.0" refurbishments |
|
|
|
LFL net of refurbishments |
|
|
|
|
||
|
|
|
|
|
|
|
|
|
LFL Traffic |
|
LFL Basket |
|
Convenince stores LFL |
|
|
|
|
|
|
|
|
|
|
|
|||
Convenince stores LFL
3.0% |
|
|
|
|
|
|
|
3.0% |
|
|
|
|
|
|
|
2.0% |
|
|
|
|
|
|
|
2.0% |
|
|
|
|
|
|
|
1.0% |
|
|
|
|
|
|
|
1.0% |
|
|
|
|
|
|
|
0.0% |
|
|
|
|
|
|
|
0.0% |
|
|
|
|
|
|
|
-1.0% |
|
|
|
|
|
|
|
-1.0% |
|
|
|
|
|
|
|
-2.0% |
|
|
|
|
|
|
|
-2.0% |
|
|
|
|
|
|
|
-3.0% |
|
|
|
|
|
|
|
-3.0% |
|
|
|
|
|
|
|
-4.0% |
|
|
|
|
|
|
|
-4.0% |
|
|
|
|
|
|
|
-5.0% |
|
|
|
|
|
|
|
-5.0% |
|
|
|
|
|
|
|
-6.0% |
|
|
|
|
|
|
|
-6.0% |
|
|
|
|
|
|
|
1Q |
2Q |
3Q |
4QE |
1QE |
2QE |
3QE |
4QE 1QE 2QE 3QE 4QE |
1Q |
2Q |
3Q |
4QE |
1QE |
2QE |
3QE |
4QE 1QE 2QE 3QE 4QE |
|
2018 |
|
|
2019 |
2020 |
|
2018 |
|
|
2019 |
2020 |
||||
Source: Company data, Goldman Sachs Global Investment Research |
Source: Company data, Goldman Sachs Global Investment Research |
The SIA deal could pose downside risks to Magnit’s overall EBITDA margin
On November 2, 2018, Magnit signed a legally binding agreement for its previously announced acquisition of pharma distributor SIA Group. It indicated that the consideration for SIA is up to Rub5.7 bn and is to be paid in the form of Magnit’s ordinary shares. As per Magnit, SIA had Rub10.7 bn of debt at the time the deal was announced, implying a total enterprise value of up to Rub16.4 bn. While we know the deal values, details on working capital and margins haven’t been provided. According to Magnit, SIA Group’s financial details will be available in Magnit’s consolidated IFRS accounts either in March (in case the deal is closed before end-2018) or in August 2019 (in case the deal is closed in 1H19).
In terms of working capital, according to SPARK data (Interfax), SIA had c.Rub34 bn of accounts payable and Rub13.5 bn of receivables outstanding as of end-2017, based on Russian accounting standards. While 2017 data is based on RAS and more recent data isn’t available, we note risks related to accounts receivable (in the context of write-offs), as well as the potential for cash outflow related to accounts payable.
In terms of margins, we note simplistically that: using SIA Group’s 2017 revenues and assuming an EBITDA margin in line with that of its key listed peer Protek (which could be optimistic, given that Protek is one of the largest pharma distributors in Russia) would suggest a 20bp dilution in Magnit’s overall 2019E EBITDA margin (Exhibit 48), all else equal.
28 November 2018 |
19 |
vk.com/id446425943
Goldman Sachs
Russia Retail
Exhibit 47: SIA working capital (RAS), Rub bn, 2017 |
Exhibit 48: Peer benchmarking suggests potential margin dilution |
||
|
Sales, EBITDA (Rub bn) |
|
|
Inventory Receivables Payables |
Magnit |
SIA Pro-forma |
Comment |
35.0 |
|
|
|
|
|
|
30.0 |
|
Sales 2019E |
1,380 |
61 |
1,441 |
Asssume 2017 RAS |
|
revenue for SIA |
|||||
25.0 |
|
|
|
|
|
Assume EBITDA margin |
|
|
|
|
|
98.7 |
|
20.0 |
|
EBITDA 2019E |
97.6 |
1.1 |
in line with Protek |
|
|
|
|
|
|
Distribution (1H18) |
|
|
|
33.8 |
|
|
|
|
15.0 |
|
|
|
|
|
|
|
EBITDA margin |
7.1% |
1.8% |
6.9% |
|
|
|
|
Potential EBITDA margin |
||||
10.0 |
|
|
|
|
|
|
13.5 |
Impact |
|
|
-0.2% |
dilution from SIA deal |
|
|
|
|
|
|||
5.0 |
|
|
|
|
||
|
|
|
|
|
|
|
- |
1.1 |
|
|
|
|
|
Source: SPARK (Interfax) |
Source: Goldman Sachs Global Investment Research, SPARK (Interfax) |
Risks to margins in 2019
In our view, uncertainty with regard to Magnit’s margin profile is among the key investor concerns. We now forecast EBITDA margin to continue declining to 7.1% in 2019 from 7.3% in 2018, which puts us below Bloomberg consensus’ estimate of 7.4% in 2019 (note that we do not incorporate the SIA deal yet, as it is pending completion). In our view, the key risks to Magnit’s margin profile include the following:
1.Uncertainty over the speed of refurbishments and openings. The company has indicated that guidance for new convenience store openings and the number of store refurbishments in 2019 will be shared in January 2019. For now, we assume 1,500 convenience store openings (in line with guidance for 2018) and 1,500 store refurbishments in 2019. A higher number of openings/refurbishments could imply downside risks to our margin expectations, given the negative impact on operating leverage (e.g., it takes around a month to refurbish a store and a few months to recover sales after it has been re-opened).
2.Execution on cost control. Taking into account the scale of Magnit’s turnaround plan, we believe there might be risks in relation to cost control. In particular, we see risks that additional costs related to reorganisation of the company and decentralisation may exceed benefits from operational improvements/sales density recovery during the initial stage of the turnaround.
3.Shrinkages. In our view, expansion of the assortment matrix associated with the refurbishments together with a relatively fast roll-out may result in an increase in the level of shrinkages. We also note that X5’s shrinkage levels grew in 2015-17, as the company was focused on fast roll-out and assortment additions.
28 November 2018 |
20 |
vk.com/id446425943
Goldman Sachs
Russia Retail
Exhibit 49: While we expect sales densities to start recovering, pressure on opex should rise, in our view, owing to the company’s reorganisation and investments in customer service improvement
Sales/sqm and SG&A/sqm growth

 Sales density
 SG&A per sqm
4.0% |
|
|
|
|
|
2.3% |
|
|
|
|
1.5% |
1.6% |
|
2.0% |
|
|
|
1.4% |
||
0.0% |
|
|
|
|
|
|
-2.0% |
|
|
|
|
|
|
-4.0% |
|
|
-2.9% |
|
|
|
-6.0% |
-4.5% |
-4.5% |
|
|
|
|
-4.9% |
|
|
|
|
|
|
-8.0% |
|
-6.8% |
-7.6% |
|
|
|
|
|
|
|
|
||
|
|
|
|
|
|
|
-10.0% |
2016 |
2017 |
2018E |
2019E |
2020E |
|
|
||||||
Source: Company data, Goldman Sachs Global Investment Research
Exhibit 51: 2019E EBITDA margin sensitivity
|
EBITDA margin 2019 |
|
Sales density growth |
|
|
|||
|
|
|
|
|
|
|
|
|
|
|
7.1% |
3% |
2% |
1% |
0% |
-1% |
|
|
|
|
|
|
|
|
|
|
|
growthsqm |
-3% |
8.0% |
7.9% |
7.7% |
7.6% |
7.4% |
|
|
0% |
7.6% |
7.5% |
7.3% |
7.2% |
7.0% |
|
|
|
|
-2% |
7.9% |
7.8% |
7.7% |
7.5% |
7.3% |
|
|
/ |
|
|
|
|
|
|
|
|
SG&A |
2% |
7.2% |
7.2% |
7.0% |
6.8% |
6.6% |
|
|
|
|
||||||
|
|
3% |
7.1% |
7.0% |
6.8% |
6.6% |
6.5% |
|
|
|
|
|
|
|
|
|
|
|
|
|
|
|
|
|
|
|
Source: Goldman Sachs Global Investment Research
Exhibit 50: We expect a further decline in EBITDA margin in 2019
EBITDA margin (excluding the impact of the SIA deal, which has not yet completed)

 GS
GS 
 Bloomberg cons
12.0% |
|
|
|
|
10.0% |
|
|
|
|
10.0% |
|
|
|
|
8.0% |
8.0% |
7.3% 7.3% |
7.1%7.4% |
7.3% 7.4% |
|
||||
6.0% |
|
|
|
|
4.0% |
|
|
|
|
2.0% |
|
|
|
|
0.0% |
|
|
|
|
2016 |
2017 |
2018E |
2019E |
2020E |
Source: Company data, Goldman Sachs Global Investment Research
Exhibit 52: 2019E EBITDA margin sensitivity to openings / refurbishments
|
EBITDA margin 2019 |
|
Number of refurbishments |
|
|
|||
|
|
|
|
|
|
|
|
|
|
|
7.1% |
500 |
1,000 |
1,500 |
2,000 |
2,500 |
|
|
|
|
|
|
|
|
|
|
|
openingsof |
500 |
7.5% |
7.4% |
7.4% |
7.3% |
7.2% |
|
|
1,500 |
7.3% |
7.2% |
7.1% |
7.1% |
7.0% |
|
|
|
|
1,000 |
7.4% |
7.3% |
7.2% |
7.2% |
7.1% |
|
|
Number |
2,000 |
7.1% |
7.1% |
7.0% |
6.9% |
6.9% |
|
|
|
|
||||||
|
|
2,500 |
7.0% |
7.0% |
6.9% |
6.8% |
6.8% |
|
|
|
|
|
|
|
|
|
|
|
|
|
|
|
|
|
|
|
Source: Goldman Sachs Global Investment Research
28 November 2018 |
21 |