

Mechanical Properties of Ceramics and Composites
.pdf40 |
Chapter 1 |
29.DT Rankin, JJ Stiglich, DR Petrak, R Ruh. Hot-pressing and mechanical properties of Al2O3 with an Mo-dispersed phase. J Am Cer Soc 54(6), 277–281, 1971.
30.P Hing. Spatial distribution of tungsten on the physical properties of Al2O3-W cermets. Sci Cer 12:87–94, 1984.
31.S Hori, R Kurita, M Yoshimura, S Somiya. Influence of Small ZrO2 Additions on the Microstructure and Mechanical Properties of Al2O3. Sciences and Technology of Zirconia III, Advances in Ceramics, Volume 24A (S Somiya, N Yamamoto, H Yanagida, eds.). American Ceramics Society, Westerville, OH, 1988, pp. 423–429.
32.CP Cameron, JH Enloe, LE Dolhert, RW Rice. A Comparison of reaction vs conventionally hot-pressed ceramic composites. Cer Eng Sci Proc 11(9–10):1190–1202, 1990.
33.AM Alper. Inter-Relationship of Phase Equilibria, Microstructure and Properties in Fusion-Cast Ceramics. Science of Ceramics, 3 (G. H. Stewart, ed.). Academic Press, New York, 1967, pp. 335–369.
34.RN McNally, GH Beall. Crystallization of fusion cast ceramics and glass-ceramics. J Mat Sci 14:2596–2604, 1979.
35.P Bardhan, RN McNally. Review: fusion-casting and crystallization of high temperature materials. J Mat Sci 15:2409–2427, 1980.
36.JJ Rasmussen. Surface tension, density, and volume change on melting of Al2O3 systems, Cr2O3, and Sm2O3. J Am Cer Soc 55(6):326, 1972.
37.DJ Rowcliffe, WJ Warren, AG Elliot, WS Rothwell. The growth of oriented ceramic eutectics. J Mat Sci 4:902–907, 1969.
38.DJ Viechnicki. Single crystal growth and eutectic solidification of oxide ceramics. Mat Sci Monographs 26:281–303, 1985.
39.VS Stubican, RC Bradt, FL Kennard, WJ Minlord, CC Sorrel. Ceramic Eutectic Composites, Tailoring Multiphase and Composite Ceramics (RE Tressler, GL Messing, CG Patano, RE Newnham, eds.). Plenum Press, New York, 1986, pp. 103–114.
40.HD Keith, FJ Padden, Jr. A phenomenological theory of spherulitic crystallization. J Appl Phys 34(8):2409–2420, 1963.
41.HW Morse, JDH Donnay. Optics and structure of three-dimensional spherulites. Am Minerologie 21(7):391–426, 1936.
42.SW Freiman, LL Hench. Kinetics of crystallization in Li2O-SiO2 glasses. J Am Cer Soc 51(7):382–87, 1968.
43.SW Freiman, GY Onada, AG Pincus. Controlled spherulitic crystallization of 3BaO-5SiO2 glass. J. Am Cer Soc 55(7):354–359, 1972.
44.RE Whan, coord. Metals Handbook, Vol. 10. 9th ed ASM, Metals Park, OH, 1983.
45.JI Goldstein, DE Newbury, P Echlin, DC Joy, AP Romig, Jr., CE Lyman, C Friori, E Liffhin. Scanning Electron Microscopy and X-Ray Microanalysis. Plenum Press, New York, 1992.
46.T Rochow, P. Tucker. Introduction to Microscopy by Means of Light, Electrons, X- Rays, or Acoustics. 2nd ed. Plenum Press, New York, 1994.
47.JB Wachtman. Characterization of Materials. Butterworth-Heinemann, Stoneham, MA, 1993.
48.J-M Ting, RY Lin, Y-H Ko. Effect of powder characteristics on microstructure and strength of sintered alumina. Am Cer Soc Bul 70(7):1167–1172, 1991.
49.M McNamee, R Morrell. Textural effects in the microstructure of a 95% alumina ceramic and their relationship to strength. Sci Cer 12:629–634, 1984.
Grain and Particle Effects on Ceramic Properties |
41 |
50.RL Fullman. Measurement of particle sizes in opaque bodies. Trans. AIME. J Metals: 447–452, 4, 1953.
51.RT De Hoff, FN Rhines. Quantitative Microscopy. McGraw-Hill, New York, 1968.
52.EE Underwood, AR Colcord, RC Waugh. Quantitative Relationships for Random Microstructures, in Ceramic Microstructures; Their Analysis, Significance, and Production (R. M. Fulrath and J. A. Pask, eds.). John Wiley, New York, 1968, pp 25–52.
53.EE Underwood. Quantitative Stereology. Addison-Wesley, New York, 1970.
54.J Serra. Image Analysis and Mathematical Morphology. Academic Press, New York, 1982.
55.M Coster, JL Chermant. Précis d’ Analyse d’ Images. Editions du CNRS, Paris, 1985; 2d ed. Presses du CNRS, Paris, 1989.
56.KJ Kurzydlowski, B Ralph. The Quantitative Description of the Microstructure of Materials. CRC Press, Boca Raton, FL, 1995.
57.M Coster, JL Chermant, M Prodhomme. Quantification of Ceramic Microstructures. Q-MAT 97, Proc. Int. Conf. on Quantitative Description of Materials Microstructure. Warsaw, Pologne, 4/16–19, 1997, pp. 115–124.
58.J-L Chermant, J Serra. Automatic image analysis today. Microsc Microanal Microstruct 7:279–288, 1996.
59.J-L Chermant, M Coster. Granulometry and granulomorphy by image analysis. Acta Stereol 10(1):7–23, 1991.
60.S Michelland, B Schiborr, M Coster, J-L Chermant. Size distribution of granular materials from unthreshold images. J Microscopy 156(3):303–11, 1989.
61.J-L Chermant, M Coster, G Gougeon. Shape Analysis in R2 Space using Mathematical Morphology. J Microscopy 145(2):143–157, 1987.
62.WK Pratt. Digital Image Processing. John Wiley, New York, 1991.
63.M Coster, G Gauthier, S Mathis, J-L Chermant. Roughness and IR2 IR function analysis: applications in material science. Microsc Microanal Microstruct 7:533–539, 1996.
64.MI Mendelson. Average grain size in polycrystalline ceramics. J Am Cer Soc, 52(8):443–446, 1969.
65.NA Haroun. Grain size statistics. J Mat Sci 16:2257–2262, 1981.
66.ED Case, JR Smyth, V Monthei. Grain size determinations. J Am Cer Soc C-24, 1981.
67.PH Crayton. Microstructural Analysis from Fractures Surfaces. Surfaces and Interfaces of Glass and Ceramics, Mat. Sci. Res. 7 (V. D. Frechette, W. C. LaCourse, and V. L. Burdick, eds.). Plenum Press, New York, 1974, pp. 427–437.
68.M Coster. Morphological Tools for Analysis of Non Planar Surfaces. 8th Int. Congr. For Stereol., Irvine CA, USA, 8/27–30, 1991. Acta Sterol. 11:639–650, 1992.
69.S. Michelland-Abbe, M Coster, J-L Chermant, BL Mordeke. Quantitative fractography on microcrystalline steels by automatic image analysis. J Comp Ass Micr 3:23–32, 1991.
70.W-J Yang, CT Yu, AS Kobayashi. SEM quantification of transgranular vs. intergranular fracture. J. Am. Cer. Soc. 74 (2):290–295, 1991.
71.L Dortmans, R Morrell, G de With. CEN-VAMAS Round Robin on Grain Size Measurement for Advanced Technical Ceramics—Final Report. Nat. Physics Lab., Tedington, Middlesex VAMAS Report No. 12, 12/1992.
72.LJMG Dortmans, R Morrell, G de With. Round robin on grain size measurement for advanced technical ceramics. J Eur Cer Soc 12:205–213, 1993.
42 |
Chapter 1 |
73.RG Cortes, AO Sepulveda, WO Busch. On the determination of grain-size distributions from intercept distributions. J Mat Sci 20:2997–3002, 1985.
74.T Kinoshita, T Wakabayashi, Hiroshi, H Kubo. An equation which relates the real three-dimensional aspect ratio to the apparent cross-sectional aspect ratio. J Jap Cer Soc Intl Ed 99(9):793–796, 1991.
75.VJ Laraia, IL Rus, AH Heuer. Microstructural shape factors: relation of random planar sections to three-dimensional microstructures. J Am Cer Soc 76(6):1532–1536, 1995.
76.EM Chamot, CW Mason. Principles and use of microscopes and accessories, physical methods for the study of chemical problems. Handbook Chem Microscopy 1, 1938.
77.F Goyette, TJ Kim, PJ Gielisse. Effect of grain size on grinding high density aluminum oxide. Bul Am Cer Soc 56(11):1018, 1977.
78.GK Bansal. Effect of flaw shape on strengths of ceramics. J Am Cer Soc 59(1–2):87–88, 1976.
79.DPH Hasselman. Single Crystal Elastic Anisotropy and the Mechanical Behavior of Polycrystalline Brittle Refractory Materials. Anisotropy in Single-Crystal Refractory Compounds 2 (FW Vahldiek and SA Mersol, eds.). Plenum Press, New York, 1968, pp. 247–265.
80.D Stoyan, H-D Schnabel. Description of relations between spatial variability of microstructure and mechanical strength of alumina ceramics. Cer Intl 16:11–18, 1990.
81.F Mehran, KA Muller, WJ Fitzpatrick, W Berlinger, MS Fung. Characterization of particle orientations in ceramics by electron paramagnetic resonance. J Am Cer Soc 64(10):C-129–130, 1981.
82.LA Boatner, JL Boldu, MM Abraham. Characterization of textured ceramics by electron paramagnetic resonance spectroscopy: I. concepts and theory. J Am Cer Soc 73(8):2333–2344, 1990.
83.JL Boldu, LA Boatner, MM Abraham. Characterization of textured ceramics by electron paramagnetic resonance spectroscopy: II. formation and properties of textured MgO. J Am Cer Soc 73(8):2345–2359, 1990.
84.J Glass, JR Michael, MJ Readey, SI Wright, DP Field. Characterization of Microstructure and Crack Propagation in Alumina Using Orientation Imaging Microscopy (OIM). Sandia Report, Sandia Natl. Lab., Albuquerque, NM, SAND 96-1019•UC-404, 12/1996.
85.RW Rice. Review effects of environment and temperature on ceramic tensile strength–grain size relations. J Mat Sci 32:3071–3087, 1997.
86.RW Rice, SW Freiman, JJ Mecholsky, Jr. The dependence of strength-controlling fracture energy on the flaw-size to grain-size ratio. J Am Cer Soc 63(3–4):129–136, 1980.
87.A Kishimoto, K Endo, Y Nakamura, N Motohira, K Sugi. Effect of high-voltage screening on strength distribution for titanium dioxide ceramics. J Am Cer Soc 78(8):2248–2250, 1995.
88.A Kishimoto, K Endo, N Motohira, Y Nakamura, H Yanagida, M Miyayama. Strength distribution of titania ceramics after high-voltage screening. J Mat Sci 31:3419–3425, 1996.

2
Grain Dependence of Microcracking,
Crack Propagation, and Fracture
Toughness at 22°C
I.INTRODUCTION
This chapter addresses grain effects on crack propagation, fracture toughness, and related phenomena in nominally dense, single phase, i.e. monolithic, ceramics. Grain parameters include grain size, shape, and orientation (the latter reflecting effects of intrinsic property changes as a function of grain, crystal, orientation), as well as grain boundary phases. Grain size effects, though often neglected, have received a fair amount of investigation, and grain shape and orientation substantially less (mostly qualitative for shape). Studies, which have focused on tests designed to provide controlled crack propagation well prior to, and not necessarily culminating in, catastrophic propagation under uniaxial tensile stress, are addressed along with slow crack growth (SCG) due to environmental effects, microcracking, crack branching and bridging, and related formation of crack wake zones and R-curve effects. These lead up to, or are aspects of, the basic fracture mechanics parameters of fracture toughness (KIC) and related fracture energy (γ) via
K |
IC |
(2Eγ)1/2 |
(2.1) |
|
|
|
where the sign reflects the fact that for plane stress the term in the square root should be multiplied by l-ν2 (Poisson’s ratio)2 but is exact for plane strain conditions. Attention is also given to crack size effects and fracture mode, i.e. the extent of transversus intergranular fracture.
43
44 |
Chapter 2 |
A fundamental complication in addressing fracture toughness is that different tests often give similar results for some materials and microstructures, but different results, often significantly so, for other materials and microstructures for the same test parameters. While some factors causing these differences, such as crack size and microstructure, are recognized, much understanding is still needed, e.g. of interrelations between crack size and geometry, microcracking, crack branching, slow crack growth, and crack bridging. Another complication is the frequent inadequate material, especially microstructural, characterization, a concern it is hoped this book will aid in rectifying. However, since the full range of test and materials parameters has not been evaluated, understood, or recognized, compounding confusion and uncertainty, it is necessary to note some aspects of the different tests to indicate some probable contributions to these complexities. A further complication is that while there are many common and self-consistent trends in crack propagation tests considered in this chapter, there are differences, e.g. in fracture mode, and especially differences between grain dependences of fracture toughness and tensile strength, which are partly addressed here and more extensively in Chaps. 3, 6, 8, 9, 11, and 12.
Despite complications outlined above, much understanding has been established or can be obtained by integrating observations of fracture mode, SCG, microcracking, toughness, and strength. Thus fracture is mainly intergranular for finer grains, becoming transgranular for most grain sizes and materials; but microcracking, which can be environmentally, and is clearly G, dependent, and SCG can extend intergranular fracture to larger G. The significant maxima seen in many fracture energy and toughness tests as a function of G, originally attributed to microcracking, are now generally attributed to wake bridging or R-curve effects. However, microcracking can play a role in intergranular fracture, crack branching, and crack wake bridging or R-curve effects, as well as some other toughness and mechanical property behavior. Fracture toughness–tensile strength differences are due to basic differences in propagation of their respectively large versus small cracks, e.g. their scale to that of the microstructures.
II.TEST AND MECHANISMS BACKGROUND
A.Crack Propagation–Fracture Toughness Test Methods, Factors, and Differences
A variety of crack propagation tests exist for slow crack growth and fracture energy (γ) and toughness (KIC), which form an extensive subject themselves. Here the focus is primarily on grain effects and secondarily on related parameters, e.g. whether the assumed crack character and scale is pertinent to behavior to be evaluated. The reader is referred to other sources for the mechanics and evaluations of these methods [1–10]. These methods can be approximately ranked by
Grain Dependence of Microcracking, Crack Propagation |
45 |
the typical crack sizes they entail and these in turn broken into subgroups based on both test specimen nature and partly on the extent of stable crack propagation. Going from larger to smaller potential crack sizes, major tests employ (1) plates, i.e. double cantilever (DCB), double torsion (DT), and compact tension (CT), (2) beams the same as or very similar to those for flexural strength, i.e. notch (NB), chevron notch (CNB), indent (I, or indent fracture, IF), and (3) fractography (F, i.e. calculated from the strength and subsequently observed failure initiating flaw size, location, and geometry). This ranking by crack size, though only approximate, since it also depends on specimen sizes and the extent of crack propagation, is important, since it approximately correlates with toughness values (Table 3 of Ref. 11) and is a factor in different microstructural dependences of toughness and strength. Recent terminology distinguishing “long” and “short” cracks is a step in the right direction, but it is incomplete, because this refers to only one, neglecting the other, dimension of crack propagation; “large” and “small” are more accurate descriptions for crack size effects.
The diversity of tests is greater since there are different versions of them, especially of DCB and NB tests; no test is dominant, since each has advantages and disadvantages. Thus plate-based tests use the most material and indentation
(I) tests the least, but the latter as well as DCB and CT tests are generally not applicable for differing, especially high, temperature tests. DCB and DT tests typically provide the greatest extent of constant stress intensity propagation and the lowest achievable controlled crack velocities for SCG tests. DT, which is useful at high temperatures, uses torsion loading with a resultant long curved crack front (the direction of which depends on the direction of torsion loading) that may limit in situ observations of crack-microstructure interactions, while DCB and CT tests, along with I tests, are most amenable to such observations. NB tests using the same or similar test beams as for flexure strength are readily used at high temperatures but are less amenable to in situ crack-microstructural observations and may present serious uncertainties in the nature of the crack character involved. Sufficiently fine notches for forming a sharp crack at the notch root has been identified in finer grain alumina bodies [2, 12] but not other bodies, e.g. there is still some uncertainty even in fine grain Si3 N4 [13]. Less investigated is whether cracks from the notch are of the assumed slit nature on which the NB test is based. Fractography has shown significant deviations in NB toughnesses values due to failure from half penny rather than the assumed slit cracks, despite being done in materials that should be ideal for such tests (i.e. ZrO2 single crystals [14] and especially a silicate glass [9]). Residual stresses from indents, which depend on indent load and type (mainly Vickers versus Knoop), and whether the indents are ground off (which can raise issues of the nature of the resulting crack) can be an issue for indentation tests.
Recognizing the above issues, variations, and uncertainties, it is essential to gain further understanding of crack propagation and its microstructural dependence,
46 |
Chapter 2 |
in which case differences between the various tests can become a tool to enhance this understanding. The first of three needs is intercomparison of several tests on the same bodies, instead of only one test (often on materials of limited or no microstructural characterization). Second is much broader comparison of the microstructural dependence of toughness and tensile strength, i.e. measuring both, not just toughness. Third is more evaluation of the resultant fracture surfaces, especially where there are test variations for which a few studies have noted significant test and microstructural [15] deviations.
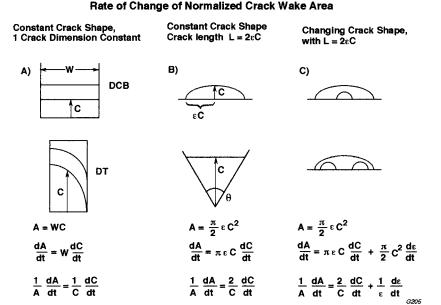
Observations of grain structure dependence of crack bridging in the crack wake zone (i.e. behind the crack front) are important but require more attention [16]. Thus they have typically been made close to the intersection of a free machined surface with large cracks arbitrarily introduced into the samples that were propagated at limited, mostly unknown, velocities and then arrested for observation. This is in contrast to cracks for normal tensile failure from the most serious defect, propagated at an accelerating, rather than an arresting, velocity, mostly into the sample bulk, not primarily along the specimen surface. Better quantification of the bridging occurrences is needed, e.g. their frequency-density as a function of microstructure, surface finish, and crack velocity and size. Except for one study using microradiography [6] (which qualitatively indicates some similar crack complexities in the interior of samples as on the surface), and some optical observations, many bridging observations are made in situ in a SEM precluding environmental effects, which may be a factor. Bridging observations, though invoked in biaxial behavior, have been made mostly or exclusively under uniaxial tensile stress and have been applied without consideration of crack geometry, despite indications that crack geometry may be a factor [16]. Thus increased toughness due to wake effects may scale with wake area, its rate of increase, or both, possibly normalized, all of which depend on basic crack shape (Fig. 2.1). Similarly, crack tip dependent processes, e.g. microcracking, crack branching (and possibly some bridging) may depend on the periphery (L) of the crack tip, its rate of increase (dL/dt), or both, again normalized by l/L. Such normalized values again differ, e.g. are 0 for expected cracks in DCB and NB, but is (l/C)(dL/dt) for some other ideal cracks, e.g. half penny cracks [17]. Recent analysis by Gilbert et al. [18] indicated that bridging is independent of crack size, if bridging scales wth crack area, but neglects possible threshold crack area/grain size or crack periphery/grain size effects on the onset and growth of bridging.
B.Slow Crack Growth
Griffith’s theory of brittle fracture [19] (originally for silicate glasses) assumed crack propagation started at a critical stress and rapidly accelerated to catastrophic failure. However, it is now known that slow crack growth (SCG) occurs in a variety of ceramics [9, 20] and other materials such as intermetallic alu-
Grain Dependence of Microcracking, Crack Propagation |
47 |
FIGURE 2.1 Idealized crack geometries for crack propagation and strength tests and their rate of generating normalized crack wake area per unit crack area (and of crack periphery, see text). Note (1) differences in wake area effects and (2) (π/2) is replaced by tan θ/2 for a triangular crack, but the net expression is the same as for elliptical cracks of constant shape. (After Rice [17], published with the permission of The Journal of the American Ceramic Society.)
minides of Ni and Fe [21]. Such SCG, which is also referred to by various terms such as stress corrosion, static fatigue, or delayed failure, occurs prior to, or in the absence of, catastrophic failure. Such growth results in reduced strengths from those for the original crack sizes, but the resultant tensile strength (σ) is generally consistent with those predicted by Griffith’s equation when the increase of crack-flaw size c is accounted for [9, 21–22] i.e.
σ = YK |
IC |
(c)-1/2 |
(2.2) |
where Y = a geometrical factor to account for flaw shape, orientation, and location. While there are still uncertainties about SCG, some of which concern its microstructural dependence as discussed later for grain and particle effects, and elsewhere for porosity effects (Chap. 4 of Ref. 5), the overall mechanisms and nature of the process are understood, at least for species that effect crack propagation at and near room temperature [10, 20], the focus of this chapter. (More
48 |
Chapter 2 |
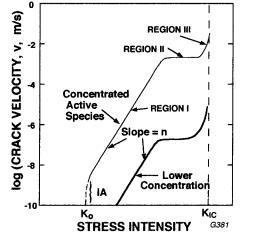
limited data on SCG due to active species at higher temperatures, e.g. of molten aluminum, are discussed in Chap. 6.) Thus SCG is an important mechanism of crack propagation, much of it at orders of magnitude lower crack velocities than those associated with initiation of catastrophic failure (Fig. 2.2). SCG occurs as a result of weakening and failure of stressed atomic bonds at crack tips due to interactions with active environmental species at lower stresses than in the absence of such species. While water is one of the most active and prevalent species for SCG in many materials, there are other species such as NH4 and hydrazine that can be active with some of the same, as well as different, materials susceptible to effects of H2O [20]. Details of chemical interactions at the crack tip may vary, since crack growth entails some balance between crack tip sharpening and blunting via local corrosion. Bulk chemical corrosion may also lower strengths, but
FIGURE 2.2 Schematic of log crack velocity versus stress intensity for environmentally driven slow crack growth (SCG). Upper and lower curves represent respectively maximum and more dilute concentration of the active environmental species, often a liquid, such as H2O. The three main stages or regions of SCG, starting from the lowest crack velocity, are controlled by (I) the reaction rate of the active species and crack tip bonds, (II) diffusion of the active species down the crack to its tip, and (III) effects of the active species dielectric properties on electrostatic interaction of bonds at the crack tip. Eq. (2.3) is used for stage I where the crack spends its greatest time (above a possible limiting stress intensity, K0, below which no environmental effect is observed, indicated mainly in soda lime glasses). Though experimental variations occur, the slope (n) is assumed to be constant, characterizing the process with curves for different concentrations, being differentiated mainly or exclusively by A [Eq. (2.3)].
Grain Dependence of Microcracking, Crack Propagation |
49 |
due to other mechanisms, e.g. corrosion often occurs when SCG does not and vice versa.
SCG measurements, e.g. by DCB and DT tests, are typically characterized by region I crack velocity (v) versus stress intensity (K) portion of the crack growth (Fig. 2.2), per the most common expression for this:
v = AKn |
(2.3) |
where A = a constant of proportionality and n = the slope, since stage I growth normally entails the longest time of the growth process. Attention is commonly focused on the exponent n as a characterization of SCG, since the parameter A changes with concentration of the active species at the crack tip, but n is generally assumed independent of concentration and reflects, and is experimentally found to be approximately so. Two other tests, dynamic fatigue (DF) and delayed failure, measure respectively strength as a function of stressing rate and the time to tensile (typically flexure) failure as a function of constant loads applied to various specimen sets. Slower loading rates and longer times of loading (at lower loads) allow more slow crack growth and hence lower strengths, and calculation of n values. Indentation induced flaws are used, especially in DF tests, to give a more uniform and identifiable starting flaw population. Details of possible effects of crack sizes (e.g. including greater possible effects of residual surface and indent stresses for smaller cracks), microstructural variations, and test factors such as inadvertently using some data points from stage IA or II in calculating n values have received limited attention but are possible factors in the scatter of n values. SCG and fast fracture are shown to be typically via respectively intergranular and transgranular fracture in polycrystals [23, 24] (Figures 2.5, 2.6), and grain size dependence of n is indicated (Fig. 2.8).
C.Occurrence and Character of Microcracking
Microcracking occurs due to microstructural mismatch strains, most commonly from differential expansion (e.g. on cooling from processing) between (1) adjacent grains of noncubic phases having inherent thermal expansion anisotropy (TEA) as a function of crystal direction or (2) particles and a surrounding matrix of different composition and thermal expansions [25–34]. Phase transformations, e.g. the tetragonal to monoclinic transformation of ZrO2, can also cause similar microcracking, as can other sources of strain differences between grains as well as grain clusters or colonies. Strain differences due to elastic anisotropy (EA, amplifying applied stresses in cubic and noncubic materials, as well as TEA stresses in the latter) or elastic differences between particles and a matrix can also contribute to such microcracking [25].
Regardless of the source of microcracking, it generally has a basic mi-