

Mechanical Properties of Ceramics and Composites
.pdf50 |
Chapter 2 |
crostructural dependence in that it does not occur until a critical size, GS, which depends on local properties [25–34] per expressions of the following nature:
G |
S |
9γ[E( )2]-1 |
(2.4) |
|
|
|
where γ = the local fracture energy pertinent to the microcracking (e.g. grain boundary or single crystal values depending on whether the microcracks are respectively interor transgranular), E = Young’s modulus, and = the mismatch strain. Strains derived from differences in thermal expansion (Δα) between two grains are = (Δα)( T), where T = the temperature difference between the onset of stress buildup (i.e. where stress relief is no longer possible, often 1200°C) and the temperature where the microcracks are formed (often > 22°C). As grain sizes increase beyond GS for a specific material, the number and size of microcracks increases until the process saturates, e.g. due to reduced body stiffness.
Different derivations of Eq. 2.4 (mostly from two-dimensional models) give its functional form with similar numerical values to 9, as does the one simple but reasonable three-dimensional model [29]. The latter equates a volume source of strain energy (e.g. about 1.5 to 2 times the grain or particle diameter) with a surface sink for that energy due to fracture around or through most or all of the grain. More detailed analysis shows somewhat more severe microcracking in three-versus two-dimensional models and differing effects of the specific character of the grain junctions [34]. Both grain shape and the location and extent of microcracking affect the process. While intergranular cracks about the size of the grains causing them are assumed and observed, transgranular cracks can frequently occur, especially at larger G, as is noted later.
Equation (2.4) does not directly address possible environmental effects on microcracking but is probably consistent with them, e.g. by reducing the γ value. This is important, since there is evidence that microcracking can depend on environmental effects, as is shown by microcracking in various HfO2 bodies not commencing until moisture was present, and taking a few days to saturate [35, 36]. Such effects (also seen in ceramic composites, Chap. 8) are probably variable due to differing (often limited) degrees of connectivity of microcracks to provide paths into the bulk of the body, but connected porosity may provide more access for environmental species even at limited porosity levels.
Microcrack observations on polished or fracture surfaces are uncertain because of effects of the free surface on the occurrence and character of microcracks intersecting such surfaces. Neutron scattering [37], and more commonly following the progressive increase of microcracking via elastic moduli and electrical or thermal conductivity measurements (and the hysteresis of these changes with temperature cycling), can provide valuable microcrack characterization (Ref. 5, Chaps. 4 and 10), as can effects on fracture toughness and acoustic emission, which are discussed in subsequent sections. Tensile (and also compressive) stresses applied to a sample before or during testing can also be

Grain Dependence of Microcracking, Crack Propagation |
51 |
important in microcracking and whether it occurs throughout the body, locally in conjunction with propagation of a macrocrack, or combinations of these. Modeling indicates that microcracking in conjunction with macrocracking commences when G 0.4GS [32, 33].
The relevance of microcracking to this book arises from its occurrence depending on G per Eq. (2.4) and the resultant G dependence of properties. Thus microcracks introduce some grain size dependence to thermal expansion (normally independent of grain size, Figure 7.10B of Ref. 5) [38] and to electrical and thermal conductivities (also often independent of grain size, especially above room temperature), as well as on mechanical properties. Effects of microcracking on fracture energy and toughness are a focus of this chapter, while tensile and compressive strengths, hardness, wear, and erosion, are discussed (to the extent that data exists) respectively in the next and subsequent chapters. Microcracking may also have broader applicability as a mechanism of crack propagation, e.g. a qualitative mechanism to explain fracture mode changing from mainly intergranular at finer G to mainly transgranular at larger grain sizes (Ref. 5, Fig. 2.3) [39, 40]. A quantitative two-dimensional model of fracture mode has also been proposed by Tatami et al. [41], which provides some guidance. But further development is needed.
1
2
FIGURE 2.3 Schematic of a possible microcrack mechanism of intergranular fracture. Crack tip stress concentrations may cause fracturing of grain boundary facets at and closely ahead of the crack (see 1 above), which are then linked to the main crack via cracking of a previously uncracked boundary (see 2 above). This favors intergranular fracture at finer grain sizes, since the stress concentrations are higher over boundary facets closer to the crack tip, while larger grains have lower stresses on boundary facets because of their inherent greater distance from the crack tip. (After Rice [39], published with the permission of the ASTM.)
52 |
Chapter 2 |
D.Microcracking and Wake Bridging Effects on Crack Propagation and Toughness
A few models have been developed to explain the often substantial grain size dependence of fracture energy and toughness found with large crack tests of some noncubic materials (Fig. 2.16) which were first attributed to microcracking. Fu and Evans [33] presented a model (later updated [42]) that at least semiquantitatively explained such noncubic fracture toughness–grain size data. Rice and Freiman [43] derived the following equation for microcracking effects on fracture energy (γm) in noncubic materials based on competition between increased energy requirements from microcrack formation ahead of the main crack versus reduced energy requirements for crack advance by linking with microcracks as:
γ |
m |
= M( )[(9E γ |
G)1/2 |
- EG] |
(2.5) |
|
b |
|
|
|
|
where M = a proportionality factor, e.g. 3, |
= the mean strain mismatch be- |
||||
tween grains, γb = the grain boundary fracture energy (assuming intergranular microcracking), and E = the local average (often the body) Young’s modulus. This model gives the maximum increase in fracture energy (hence also fracture toughness) occurring at G = (1/4)GS, independent of M. This and other microcrack models based on more rigorous mechanics [44–47] were developed based on microcracks forming at or somewhat ahead of the main crack. A model proposing that microcracks occurred mainly in two lobes extending somewhat ahead of the main crack, one well above the main crack plane and one well below it [44] (Fig. 8.2A) has not been supported by observations [48–50] and has been abandoned. However, the cessation of most study of microcracking, especially at and ahead of the main crack tip due to the focus on R-curve and related wake effects, as discussed later, is premature.
The shift to a focus on crack wake or R-curve effects was driven by observations of variable toughness increases with increasing crack propagation (then plateauing after propagation of up to 5–10 mm in typical toughness tests), the essence of R-curve effects. These occur with transformation toughening or with crack bridging in a number of, especially, larger grain noncubic, ceramics as the extent, typically the length, of the macrocrack increases. Wake effects refer to phenomena found in the region behind the tip of a propagating crack (Fig. 8.2B, typically substantially larger than natural flaws), i.e. in the region through which the crack has propagated. That R-curve effects are due to wake effects was clearly shown by the disappearance of increased toughness when the wake region was removed [51], as is discussed later. Bridging refers to portions of, complete, or multiple, grains left connecting the two sides of a crack in regions through which it has propagated (Fig. 2.4). However, as noted earlier, there are critical gaps in the data and tests, in particular the onset and extent of such effects at smaller crack sizes, especially of natural failure causing flaws and sur-

Grain Dependence of Microcracking, Crack Propagation |
53 |
FIGURE 2.4 Examples of crack bridging and related complexity in the wake region, (A) and (B) Microradiographs of fused alumina refractory (G 50–2000 µm) showing preexisting microcracks, large spherical pores, and crack tortuosity.
(C) Microradiograph of dense MgO (mixed G 25–50 µm) showing greater crack tortuosity attributed to heterogeneous grain structure (corroborated by SEM examination). (D) In situ SEM test of dense alumina (G 30–50 µm) with an as-fired surface; note the multigrain nature of the isolated crack branch-bridge ( photo center). (E) In situ SEM test of dense alumina (Lucalox) with an as-fired surface showing a fairly isolated multigrain bridge having substantial cracking (After Wu et al. [6], published with the permission of the ASTM.)
54 |
Chapter 2 |
face and environmental limitations of most observations, e.g. in situ in a SEM [6, 49, 50, 52–55] and along cracks from indents. Recent alumina testing by Tandon and Faber [56] showed a substantial strain rate dependence of toughness-type tests, indicating that the increased toughness can have substantial dependence on environmental effect, i.e. SCG of microcracks, as is discussed further later.
Several investigators have developed various crack bridging models, often focused more on mechanics of the process and less on specific microstructural effects, but some have explicitly addressed effects of grain or particle sizes and volume fractions of these involved, e.g. Refs. 57–59. Most treat bridging elements as uniform in character and spatial distribution, often require iterative solutions, and depend on adjustable parameters often obtained by data fitting which is often not precise. Typically, crack tip shielding is assumed, with some models noting that the process starts with microcrack formation, but that frictional pullout of bridges is an important factor as shown experimentally, and by simpler order of magnitude models (Sec. III.G).
Before reviewing grain structure dependence in detail it is again important to note that fracture toughness and strength behavior must be correlated, as is done elsewhere [5, 11, 60] and here in this book, since there are often major inconsistencies in the grain size dependence of these two properties. Similar discrepancies, which will be shown for ceramic composites and have been previously shown for effects of porosity [5], are critical in designing and using ceramics where fracture is an important concern. They are a reminder of the importance of measuring both strength and toughness (preferably by more than one test, especially for toughness), instead of a single measurement, as has unfortunately become common, e.g. via indentation, assuming, but not showing, that strengths will show similar trends with composition, microstructure, etc. Grain shape effects have been considered a limited amount (mainly in conjunction with bridging), as have grain orientation effects (commonly associated with grain elongation). Global effects of grain orientation on fracture toughness should generally parallel those of E, since, per Eq. (2.1), KIC and E as well as E and γ are closely related [61], as long as fracture is a simple elastic process and there is no flaw anisotropy, which occurs much more than is commonly assumed.
III.GRAIN DEPENDENCE OF CRACK PROPAGATION
A.Grain Size Dependence of Fracture Mode
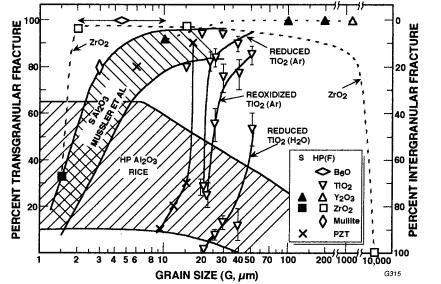
A detailed review by Rice [62] showed that the overall fracture mode of ceramics, the average trend over a complete fracture surface, is for finer grain fracture to be mainly, often exclusively, intergranular, then transition to mainly, often exclusively, transgranular fracture as grain size increases for a broad range of stress conditions. The more limited data for nonoxide ceramics is consistent with the
Grain Dependence of Microcracking, Crack Propagation |
55 |
more extensive results for oxide ceramics (Fig. 2.5). The transition between inter- and transgranular fracture at finer grain sizes is often completed by the time grain sizes have reached 1 to several microns, but it may not be completed till larger grain sizes. This transition is seen not only between different grain size bodies but also as a function of the grain distribution on a given fracture where its grain size range straddles much or all of the range of the transition found for bodies of different average grain sizes (Fig. 1.1).
The first two of three factors besides higher temperatures that can shift the transition to transgranular fracture to larger grain sizes are grain boundary phases and porosity These are probably factors in intergranular fracture often not beginning till G 1 or so microns, since obtaining finer grain sizes typically entails lower processing temperatures that may leave residual boundary impurities and porosity that enhance intergranular fracture. Porosity effects are important when there is substantial boundary coverage by pores on the scale of, or smaller than, the grains [5]. Boundary phases, important examples of which are those from oxide densification aids for AlN, Si3N4, and SiC, commonly play an important role in extending intergranular fracture by themselves and in conjunction
FIGURE 2.5 Transand intergranular fracture of oxide ceramics versus gram size. Note that most materials have mainly transgranular fracture, except at finer grain sizes, and, at least for some materials, at large (Al2O3 here) and very large grain sizes (ZrO2 here). Very large G for Y2O3 and ZrO2 are from fused ingots. (After Rice [62], published with the permission of the American Ceramic Society.)
56 |
Chapter 2 |
with the third source of shifting the transition to larger G, namely SCG. Thus while the transition between interand transgranular fracture is typically shifted to larger grain sizes with SCG in the absence of boundary phases, such phases can cause SCG, shift the transition to larger grain sizes, or both, as is discussed in the next section.
A mechanism of intergranular fracture has been proposed based on microcracking of grain boundary facets at, and just ahead of, the macrocrack tip (Fig. 2.3), which then connects with them as a mechanism of its advance. Such microcracking should be more extensive at finer grain sizes due to higher net stress concentrations across smaller grain facets at and close to the crack tip, and less as grain size increases. TEA stresses, which occur only in noncubic materials, are independent of, but can add to the, applied stresses, extending the range of microcracking. EA, which occurs in both cubic and noncubic materials, locally alters the applied and TEA stresses, so its effects on microcracking clearly drop off significantly as a function of distance from the crack tip. The two-dimen- sional model of Tatami et al. [41] also provides an explanation for the inter–transgranular fracture transition but does not account for TEA and EA, which are probably basic reasons why the predictions are inconsistent with some increased intergranular fracture trends at intermediate and larger grains (discussed below).
Partial to complete transition back to intergranular fracture occurs at larger, often very large, grain sizes in at least some ceramics. Though there is often substantial variation, there is a common trend for some increase in intergranular fracture of alumina as grain size increases at larger grain sizes (Fig. 2.5). This contrary trend in the normal G range versus other common ceramics is also indicated in TiB2 [62], suggesting that the substantial TEA in both these materials is a factor. This is supported by the observations of transgranular fracture being the dominant mode at G 2 µm, diminishing to a minority mode by 20 µm in less anisotropic MgTi2O5 [63], this transition being at even finer grain sizes in more anisotropic Fe2TiO5 [26, 27]. Thus the decrease in transgranular fracture with increasing grain size in noncubic materials is attributed to increasing effects of TEA on fracture. Such attribution to TEA effects is tentative, since the database is limited, and there are some potentially inconsistent observations; B4C, with nearly identical TEA as Al2O3 [64] retains transgranular fracture to at least G 200 µm. However, this may be associated with the extensive twinning that is commonly indicated in B4C, especially in larger grains.
Transitioning back to primarily intergranular fracture is also indicated in cubic materials, but at much larger than normal grain sizes [62]. Thus polycrystalline ingots from skull melting of CaO, MgO, and ZrO2 (Figure 1.7) show progressively increasing intergranular separation in the order listed as the grain diameters increase typically to 1 to several centimeters. Elastic anisotropies of these materials, respectively 0, 2+, and 6–10% at room temperature, all in-
Grain Dependence of Microcracking, Crack Propagation |
57 |
crease as temperature increases [65], i.e. are higher where intergranular cracking is likely to initiate. (Note that at 8% EA the maximum-to-minimum E ratio is 2.) This correlation of intergranular fracture at very large grain sizes to EA is consistent with and supports similar TEA effects, but further evaluation is necessary. Varying combinations of TEA and EA effects is probably an important factor in variations in fracture mode, e.g. between TiB2 and Al2O3 (and other related behavior).
B.Grain Dependence of Slow Crack Growth and Other Environmental Effects
While only a few key studies of slow crack growth directly address its grain dependence, these and other data clearly show that grains frequently can have substantial effect on slow crack growth. Consider first a comparison of single crystal and polycrystalline data on the same material, with a key case being MgO. Shockey and Groves’s [66] DCB tests showed that there was no SCG, i.e. water vapor had no effect, on {100} fracture (cleavage) of MgO crystals; in fact, tests in liquid water increased toughness by 30%. They correlated increased toughness with increased fracture surface roughness [66, 67] but did not associate the increased roughness with enhanced dislocation activity. Freiman and McKinney [68] also found no SCG in DCB tests of MgO crystals for {100} or {110} cleavage. In contrast to no SCG in MgO crystals, Rhodes et al. [69] showed SCG occurred in dense polycrystalline MgO, but by intergranular fracture, which appeared to be associated with grain boundary impurities (in bodies with G 26–46 µm). Little or no SCG occurred in the highest purity ( 99.98%), largest grain body, but SCG clearly occurred in bodies with higher impurity content (to0.4%), much of which was at grain boundaries, e.g. single or mixed oxides of Ca, Na, and Si (typical of most high-purity MgO powders), as well as residual Li and F in bodies made with LiF additions.
Grain boundaries allowing the occurrence of SCG via even very limited levels of grain boundary phases in materials that have no intrinsic susceptabiliy to environmentally driven SCG were also shown in a study of Si3N4 [70] and a review of fracture mode in ceramics [62]. These showed nonoxides commonly made with oxide additions leaving a few percent residual oxide-based grain boundary phases, e.g. SiC (+Al2O3), AlN (+CaO or Y2O3), and Si3N4 (+MgO, Al2O3, Y2O3, etc.) showed SCG due to H2O via predominant to exclusive intergranular fracture. On the other hand, bodies made without such additives, e.g. CVD SiC or Si3N4, and RSSN, or SiC made with B+C or B4C additions, showed no SCG. Further, tests of Si3N4 bodies with oxide additions also often showed a crack size dependence of SCG, i.e. bodies with oxide additives commonly showed delayed failure, hence SCG, with normal strength controlling flaws, but not in larger scale crack, e.g. DCB or DT, tests. In some cases, large cracks
58 |
Chapter 2 |
showed no SCG, and in other cases they showed evidence of some initial, limited, erratic SCG, which then ceased. This significant difference as a function of crack size was attributed to incomplete second-phase coverage of boundaries to provide a sufficiently continuous boundary phase path for SCG with larger cracks. However, many such bodies should have sufficient contiguity of boundaries with adequate second-phase content for SCG along the much smaller crack fronts to allow sufficient crack growth from natural flaws in many delayed failure tests. Thus SCG due to H2O could occur with small flaws because of the limited number of grain boundaries needed with sufficient second-phase content balanced by the significant number of small flaws, while with much larger cracks, regions of insufficient boundary oxide phase were frequently encountered either initially or with limited, erratic propagation of the large crack. This evaluation implies that strength losses in delayed failure of such nonoxides made with oxide additions should be limited when cracks grow to sizes where sufficient contiguity of boundary phases no longer occurs. Nonoxides made without oxide additions, but having some oxide contamination, may also show some, probably variable, SCG, due to limited or irregular distribution of the oxide contamination, e.g. as indicated by limited, variable SCG in materials such as TiB2 and B4C.
While intergranular fracture via SCG may often occur due to boundary phases that are susceptible to environmental SCG, such SCG fracture due to environment is also observed in materials that exhibit SCG in single crystal form, e.g. Al2O3 and MgF2 [23, 24, 62, 71]. Thus while boundary phases can play an important role in intergranular SCG, this may reflect other environmental and microstructural effects. For example, some intergranular fracture may reflect varying environmental effects of the range of crystal orientations required to accommodate transgranular fracture in polycrystalline bodies, especially randomly oriented ones; i.e. some intergranular SCG may simply reflect grains unfavorably oriented for transgranular SCG.
An important aspect of intergranular SCG is that following catastrophic fracture is often transgranular, i.e. SCG often shifts the transition to mainly or exclusively transgranular fracture (Fig. 2.5) to larger G only over the SCG area. This interto transgranular fracture transition with the change from SCG to fast fracture often provides definition of the SCG region (Fig. 2.6). Particularly clear occurrences of such interto transgranular transitions have been observed in Al2O3, MgF2, and ZnSe [23, 24, 71]. However, at least one important deviation from this, i.e. the reverse trend, has been observed by Beauchamp and Monroe [52, 53], namely SCG via more transgranular fracture and fast fracture via more intergranular fracture in a larger grain ( 35 µm, with less Ca at the grain boundaries) versus a finer grain ( 24 µm) Mn Zn ferrite (see also the note at the end of this chapter). They also observed that crack velocity and the stress intensity for crack growth initiation were dependent on prior history, as have a few others.

Grain Dependence of Microcracking, Crack Propagation |
59 |
FIGURE 2.6 Example of the change from intergranular SCG to fast transgranular fracture in hot pressed alumina ( 2% porosity, strength 290 MPA). (A) Lower magnification SEM showing fracture origin (bottom center). (B) and (C) Higher magnification SEMs of respectively intergranular fracture due to SCG and transgranular fracture adjoining this and for the rest of the fracture (After Rice [71], published with the permission of the Journal of the American Ceramic Society.)
Tests by Rice and Wu [72, 73] comparing the strengths of specimens in air at 22°C versus in liquid nitrogen (-196°C, eliminating SCG with only a modest change in strength due to a 2–4% increase in E with decreased temperature) showed SCG in various materials. Single crystals of both stoichiometric MgAl2O4 (for {100} or {110} fracture) and cubic ZrO2 (+20 w/o Y2O3)