


Electrical Activity of the Heart |
3 |
PROPERTIES OF CARDIAC TISSUE
Different cells within the heart are specialized for different functional roles. In general, these specializations are for automaticity, conduction, and/or contraction.
Automaticity
Cardiac cells initiate action potentials spontaneously. Further, the cells are elec trically coupled via gap junctions. Thus, when a cell fires an action potential, it typically sweeps throughout the heart. Although all cardiac tissue shows sponta neous depolarization, only the following 3 are germane.
•Sinoatrial (SA) node cells are specialized for automaticity. They spon taneously depolarize to threshold and have the highest intrinsic rhythm (rate), making them the pacemaker in the normal heart. Their intrinsic rate is - 100/min.
•Atrioventricular (AV) node cells have the second highest intrinsic rhythm (40-60/min). Often, these cells become the pacemaker if SA node cells are damaged.
•Although not "specialized" for automaticity per se, Purkinje cells do exhibit spontaneous depolarizations with a rate of - 35/min.
Conduction
Allcardiac tissue conducts electrical impulses, but the following are particularly specialized for this function.
•AV node: These cells are specialized for slow conduction. They have small diameter fibers, a low density of gap junctions, and the rate of depolarization (phase 0, see below) is slow in comparison to tissue that conducts fast.
•Purkinje cells: These cells are specialized for rapid conduction. Their diameter is large, they express many gap junctions, and the rate of depo larization (phase 0, see below) is rapid. These cells constitute the HIS Purkinje system of the ventricles.
Contraction
Although myoctes have a spontaneous depolarization and they conduct electrical impulses, they contain the protein machinery to contract.
Conduction Pathway
Because cells are electrically coupled via gap junctions, excitation to threshold of one cell typically results in the spread of this action potential throughout the
MEDICAL 37

Section II • Excitable Tissue
heart. In the normal heart, the SA node is the pacemaker because ithasthe high est intrinsic rhythm. Below is the normal conduction pathway for the heart.
atrial muscle
SA node-/+- internodal fibers-+-AV node (delay)-+- Purkinje fibers -+- ventricular muscle
CARDIAC ACTION POTENTIALS
Resting Membrane Potential (Non-Nodal Cells)
Potassium conductance is high in resting ventricular or atrial myocytes. This is also true for Purkinje cells. Because ofthis, resting membrane potential is close to K+ equilibrium potential. This high-resting K+ conductance is the result to 2 major types ofchannels.
Ungatedpotassium channels
Always open and unless the membrane potential reaches the potassium equilib rium potential (- -95 mV), a potassium flux (efflux) is maintained through these channels.
Inward K'" rectifying channels 0K1)
•Voltage-gated channels that are open at rest.
•Depolarization closes.
•They open again as the membrane begins to repolarize.
Action Potential (Non-Nodal Cells)
Understanding the ionic basis ofcardiac action potentials is important for un derstanding both cardiac physiology and the electrocardiogram (ECG), which is a recording of the currents produced by these ionic changes. In addition, antiarrhythmic drugs exert their effects by binding to the channels that produce these ionic currents.
In thissection,we go through the various phases oftheaction potentials that occur in myocytes and Purkinje cells. Action potentials generated by nodal cells (SA and AV) are discussed later. Although there are slight differences in the action poten tials generated by atrial and ventricular myocytes, as well as Purkinje cells, these differences are not included here. Furthermore, it is important to remember that cardiac cells are electrically coupled by gap junctions. Thus, when a cell fires an ac tion potential, it spreads and is conducted by neighboring cells.
Figure 11-3-1 shows the labeled phases ofthe action potential from a ventricular myocyte and the predominant ionic currents related to the various phases.
38 MEDICAL


Chapter 3 • ElectricalActivity of the Heart
Phase 4
•Resting membrane potential
•Given this tissue is specialized for automaticity (see above), these cells show a spontaneous depolarization at rest. This spontaneous depolar ization is referred to as the "pacemaker" potential and results from:
-Inward Ca2+ current: Primarily related to T-type Ca2+ channels.
These differ from the L-type in that they open at a more negative membrane potential (- -70 mV).
-InwardNa+ current: This inward Na+ current is referred to as the "funny" current (If) and the channel involved is a hyperpolarization activated cyclic nucleotide-gated (HCN) channel. HCN are non selective monovalent cation channels and thus conduct both Na+ and K+. However, opening of these channels evokes a sodium-mediated depolarization (similar to nicotinic receptors, see previous chapter). These channels open when the membrane repolarizes (negative membrane potential), and they close in response to the depolariza tion of the action potential.
-Outward K+ current: There is a reduced outward K+ current as the cell repolarizes after the action potential. Reducing this current helps to produce the pacemaker potential.
PhaseO
•Upstroke of the action potential
•Mediated by opening of L-type (primarily) Ca2+ channels
•Note the time scale: the slope ofphase 0 is not steep in nodal tissue like it is in ventricular myocytes or the upstroke of the action potential in nerves. This is part of the reason conduction velocity is slow in the AV node.
Phase3
•Repolarization phase
•Mediated by voltage-gated K+ channels
CONTROL OF NODAL EXCITABILITY
Catecholamines
>
.s 0
Cii
-20
Q)
a..0 -40 Cii -60
u
·;::
t5 -80
Q)
iii
Figure 11-3-3. Sympathetic Effects on SA Nodal Cells
MEDICAL 41
Section II • Excitable Tissue
Bridge to Pharmacology
Class II antiarrhythmics are the beta blockers, while class IV antiarrhythmics are the Ca2+ channel blocks. These drugs reduce automaticity and conduction through the AV node
and can be very efficacious in tachyarrhythmias.
•Norepinephrine (NE) from postganglionic sympathetic nerve terminals and circulating epinephrine (Epi)
•-1 receptors; Gs--cAMP; stimulates opening of HCN and Ca2+ channels
•Increased slope of pacemaker potential (gets to threshold sooner)
•Functional effect
-Positive chronotropy (SA node): increased HR
-Positive dromotropy (AV node): increased conduction velocity through the AV node
Parasympathetic
> 0 -S
(ii -20 E
(])
0 -40 a..
(ii(..) -60
·;::
t5 -80
(])
w
Figure 11-3-4. Parasympathetic Effects on SA Nodal Cells
•Ach released from post-ganglionic fibers.
•M2 receptor; Gi-Go; Opens K+ channels and inhibits cAMP
•Hyperpolarizes; reduced slope of pacemaker potential
•Functional effect
-Negative chronotropy (SA node): Decreased HR
-Negative dromotropy (AV node): Decreased conduction velocity through the AV node
42 MEDICAL


Chapter 3 • ElectricalActivity of the Heart
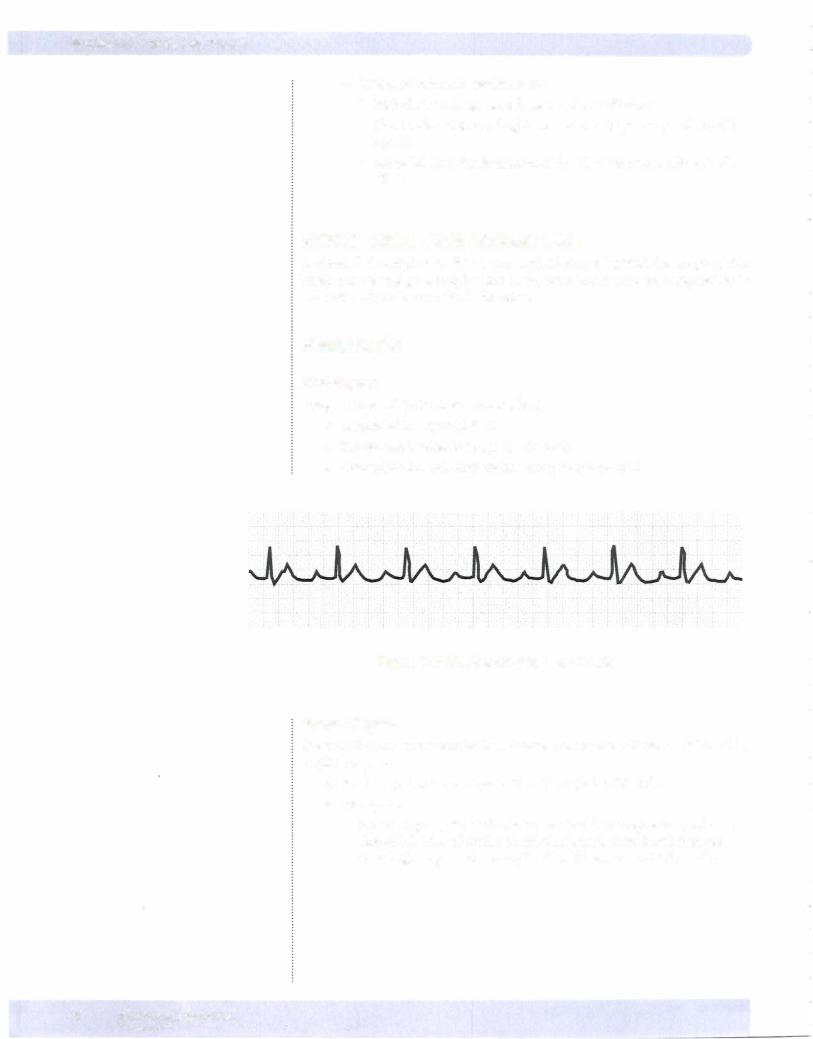
Figure II-3-7 shows a normal ECG trace from a single lead. The ECG measures volts (Y-axis) per unit time (X-axis) and the scales are standardized. Note the heavier (darker) lines both horizontally and vertically. These represent "big" box es, each ofwhich is further subdivided into 5 "small" boxes.
•Y-axis (volts): one big box= 0.5 mV
-Because there are 7 big boxes above the bottom line in Figure II-3-7, the total height is 3.5 mV.
•X-axis (time): one big box= 0.2 sec (200 msec)
-Because there are 5 subdivisions within each big box, each small box is 0.04 sec (40 msec). As noted in Figure II-3-7, 5 big boxes equal one second.
Reading an ECG
The ECG is a powerful clinical tool and it takes years oftraining to become fully competent in detecting the many abnormalities it can detect. Thus, a detailed ex planation is beyond the scope ofthis book. However, there are some arrhythmias and alterations that one should be able to recognize early in one's medical train ing. The following represents a step-wise approach that should allow the student to detect these alterations in the ECG.
Step 1: rate and rhythm
If provided, use the rhythm strip (lead II) that typically runs the length of the recording and is located on the bottom ofthe printout.We will use a single trace illustrated in Figure II-3-7.
•Rhythm: Qualitatively look at the trace and determine ifthere is a steady rhythm. This means the R waves occur regularly, i.e., the space between each is approximately the same. Ifso then there is a steady rhythm; ifnot then an unsteady rhythm.
•Rate: It is typically not necessary to determine the exact heart rate (HR); rather, simply determine if it is within the normal range (60-100 beats/min). The simplest way to do this is to find an R wave that is on a heavy (darker) vertical line, and note where the next R wave occurs with respect to the following count ofsubsequent heavy vertical lines (Illustrated in Figure II-3-7):
1 = 300 beats/min
2= 150
3= 100
4= 75
5 = 60
6 = 50
For example, ifthe subsequent R wave occurs at the second heavy line from the first R wave, then HR is 150 beats/min. Ifit occurs at the third heavy line from the first R wave, then HR is 100 beats/min, and so on. In Figure II-3-7, it occurs at the fourth heavy line, thus HR is 75 beats/ min for this ECG.
MEDICAL 45

Section II • Excitable Tissue
If the subsequent R wave occurs between heavy lines, then the HR is between the values denoted for those lines. Even though it won't be a precise number, one can ascertain whether it is above or below the nor mal range.
Step 2: Waves
•Qualitatively examine the trace for the presence of P, QRS, and T. Can they be seen and do they look somewhat "normal"?
Step 3: PR interval
•Find the PR interval and determine if it is in the normal range (120200 msecs). This normal range translates into 3-5 small boxes.
•Look at several cycles to see if the PR interval is consistent.
Step 4: Estimate themean electrical axis (MEA)
• The MEA indicates the net direction (vector) of current flow during ventricular depolarization.
• Each lead can be represented by an angle, as is illu trated in Figure 11-3-8. Although the MEA axis can be determined very precisely, it is not important to do so at this stage. Instead, we will simply define what quadrant (quadrant method) the MEA falls in using a very simplified approach.
-90°
+aVF +90°
Figure 11-3-8. Axis Ranges
46 MEDICAL

Chapter 3 • ElectricalActivityof the Heart
Quadrant method
|
lead-aVF |
|
|
|
lead-aVF |
|
lead-I |
1 |
lead +I+ |
lead - I------- |
-1 --- |
------1 |
lead +I |
|
|
|
|
|
||
|
normal |
|
|
|
|
|
|
lead +aVF |
|
|
|
lead +aVF |
|
|
lead-aVF |
|
|
|
lead-aVF |
|
lead-I |
|
lead +I |
lead - I |
|
|
|
|
lead +aVF |
|
|
|
lead +aVF |
|
|
Voltages: |
|
|
|
Voltages: |
|
|
lead +I |
|
|
|
lead-I |
|
|
lead-aVF |
|
|
|
lead +aVF |
|
|
left axis deviation |
|
|
|
right axis deviation |
|
Figure 11-3-9. Quadrant Method
•Determine the net QRS deflection (upward minus downward) in lead I and aVF. Using these 2 leads allows us to partition the mathematical grid into 4 basic quadrants (upper left panel of Figure II-3-9).
•If the net deflections for leads I and aVF are positive, then the MEA is between 0° and 90°, and is thus normal (upper right panel of Figure Il-3-9). Note: The normal range for MEA is -30° and +ll0°. Even though the quadrant method is not precise, it is close enough at this juncture.
•If the net deflection is positive in lead I and negative in aVF, then the
MEA is between 0° and -90°, and there is a left axis deviation (lower left panel of Figure Il-3-9).
Causes of left axis deviation are:
0Left heart enlargement, either left ventricular hypertrophy or dilation
°Conduction defects in the left ventricle, except in the posterior bundle branch
0Acute MI on right side tends to shift axis left unless right ventricle dilates
•If the net deflection is negative in lead I and positive in aVF, then the MEA is between 90° and 180°, and there is a right axis deviation (lower right panel of Figure Il-3-9).
Voltages: lead +I lead +aVF normal axis
MEDICAL 47
Section II • Excitable Tissue
- Causes ofright axis deviation are:
°0 Right heart enlargement, hypertrophy, or dilation
Conduction defects of right ventricle or the posterior left bundle branch
0Acute MI on left side tends to shift axis right unless left ventricle dilates
ARRHYTHMIAS/ECG ALTERATIONS
A detailed description of the various arrhythmias is beyond the scope of this book, but we willgo through some of the ones that should be recognizable to students early in their medical education.
Heart Blocks
First-Degree
Long PR interval (>200 msec; one big box)
•Illustrated in Figure Il-3-10
•Slowed conduction through the AV node
•Characteristics: rate and rhythm are typically normal
Figure 11-3-1 0. First-Degree Heart Block
Second-Degree
Every QRS complex is preceded by a P wave, but not every P wave is followed by a QRS complex.
•Some impulses are not transmitted through the AV node.
•Two types:
-Mobitz type I (Wenckebach; Figure 11-3-11): Progressive prolonga
tion of PR interval until a ventricular beat is missed and then the cycle begins again. This arrhythmia willhave an unsteady rhythm.
48 MEDICAL

Chapter 3 • ElectricalActivityofthe Heart
Figure 11-3-11 . First-Degree Heart Block
-Mobitz type II (Figure 11-3-12): The PR interval is consistent, i.e., it doesn't lengthen and this separates it from Wenckebach. The rhythm can be steady or unsteady depending upon block ratio (P to QRS ratio: 2:1, 3: 1, 3:2, etc.).
Figure 11-3-1 2. Second-Degree AV Nodal Block
Third-Degree (Complete)
Complete dissociation of P waves and QRS complexes (Figure Il-3-13)
•Impulses are not transmitted through the AV node.
•Characteristics: steady rhythm (usually) and very slow ventricular HR (usually); no consistent PR interval because impulses are not transmitted through the AV node; rate for P waves is different than rate for R waves
Figure 11-3-1 3. Complete Heart Block
MEDICAL 49

Section II • Excitable Tissue
Atrial Flutter
Very fast atrial rate
•Although fast, atrial conduction is still intact and coordinated.
•Characteristics: "saw-tooth"appearance ofwaves between QRS complexes; no discernible T waves; rhythm typically steady
Figure 11-3-1 4. Atrial Flutter
Atrial Fibrillation
Uncoordinated atrial conduction
•Lack ofa coordinated conduction results in no atrial contraction
•Characteristics: unsteady rhythm (usually) and no discernible P waves
Figure 11-3-15. Atrial Fibrillation
Wolff-Parkinson-White Syndrome
Accessory pathway (Bundle ofKent) between atria and ventricles
•Characteristics: short PR interval; steadyrhythmand normal rate (usually); slurred upstroke ofthe R wave (delta wave); widened QRS complex
•The cardiac impulse can travel in retrograde fashion to the atria over the accessory pathway and initiate a reentrant tachycardia.
Figure 11-3-1 6
50 MEDICAL

Chapter 3 • ElectricalActivity ofthe Heart
Other Factors Changingthe ECG
STsegment changes
•Elevated: Transmural infarct or Prinzmetal angina (coronary vasospasm)
•Depressed: Subendocardial ischemia or exertional (stable) angina
Postassium
•Hyperkalemia: Increases rate of repolarization, resulting in sharp-spiked T waves and a shortened QT interval.
•Hypokalemia: Decreases rate of repolarization, resulting in U waves and a prolonged QT interval.
Calcium
•Hypercalcemia: Increases the QT interval
•Hypocalcemia: Decreases the QT interval
MEDICAL 51
Section II • Excitable Tissue
Chapter Summary
•Different parts ofthe heart have cardiac tissue that is specialized for automaticity, conduction, and contraction.
•Myocytes and Purkinje cells have fast Na+ channels, while nodal cells (SA and AV) lack these channels. Thus, the upstroke of the action potential (phase 0) is much faster in myocytes and Purkinje cells.
•There are 5 phases for cardiac action potentials from myocytes and Purkinje cells, but only 3 phases for nodal cells.
•The plateau phase (phase 2) is due to influx of calcium through L-type channels and potassium efflux via voltage-gated channels.
•Repolarization is due to open potassium channels.
•Nodal cells in the heart are characterized by an unstable phase 4 (resting membrane potential) that is primarily mediated by calcium and the sodium "funny" current.
•In SA nodal cells, sympathetics ( -1) increase the slope ofthe pacemaker
potential and thusthe intrinsic rate, whereas parasympathetics (M2) hyperpolarize and decrease the intrinsic rate.
•The mean electrical axis ofthe heart is about 60°. It tends to move toward hypertrophied tissue and away from infarcted tissue.
•First-degree heart block is a slowed conduction through the AV node, second degree heart block is the lack oftransmission of some impulses through the AV node, and third-degree heart block is a total block at the AV node.
•There are 2 types of second-degree block: Wenckebach (Mobitz type I) and Mobitz type II.
•Atrial flutter is characterized by a steady rhythm and a "saw tooth" wave appearance between QRS complexes
•Atrial fibrillation is characterized by an unsteady rhythm and lack of discernible P waves.
•Wolff-Parkinson-White syndrome is characterized by an accessory pathway between the atria and ventricles. This shortens the PR interval and may produce a reentrant tachycardia.
52 MEDICAL

SECTION
Skeletal Muscle


Chapter 1 • Excitation-Contraction Coupling
Proteins ofthe thin filaments
•Actin is the structural protein of the thin filament. It possesses attach ment sites for myosin.
•Tropomyosin blocks myosin binding sites on actin.
•Troponin is composed of 3 subunits: troponin-T (binds to tropomyo sin), troponin-1 (inhibits myosin binding to actin), and troponin-C (binds to calcium).
Under resting conditions, no calcium is bound to the troponin, pre venting actin and myosin from interacting.
When calcium binds to troponin-C, the troponin-tropomyosin com plex moves, exposing actin's binding site for myosin. (Figure III-1-3 B)
Proteins ofthe thickfilaments
Myosin has ATPase activity. The splitting of ATP puts myosin in a "high energy" state; it also increases myosin's affinity for actin.
• Once myosin binds to actin, the chemical energy is transferred to mechanical energy, causing myosin to pull the actin filament. This gen erates active tension in the muscle and is commonly referred to as "the power stroke."
• If the force generated by the power stroke is sufficient to move the load (see next chapter), then the muscle shortens (isotonic contraction).
• If the force generated is not sufficient to move the load (see next chapter), then the muscle doesn't shorten (isometric contraction).
MEDICAL 57


Chapter 1 • Excitation-Contraction Coupling
•Cross-bridge cycling (contraction) continues until either of the following occurs:
-Withdrawal of Ca2+: cycling stops at position 1 (normal resting muscle)
-ATP is depleted: cycling stops at position 3 (rigor mortis; this would not occur under physiologic conditions)
REGULATION OF CYTOSOLIC CALCIUM
The sarcoplasmic reticulum (SR) has a high concentration of Ca2+. Thus, there is a strong electrochemical gradient for Ca2+ to diffuse from the SR into the cytosol. There are 2 key receptors involved in the flux of Ca2+ from the SR into the cytosol: dihydropyridine (DHP) and ryanodine (RyR).
Dihydropyridine (DHP)
•DHP is a voltage-gated ea2+ channel located in the sarcolemmal membrane
•Although it is a voltage-gated Ca2+ channel, Ca2+ does not flux through this receptor in skeletal muscle. Rather, DHP functions as a voltage-sensor.
•When skeletal muscle is at rest, DHP blocks RyR (Figure III-1-Sa).
Ryanodine Receptor (RyR)
•RyR is a calcium channel on the SR membrane.
•When the muscle is in the resting state, RyR is blocked by DHP
(Fig III-1-Sa). Thus, Ca2+ is prevented from diffusing into the cytosol.
T-tubule |
|
T-tubule |
Action |
|
Sarcolemma |
potential |
Sarcolemma |
||
Cytosol |
|
|
|
|
|
|
|
||
|
|
|
|
|
|
Ca2+ |
|||
|
|
|
|
|
|
|
2 |
+ |
|
|
|
|
|
2 |
+ |
Ca |
|||
|
|
|
|
|
|
|
|
||
|
|
|
|
|
|
|
|
||
|
|
|
|
Ca |
2 |
+ |
|
|
|
|
|
2 |
+ |
|
|
Ca |
|
|
|
A. Resting skeletal muscle |
|
Ca |
|
|
|
|
|
|
|
B. Action potential in sarcolemma |
|
|
|
||||||
Figure 111-1 -5. Regulation of Ca2+ Release by Sarcoplasmic Reticulum |
|
|
|
||||||
MEDICAL 59

Section Ill • Skeletal Muscle
Sequence
1 . Skeletal muscle action potential is initiated at the neuromuscular junc tion (see section II, chapter 2).
2. The action potential travels down the T-tubule.
3. The voltage change causes a conformation shift in DHP (voltage sensor), removing its block of RyR (Figure III- 1-Sb).
4. Removal of the DHP block allows Ca2+ to diffuse into the cytosol (fol lows its concentration gradient) .
5.The rise in cytosolic Ca2+ opens more RyR channels (calcium-induced calcium release).
6.Ca2+ binds to troponin-C, which in turn initiates cross-bridge cycle, creating active tension.
7.Ca2+ is pumped back into the SR by a calcium ATPase on the SR mem brane called sarcoplasmic endoplasmic reticulum calcium ATPase (SERCA).
8.The fall in cytosolic Ca2+ causes tropomyosin to once again cover actin's binding site for myosin and the muscle relaxes, provided of course ATP is available to dissociate actin and myosin.
Key Points
•Contraction-relaxation states are determined by cytosolic levels of Ca2+.
•The source of the calcium that binds to the troponin-C in skeletal mus cle is solely from the cell's sarcoplasmic reticulum. Thus, no extracellular Ca2+ is involved.
•Two ATPases are involved in contraction:
-SERCA pumps Ca2+ back into the SR to terminate the contraction, i.e., causes relaxation.
ALTERING FORCE IN SKELETAL MUSCLE
Mechanical Response to a Single Action Potential
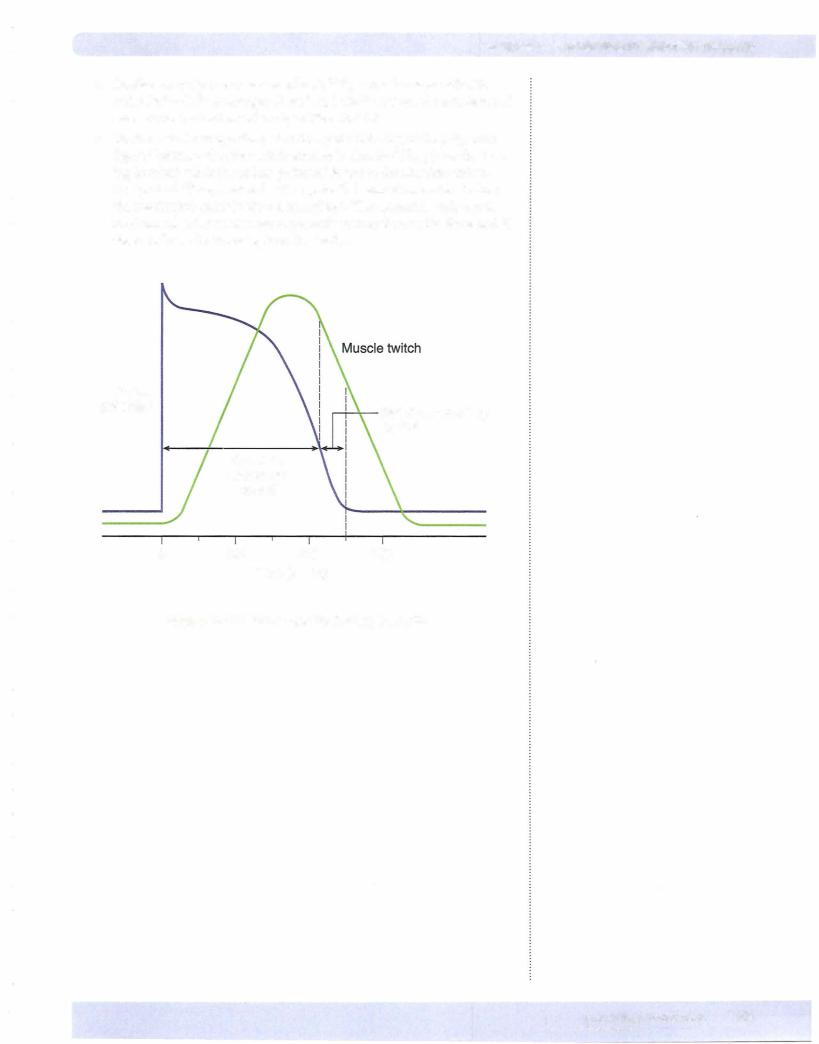
Figure III-1-6 illustrates the mechanical contraction of skeletal muscle and the action potential on the same time scale.
60 M EDICAL

Chapter 1 • Excitation-Contraction CoupUng
Active Force
Intracellular
Free Calcium
Membrane
Potential Time (msec)
Figure 111-1-6. The Time Course of Events During Contraction
•Note the sequence of events: action potential causes Ca2+ release.
•Release of Ca2+ evokes muscle contraction (twitch).
•Note that the muscle membrane has completely repolarized well before the start of force development.
Summation and Recruitment
Under normal circumstances, enough Ca2+ is released by a single muscle action potential to completely saturate all the troponin-C binding sites. This means all available cross-bridges are activated and thus force cannot be enhanced by increasing cytosolic Ca2+. Instead, peak force in skeletal muscle is increased in 2 ways: summation and recruitment.
Summation
•Because the membrane has repolarized well before force development, multiple action potentials can be generated prior to force development.
•Each action potential causes a pulse of Ca2+ release.
•Each pulse of Ca2+ initiates cross-bridge cycling and because the muscle has not relaxed, the mechanical force adds onto (summates) the force from the previous action potential (Figure IIl- 1-7) .
•This summation can continue until the muscle tetanizes in which case there is sufficient free Ca2+ so that cross-bridge cycling is continuous.
Recruitment
•A single alpha motor neuron innervates multiple muscle fibers. The alpha motor neuron and all the fibers it innervates is called a motor-unit.
•Recruitment means activating more motor units, which in turn engage more muscle fibers, causing greater force production.
MEDICAL 61

Section Ill • Skeletal Muscle
Chapter Summary
•Actin is the structural protein ofthe thin filaments. The regulatory proteins are tropomyosin and troponin, the latter binding calcium. These proteins determine the availability of myosin binding sites on the thin filaments.
•In resting skeletal muscle, DHP prevents SR Ca2+ release by blocking RyR,
which is a Ca2+ channel on the SR membrane. An action potential removes this block of RyR, allowing Ca2+ to flow into the cytosol, which in turn, initiates contraction and the development of active force.
•All Ca2+ for skeletal muscle contraction comes from the SR, while the rise in cytosolic Ca2+ comes from both the extracellular space and the SR in cardiac muscle.
•The hydrolysis ofATP bythe myosin ATPase provides the energy forthe mechanical aspects of contraction. ATP also serves to dissociate actin and myosin.
•Sustained saturation ofthe skeletal muscle cell with free calcium causes tetanus, which is simplythe continuous cycling of all available cross-bridges. Cardiac muscle cannot be tetanized due to the long duration of its absolute refractory period.
64 M EDICAL