

The Elisa guidebook
.pdf12.1.11¡ª Timing of Steps
Generally, individual steps should be timed accurately; thus, for a 1-h incubation step, no more than 5 min either way should be tolerated. For assays that recommend specific times, there is no reason that they cannot be met. Timing is less important when plates are rotated, although it is good practice to follow protocols accurately.
12.1.12¡ª Incubation
We have already considered stationary vs rotated plates. The conclusion is that rotation of plates for incubation steps is highly recommended to eliminate vicosity effects; time differences; and temperature effects, including edge-well differences caused when plates are stacked and incubated stationary. However, when a rotator is not available, provided that standardization of methods is used, stationary plate assays are not a problem. The following tips are helpful when incubating plates that are not rotated:
1.Avoid stacking the plates; keep them separated.
2.Incubate at 37¡ãC.
3.Always use the same procedure for addition of reagents; that is, do not tap one plate, pick another up three times, or examine one or two plates during the incubation and not others. Using different procedures mixes the reagents over the solid phase to different degrees, thereby altering the interaction in the wells. Thus, take more care with handling the plates identically in one test and from day to day.
4.If incubation has to be done at room temperature make a note of the temperature, and its variation during the year. This may explain variation in results at different times.
Table 6
Problems and Solutions in ELISA
Problem
No/very little color even after 30-min incubation with substrate/chromophore
1.No hydrogen peroxide added.
2.Hydrogen peroxide stock inactivated.
3.Added blocking buffer in adsorption step for antigen.
4.Wrong dilution of hydrogen peroxide.
Color all over plate
1.Too strong conjugate.
2.Conjugate reacts with something other than target species
3.Serum factors in heated sera.
Patchy color
1.Poor and variable coating of plates with reagents.
2.Bubbles in multichannel pipet tips.
3.Poor pipeting technique.
4.Plates faulty or non-ELISA plates.
5.Incubated plates in stacks.
6.Poor mixing of reagents including test sample.
7.Dilution series poorly done.
8.Poor washing.
Color develops very quickly
Page 78
Solution
Check.
Retitrate.
Check.
Check.
Check dilution.
Check with suitable controls.
Do not heat sera routinely.
Check coating buffer and homogeneity of preparation.
Avoid overvigorous pipeting and detergents.
Practice more care.
Contact manufacturer; try alternative plates.
Keep plates separated during stationary incubation
Ensure mixing on sampling.
Practice pipeting; examine pipets for wear; recalibrate pipets.
Avoid detergents in wash solution; ensure no air bubbles are trapped in wells.

1. |
Conjugate too strong. |
Retitrate. |
2. |
One reagent at too high concentation. |
Check dilutions. |
(table continued on next page)
Page 79
(table continued from previous page)
Problem |
Solution |
|
Color develops too slowly |
|
|
1. |
Conjugate too weak. |
Check dilutions used; retitrate. |
2. |
Contamination inhibits enzyme activity |
Avoid wrong preservatives |
(e.g., sodium azide for peroxidase). |
|
|
3. |
Low temperature of incubation. |
Make sure temperature of substrate is correct |
4. pH of substrate incorrect. |
Check. |
|
Totally unexpected results |
|
|
1. |
Plate format incorrect. |
Check. |
2. |
Dilution series made incorrectly. |
Check. |
3. |
Gross error in test protocol. |
Check. |
4. |
Visual estimation of color does not match ELISA |
Check for contaminated/damaged filter; inappropriate filter |
reader results. |
(wrong wavelength) |
|
High background color |
|
|
1. |
Nonspecific attachment of antibodies. |
Check for unsuitable blocking conditions or omission of blocking buffer. |
2. |
Antispecies conjugate reacts whether any reagent |
Set up controls to assess with reagent on plate nonspecifically to any |
|
|
binds other in test. |
Page 80
12.1.13¡ª Conjugates
Care must be taken with conjugates because since they are the signal suppliers of the whole assay.
1.Make sure you understand what the conjugate is (species made, specific antibody activity, and so forth).
2.Store at recommended temperatures.
3.Never store diluted conjugate for use at a later time.
4.Always make up the working dilution of conjugate just before you need it.
5.Always use clean tips, preferably previously unused, to dispense conjugates.
6.If the recommended dilution or titrated dilution of conjugate is very high (e.g., 1/10,000), add I µL to 10 mL to make 10 mL at working strength. You may have difficulty in making small volumes of working strength. Thus, a small dilution should be made to allow feasible pipetting of the conjugate without waste. Dilute in 50% glycerol/50% PBS to, say, 1/10 of the original. Store at ¨C20¡ãC if possible.
7.Never leave conjugates on the bench for an excessive time.
8.Preferably add sterile glycerol (equal volume) for conjugates stored at ¨C20¡ãC.

12.1.14¡ª
Addition of Stopping Solution
Because the multichannel spectrophotometer reads through a thickness of liquid, any change in the volume in a well will result in an alteration of OD reading for the same colored solution. Thus, it is important to add stopping solution accurately to achieve the same volume in each well and limit the effect of volume changes (This, of course, is also true of addition of conjugate solution and concerns the blotting of plates to eliminate residual washing solution, all of which affect the final volume per well.)
12.1.15¡ª
Addition of Samples
An accurate and consistent pipetting technique is a prerequisite for limiting pipetting error. Major problems are caused by the following factors:
1.Failure to put sample into the buffer in the well, leaving it on the side of the plate (particularly when plates are incubated stationary).
2.Frothing on addition of samples.
3.Lack of concentration when adding a large number of samples, causing missed wells and duplication of samples in the same well.
4.Poorly maintained pipets and tips.
5.Improperly thawing out sera (protein tends to collect at the bottom of the tubes on freezing) so that adequate mixing to ensure homogeneity is essential.
12.1.16¡ª
Reading Plates/Data
The advantage of ELISA is that the plates can be read quickly and a large amount of data can be generated that can lead to several problems:
Page 81
1.Computerization whereby the plate data are processed and the results given (e.g., ¡À56%) must be checked quickly from examination of plate data by eye. This is essential since some programs do not give warnings to check highly suspect results probably caused by a major sampling error. Thus, mean values may be calculated from the plate data by the computer and use these to ascribe positive or negative for particular samples. Unless safety features to screen for extremely different OD values in a pair are included in the program, false results are obtained (e.g., two values for a serum are 0.40 and 0.42, mean = 0.41 = positive; two values for a serum are 0.02 and 0.74, mean = 0.41 ?). Personal examination of initial plate data would easily spot this serum result as nonsense, whereas the sole reference to the computer printout of positive/negative would not. This is a facile example, but more complex analytical programs have similar hidden problems.
2.Large databases set up to store data from large-scale screening. This is related to the checking factor in which results read directly into a database are taken as reliable without examination by eye of the feasibility of those results. Researchers often wish to have results from several laboratories, and therefore programs have been supplied to facilitate this need. Such programs can easily dehumanize the diagnostic process by controlling results and denying the ability to backcheck data.
3.Cables that connect computers to spectrophotometers and printers that do not work. These are general hardware problems that must be conquered.
12.2¡ª
Troubleshooting ELISA
Table 6 (see pp. 78 and 79) presents some of the problems commonly seen in ELISA development and practice and highlights areas that should be examined first when assays are proving difficult.
References
1.Cantarero, L. A., Butler, J. E., and Osborne, J. W. (1980) The binding characteristics of proteins for polystyrene and their significance in solid-phase immunoassays. Analyt. Biochem. 105, 375¨C382.
2.Kurstak, E., Tijssen, P., Kurstak, C., and Morisset, R. (1986) Enzyme immunoassay in diagnostic medical virology. Bull. W. H. O. 64(3), 465¨C479.

3.Geerligs, H. G., Weijer, W. J., Bloemhoff, W., Welling, G. W. and Welling-Wester, S. (1988) The influence of pH and ionic strength on the coating of peptides of herpes simplex virus type I in an enzyme-linked immunosorbent assay. J. Immunol. Methods 106, 239¨C244.
4.Rembaum, A., Margel, S., and Levy, A. (1978) J. Immunol. Methods 24, 239.
5.Gabrilovac, J., Pachmann, K., Rodt, H., Gager, G. and Thierfelder, S. (1979) Particle-labelled antibodies I. Anti-Tcell antibodies attached to plastic beads by poly-1-lysine. J. Immunol. Methods 30, 161¨C170.
6.Kohno, T., Hashida, S., and Ishikawa, E. (1985) A more sensitive enzyme immunoassay of anti-insulin IgG in guinea pig serum with less non-specific binding of normal guinea pig serum. J. Biochem. 98, 379¨C384.
Page 82
7.Meegan, J. M., Yedloutscnig, R. J., Peleg, B. A., Shy, J., Peters, C. J., Walker, J. S., and Shope, R. E. (1987) Enzyme-linked immunosorbent assay for detection of antibodies to Rift Valley Fever Virus in ovine and bovine sera. Am. J. Vet. Res. 48, 1138¨C1141.
8.Husby, S., Holmskov-Neilsen, U., Jensenius, J. C., and Erb, K. (1982) Increased non-specific binding of heat treated proteins to plastic surfaces analyzed by ELISA and HPLC-fractionation. J. Immunoassay 6, 95¨C110.
9.Herrmann, J. E., Hendry, R. M., and Collins, M. F. (1979) Factors involved in enzyme-linked immunassay and evaluation of the method of identification of enteroviruses. J. Clin. Microbiol. 10, 210¨C217.
10.Harmon, M. W., Russo, L. L., and Wilson, S. Z. (1983) Sensitive enzyme immunoassay with b-D-galactosidase-Fab conjugate for detection of type A influenza virus antigen in clinical specimens. J. Clin. Microbiol. 17, 305¨C311.
11.Kenna, J. G., Major, G. N., and Williams, R. S. (1985) Methods for reducing non-specific antibody binding in enzyme-linked immunosorbent assays. J. Immunol. Methods 85, 409¨C419.
12.Robertson, P. W., Whybin, L. R., and Cox, J. (1985) Reduction in non-specific binding in enzyme imunoassays using casein hydrolysate in serum diluents. J. Immunol. Methods 76, 195¨C197.
13.Gary, W. G. J. R., Kaplan, E. J., Stine, E. S., and Anderson, J. L. (1985) Detection of Norwalk Virus antibodies and antigen with a biotin/avidin system. J. Clin. Microbiol. 22, 274¨C278.
14.Hatfield, R. M., Morris, B. A., and Henry, A. (1987) Development of and enzyme-linked immunosorbent assay for the detection of humoral antibodies. Avian Pathol. 16, 123¨C140.
15.Dietzen, R. G. and Francki, R. I. B. (1987) Nonspecific binding of immunoglobulins to coat proteins of certain plant viruses in immunoblots and indirect ELISA. J. Virol. Methods 15, 159¨C164.
16.York, J. J. and Fahey, K. J. (1988) Diagnosis of Infectious Laryn gotracheitis using a monoclonal antibody ELISA. Avian Pathol. 17, 173¨C182.
17.Vogt, R. F., Phillips, D. L., Henderson, L. O., Whitfield, W., and Spierto, F. W. (1987) Quantitative differences among various proteins as blocking agents for ELISA microtiter plates. J. Immunol. Methods 101, 43¨C50.
18.Boscato, L. M. and Stuart, M. C. (1988) Heterophilic antibodies: a problem for all immunoassays. Clin. Chem. 33, 27¨C33.
19.Dise, T. and Brunell, A. P. (1987) Anti-bovine antibody in human sera as a cause of nonspecificity in enzyme immunoassay. J. Clin. Microbiol. 25, 987¨C990.
20.Deshpand, S. S. Enzyme Immunoassays from Concept to Product Development. (1996) Chapman & Hall International Thomson Publishing, New York.
21.Ngo, T. T. (1991) Immunoassay. Curr. Opin. Biotechnol. 2, 102¨C109.
22.Ishikawa, E., Imagawa, M., Hashide, S., Yoshatake, S., Hagushi, Y., and Ueno, E. (1983) Enzyme labelling of antibodies and their fragments for enzyme immunoassays and immunological staining. J. Immunoassay 4, 209.
Page 83
4¡ª
Titration of Reagents
This chapter examines in more detail the necessary practical skills needed to facilitate the development and sustainability of ELISAs. Basic methodologies to set up all systems are discussed so that the reader can both investigate the possibilities of tests using his or her reagents and use with confidence reagents obtained from other sources. As with all other tests, it is vital that scientists realize the principles of the methods to allow good judgement based on quantifiable and controllable features. In other words, there should be a full understanding of what is being performed in the laboratory. The intention of this training is to produce new skills and understanding as well as to encourage critical assessment. Such a mentality is necessary and supported through the application of statistical criteria to results and to continuous monitoring of performance.
1¡ª
Chessboard or Checkerboard Titrations
The many ELISA systems described previously all require that the reagents used be optimized. In other words, the working concentration of each component of the test must be assessed. Table 1 gives a simplified overview of the systems, indicating the number of reagents needed to be optimized, as a reminder.
A key feature in helping this process is through the use of chessboard or checkerboard titrations (CBTs). The use of microtiter plates is an important feature of ELISAs. This chapter describes this type of format. CBTs can be accomplished in any format in which reagents can be diluted, but the microtiter plate, with its associated equipment for ease of pipetting, is ideal. It will become clear that CBT is not the only method for optimizing reagents, and that often concentrations must be adjusted with reference to actual test conditions.
The process of CBT involves the dilution of two reagents against each other to examine the activities inherent at all the resulting combinations. The maximum number of reagents that can be titrated on a plate is two, and this is illustrated in the direct ELISA (see Subheading 1.1.). The use of CBT in some

Page 84
Table 1
Basic ELISA System Components Requiring Titration
|
|
Number |
ELISA |
Reagents involved |
titrated |
Direct |
Antigen; antibody conjugated to enzyme |
2 |
Indirect |
Antigen; antibody; antispecies conjugate |
3 |
Direct sandwich |
Capture antibody; antigen; conjugated second antibody |
3 |
Indirect sandwich |
Capture antibody; antigen; second antibody; |
4 |
|
antispecies conjugate against second antibody |
|
other systems with more than two reagents is also illustrated. The descriptions of pipetting and diluting techniques are also fundamental to the performance of ELISAs in general. As the reader becomes familiar with the methods, fewer details will be necessary to describe the tests.
1.1¡ª
Direct ELISA CBT
Figure 1 shows diagrammatically the dilution scheme. The upper part of Fig. 1 illustrates the typical numbering and lettering associated with microtiter plates. Thus, columns are labeled 1¨C12 and rows are labeled A¨CH. This nomenclature is used henceforth to identify locations on the plates.
1.1.1¡ª
Stage (i) of Direct ELISA CBT
Stage (i) involves diluting the antigen in a coating buffer. The volumes usually used in ELISA are 50 or 100 µL. In this chapter, we use 50 µL as the standard volume added to wells. A twofold dilution range is usual at this stage, e.g., one volume taken from one well and added to the same volume in the next well, and so on.
The most practical way of performing the test is as follows:
1.Add the diluent (in this stage the coating buffer) in 50-µL vol to all wells of the plate using a multichannel pipet.
2.Add 50 µL of a dilution of the antigen to all wells in column 1.
a.The initial dilution can be made in a small bottle to result in a volume necessary for addition to column 1; that is, you will need eight wells ¡Á 50 µL = 400 µL of antigen dilution. It is advisable to make slightly more of the initially diluted antigen than is theoretically needed to allow for material adhering to bottles, and so forth; in this case, 500 µL (0.5 mL) should be made.
b.Assessment of the initial dilution is based on any knowledge of the likely antigen concentration (e.g., as assessed from other tests). With the CBT there is going to be a direct assessment of activity in the ELISA at a range of concentrations, and, therefore, if there is a gross under-or overestimate of antigen, another CBT can be made accounting for such problems. The likely

Page 85

Fig. 1.
Plate layout and CBT of antigen against conjugated antibody for direct ELISA.
purity of the antigen (concentration of specific antigens as compared to contaminants) and the availability of antigen must be considered. A useful starting dilution for all antigens might be 1/10¨C20 in coating buffer. Let us assume that we add 1/20.
Page 86
3.Add 50 µL of the prediluted antigen to all wells in column A. Mix with a multichannel pipet fitted with eight tips. The mixing implies that the liquid in the well is pipeted up and down in the tip at least five times. This should not be done too vigorously.
4.After the final mixing, take 50 µL of the diluted antigen from the eight wells in column A and transfer to column B. Mix as before. Repeat the procedure until column 11. Note that this means there is no antigen in column 12, and this will serve as one control (development of color with conjugate dilutions on wells containing no antigen).
5.After the final mixing action in column 11, take out 50 µL and discard. In the wells we have created a twofold dilution series of antigen in coating buffer, beginning at 1/20 in column A and ending at 1/20,480 in column 11.
6.Incubate the plate to allow time for the adsorption of antigen to the wells. The nature and time of the incubation should be the same as that used in the test proper. Most antigens will attach with incubation under stationary conditions at 37¡ãC in 2 h. However, it may be more convenient to allow overnight incubation at 4¡ãC. Whatever conditions are applied, they must be followed in the subsequent development of the test since alteration in times, temperatures, or regimes of shaking or tapping plates will alter the kinetics of adsorption.
7.Now wash the plate by flooding and emptying the wells with phosphate-buffered saline (PBS), as described in Chapter 3.
1.1.2¡ª
Stage (ii) of Direct ELISA CBT
Stage (ii) involves making a similar dilution range of the conjugated antibody made against the antigen. In this case the dilution range is made from row A to G. The added buffer is blocking buffer (containing a relatively high concentration of inert protein to prevent nonspecific binding of proteins (see Chapter 3). In this case, the blocking buffer might be PBS (0.1 M, pH 7.6) containing skimmed milk powder (5%) and 0.05% Tween-20.
The dilution range is made using the multichannel pipet with 12 tips, directly in the wells. Again, there must be mixing between each addition. Note that there is no dilution of conjugate into row H, this acts as a control for only substrate and antigen (since the wells contain a dilution range of antigen). The initial dilution should be in the region of 1/50 for a direct conjugate.
1. Incubate the plate under rotation (best) at 37¡ãC for 1 h or stationary at 37¡ãC for 2 h. Wash the wells.
2.Add chromophore/substrate. This could be any of the ones described in Chapter 3 added with due care as to accuracy and checks on the pHs of the buffers involved. In this example, we shall assume we add H2O2/ortho-phenylenediamine (OPD) at 50 µL/well (in every well of the plate).
3.Leave the plate stationary for 15 min to allow color to develop. The exact timing of color development and conditions should be adhered to in subsequent assays. At this stage, it is good practice to observe the plate for the rate of color development.
Page 87
4.Stop (depending on system).
5.Read the OD of color in a spectrophotometer.
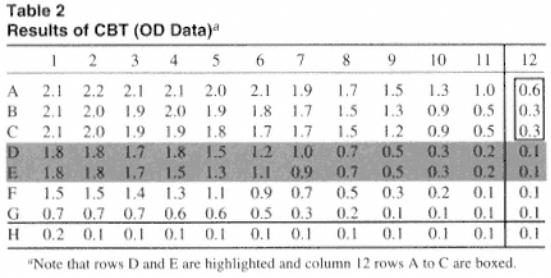
1.2¡ª Results
Table 2 presents stylized results that might be obtained. We are attempting to assess the optimal dilutions of antigen to coat the wells and the interaction of the conjugate. Figure 2 shows the data plotted.
1.2.1¡ª
Analysis of Data
Each of the columns contains a constant but different dilution of antigen. Differences in color between the columns, where there is a constant addition of labeled antibody, reflects the effect of altering the concentration of antigen. The rows can be assessed for a maximum color in which there is a range of values that are similar. This can be regarded as a plateau and reflects areas where the antibody is in excess. In this area, where there is no decrease in color on dilution of the antigen, a maximum saturating level of antigen is coated to the plates. Thus, we can identify regions of excess antigen/antibody. Taking row A:
|
1 |
2 |
3 |
4 |
5 |
6 |
7 |
8 |
9 |
10 |
11 |
12 |
|
|
|
|
|
|
|
|
|
|
|
|
|
A |
2.1 |
2.2 |
2.1 |
2.1 |
2.0 |
2.1 |
1.9 |
1.7 |
1.5 |
1.3 |
1.0 |
0.6 |
|
|
|
|
|
|
|
|
|
|
|
|
|

The shaded values are similar, giving a plateau maximum value of about 2.0 OD units. There is no effect on color where antigen is coated at 1/20, 1/40, 1/80, 1/160, 1/320, or 1/640 (wells 1¨C6). This indicates that in the presence of a constant dilution of antibody, there is a similar amount of antigen coating the wells to a dilution of 1/640. Following further dilution, there is a decrease in OD values on dilution of the antigen.
Page 88
Fig. 2.
Plots of OD values obtained relating different antigen concentrations to different dilutions of labeled antibody. Row 12 received no antigen. A¨CG indicate rows containing different dilutions of labeled antibody.
Row H did not receive labeled antibody.
Note that rows B and C give similar results showing a plateau from rows 1¨C6. Figure 2 shows graphically that the curves are similar, although there are slight reductions on dilution of the conjugate. Again, this indicates that antigen is in excess, certainly at the dilution added to column 5. Thus, increasing the concentration of antigen above that contained in dilution at 1/320 only wastes antigen.
|
1 |
2 |
3 |
4 |
5 |
6 |
7 |
8 |
9 |
10 |
11 |
12 |
A |
2.1 |
2.2 |
2.1 |
2.1 |
2.0 |
2.1 |
1.9 |
1.7 |
1.5 |
1.3 |
1.0 |
0.6 |
B |
2.1 |
2.0 |
1.9 |
2.0 |
1.9 |
1.8 |
1.7 |
1.5 |
1.3 |
0.9 |
0.5 |
0.3 |
C |
2.1 |
2.0 |
1.9 |
1.9 |
1.8 |
1.7 |
1.7 |
1.5 |
1.2 |
0.9 |
0.5 |
0.3 |