

8.2 Sales Forecast
One of our targets is focus on the new channels to increase net sales beyond 870 thousand Euro by the second year of operations. Our marketing strategy is maintained relationships with the customer based the excellent service because we believe service is top spear of the sales itself. Based on the market research undertaken, strategies developed and existing customer relationships, the following sales forecasts were developed (in units and Euro) (see Table 12, Figure 15):
|
|
Year 1 |
Year 2 |
Year 3 |
Year 4 |
Year 5 |
|
Sales in units |
|
|
|
|
|
|
Hourly Rate Consulting (hours) |
7.400 |
11.000 |
13.000 |
16.000 |
19.000 |
|
Project Consulting (projects) |
10 |
15 |
18 |
22 |
22 |
|
Sales in Euro |
|
|
|
|
|
|
Hourly Rate Consulting |
370.000 |
550.000 |
780.000 |
960.000 |
1.140.000 |
|
Project Consulting |
500.000 |
750.000 |
1.080.000 |
1.320.000 |
1.980.000 |
|
Total Sales (Euro) |
870.000 |
1.300.000 |
1.860.000 |
2.280.000 |
3.120.000 |
Table 12. Sales Forecast
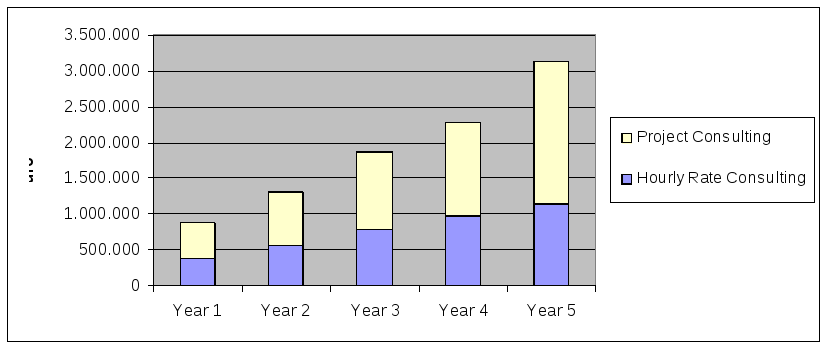
Figure 15. Sales forecast
8.3 Organization Structure Chart
The Organizational structure charts (see Table 13) appearing below show how the organization's staffing needs change over the five years.
|
Year 1 |
Year 5 |
|
Board |
Board |
|
CEO |
CEO |
|
Admin Staff 1 |
Admin Staff 1 |
|
Finance Staff 1 |
Finance Staff 1 |
|
Marketing Staff 1 |
Marketing Staff 1 |
|
Sales Staff 1 |
Sales Staff 3 |
|
Consultant Staff 10 |
Consultant Staff 26 |
Table 13. Organizational structure chart
8.4 Projected financial statements
The financial forecast (projection) (see Figures 16, 17, 18) of Marktune shows that it will make profit by the beginning of the third year and will accumulate sufficient retained earnings.
|
REVENUE |
Year 1 |
Year 2 |
Year 3 |
Year 4 |
Year 5 |
|
Unit Sales |
|
|
|
|
|
|
Hourly Rate Consulting |
7.400 |
11.000 |
13.000 |
16.000 |
19.000 |
|
Project Consulting |
10 |
15 |
18 |
22 |
22 |
|
Total Unit Sales |
|
|
|
|
|
|
|
|
|
|
|
|
|
Unit Prices |
|
|
|
|
|
|
Hourly Rate Consulting |
50 |
50 |
60 |
60 |
60 |
|
Project Consulting |
50.000 |
50.000 |
60.000 |
60.000 |
90.000 |
|
|
|
|
|
|
|
|
Sales |
|
|
|
|
|
|
Hourly Rate Consulting |
370.000 |
550.000 |
780.000 |
960.000 |
1.140.000 |
|
Project Consulting |
500.000 |
750.000 |
1.080.000 |
1.320.000 |
1.980.000 |
|
Total Sales |
870.000 |
1.300.000 |
1.860.000 |
2.280.000 |
3.120.000 |
|
|
|
|
|
|
|
|
Sales returns and allowances |
87.000 |
130.000 |
186.000 |
228.000 |
312.000 |
|
Net Sales |
783.000 |
1.170.000 |
1.674.000 |
2.052.000 |
2.808.000 |
|
OPERATING EXPENSES |
|
|
|
|
|
|
Payroll |
504.000 |
720.000 |
966.000 |
1.176.000 |
1.344.000 |
|
Marketing/Promotion |
120.000 |
160.000 |
200.000 |
250.000 |
300.000 |
|
Sales |
30.000 |
35.000 |
40.000 |
50.000 |
60.000 |
|
Depreciation |
0 |
0 |
0 |
0 |
0 |
|
Rent |
100.000 |
130.000 |
150.000 |
180.000 |
200.000 |
|
Utilities |
30.000 |
32.500 |
35.000 |
40.000 |
50.000 |
|
Bank interest |
7.500 |
7.500 |
|
|
|
|
Furniture & equipment |
40.000 |
50.000 |
50.000 |
60.000 |
70.000 |
|
Other |
30.000 |
35.000 |
40.000 |
50.000 |
60.000 |
|
Total Operating Expenses |
861.500 |
1.170.000 |
1.481.000 |
1.806.000 |
2.084.000 |
|
|
|
|
|
|
|
|
Net Income Before Taxes |
-78.500 |
0 |
193.000 |
246.000 |
724.000 |
|
Taxes on income (20 %) |
|
0 |
38.600 |
49.200 |
144.800 |
|
|
|
|
|
|
|
|
NET INCOME (LOSS) |
-78.500 |
0 |
154.400 |
196.800 |
579.200 |
Figure 16. Projected Profit and Loss
Marktune will reach break-even within the second quarter of the third year and all five years will have a positive cash flow.
|
Period ending |
Year 1 |
Year 2 |
Year 3 |
Year 4 |
Year 5 |
|
Net income (loss) |
-78.500 |
0 |
154.400 |
196.800 |
579.200 |
|
Operating activities, cash flows provided by or used in: |
|
|
|
|
|
|
Depreciation and amortization |
0 |
0 |
0 |
0 |
0 |
|
Adjustments to net income |
0 |
0 |
0 |
0 |
0 |
|
Decrease (increase) in accounts receivable |
-30.000 |
-5.000 |
-5.000 |
-5.000 |
-5.000 |
|
Increase (decrease) in liabilities (A/P, taxes payable) |
10.000 |
10.000 |
10.000 |
10.000 |
10.000 |
|
Decrease (increase) in inventories |
0 |
0 |
0 |
0 |
0 |
|
Increase (decrease) in other operating activities |
0 |
0 |
0 |
0 |
0 |
|
Net cash flow from operating activities |
-98.500 |
5.000 |
159.400 |
201.800 |
584.200 |
|
Investing activities, cash flows provided by or used in: |
|
|
|
|
|
|
Capital expenditures |
0 |
0 |
0 |
0 |
0 |
|
Investments from the owners |
100.000 |
0 |
0 |
0 |
0 |
|
Other cash flows from investing activities |
0 |
0 |
0 |
0 |
0 |
|
Net cash flows from investing activities |
100.000 |
0 |
0 |
0 |
0 |
|
Financing activities, cash flows provided by or used in: |
|
|
|
|
|
|
Dividends paid |
0 |
0 |
0 |
0 |
0 |
|
Sale (repurchase) of stock |
0 |
0 |
0 |
0 |
0 |
|
Increase (decrease) in debt |
50.000 |
0 |
-50.000 |
0 |
0 |
|
Other cash flows from financing activities |
0 |
0 |
0 |
0 |
0 |
|
Net cash flows from financing activities |
50000 |
0 |
-50000 |
0 |
0 |
|
Net increase (decrease) in cash and cash equivalents |
51.500 |
5.000 |
109.400 |
201.800 |
584.200 |
|
Beginning cash |
0 |
51.500 |
56.500 |
165.900 |
367.700 |
|
Ending cash |
51.500 |
56.500 |
165.900 |
367.700 |
951.900 |
Figure 17. Projected Cash Flow
|
ASSETS |
Year 1 |
Year 2 |
Year 3 |
Year 4 |
Year 5 |
|
Current Assets |
|
|
|
|
|
|
Cash & cash equivalents |
51.500 |
56.500 |
165.900 |
367.700 |
951.900 |
|
Net accounts receivable |
30.000 |
35.000 |
40.000 |
45.000 |
50.000 |
|
Inventory |
0 |
0 |
0 |
0 |
0 |
|
Prepaid expenses |
0 |
0 |
0 |
0 |
0 |
|
Total Current Assets |
81.500 |
91.500 |
205.900 |
412.700 |
1.001.900 |
|
Fixed Assets |
|
|
|
|
|
|
Property, office and equipment |
40.000 |
50.000 |
50.000 |
60.000 |
70.000 |
|
Less : Accumulated Depreciation |
40.000 |
50.000 |
50.000 |
60.000 |
70.000 |
|
Other intangible fixed assets |
0 |
0 |
0 |
0 |
0 |
|
Total Net Fixed Assets |
0 |
0 |
0 |
0 |
0 |
|
TOTAL ASSETS |
81.500 |
91.500 |
205.900 |
412.700 |
1.001.900 |
|
|
|
|
|
|
|
|
LIABILITIES |
|
|
|
|
|
|
Current Liabilities |
|
|
|
|
|
|
Accounts payable |
10.000 |
20.000 |
30.000 |
40.000 |
50.000 |
|
Accruals & other payables |
0 |
0 |
0 |
0 |
0 |
|
Total Current Liabilities |
10.000 |
20.000 |
30.000 |
40.000 |
50.000 |
|
Long-term Liabilities |
|
|
|
|
|
|
Bank Loans |
50.000 |
50.000 |
0 |
0 |
0 |
|
Other long-term liabilities |
0 |
0 |
0 |
0 |
0 |
|
Total Long-term Liabilities |
50.000 |
50.000 |
0 |
0 |
0 |
|
SHAREHOLDERS' EQUITY |
|
|
|
|
|
|
Capital stock |
|
|
|
|
|
|
Existing shareholders (51%) |
51.000 |
51.000 |
51.000 |
51.000 |
51.000 |
|
New shareholders (49%) |
49.000 |
49.000 |
49.000 |
49.000 |
49.000 |
|
Retained earnings |
-78.500 |
-78.500 |
75.900 |
272.700 |
851.900 |
|
Total Shareholders' Equity |
21.500 |
21.500 |
175.900 |
372.700 |
951.900 |
|
TOTAL LIABILITIES & EQUITY |
81.500 |
91.500 |
205.900 |
412.700 |
1.001.900 |
Figure 18. Projected Balance Sheet
The company intends to borrow 50 000 Euro from a bank in the first year of operations and pays loan back in the third year.