

J.P. Morgan - Guide to the Markets_watermark
.pdfvk.com/id446425943
Investing |
principles |
|
|
|
Annual returns and intra-year declines |
|
|
|
|
|
|
|
|
|
GTM – Europe |
| 91 |
|||||||||||||
|
|
|
|
|
|
|
|
|
|
|
|
|
|
|
|||||||||||
MSCI Europe Index intra-year declines vs. calendar-year returns |
|
|
|
|
|
|
|
|
|
|
|
|
|
||||||||||||
Despite average intra-year drops of 15,4% (median 12,1%), annual returns are positive in 30 of 39 years |
|
|
|
|
|
|
|
|
|
|
|
||||||||||||||
% |
|
|
|
39 |
|
|
|
|
|
|
|
|
|
|
|
|
|
|
|
|
Calendar-year return |
||||
|
|
|
|
|
|
|
|
|
|
|
|
|
|
|
|
|
|
||||||||
40 |
|
|
34 |
|
|
|
|
34 |
35 |
|
|
|
|
|
|
|
|
|
|
Intra-year decline |
|||||
|
|
|
|
|
|
|
|
|
|
|
|
|
|
|
|
|
|||||||||
|
|
|
|
|
|
|
|
|
|
|
|
|
|
|
|
|
|
|
|
|
|
|
|||
|
|
|
|
|
|
|
|
|
|
|
|
|
|
|
|
|
|
|
|
|
|
|
|
||
30 |
|
|
|
|
|
28 |
|
|
|
|
|
28 |
|
|
|
|
|
|
|
|
|
|
|
YTD |
|
|
|
|
|
|
|
|
|
|
|
|
|
|
|
|
|
|
23 |
|
|
|
|
|
|
||
|
|
|
|
21 |
22 |
|
|
|
|
|
|
|
|
22 |
|
|
|
|
|
|
|
|
|
|
|
|
|
|
|
|
|
|
|
20 |
20 |
|
|
|
|
|
|
|
|
|
|
|
|
|
|||
20 |
|
|
|
|
|
|
|
|
|
|
|
|
|
|
|
|
|
18 |
|
|
|
|
|||
|
15 |
16 |
|
|
|
|
|
|
|
|
|
|
17 |
16 |
|
|
|
|
|
|
|
|
|||
|
|
|
|
|
|
|
|
|
|
|
|
|
|
|
|
|
|
|
|
13 |
|
||||
|
13 |
|
|
|
|
13 |
|
12 |
|
|
|
|
|
|
|
|
|
|
|
|
|
|
|
||
|
|
|
|
|
|
|
|
|
|
|
|
|
|
|
12 |
|
|
10 |
|
||||||
|
|
|
|
|
|
|
|
|
|
|
|
|
|
9 |
|
|
|
|
|
|
|
||||
10 |
|
|
|
|
|
|
|
|
|
|
|
|
|
|
|
|
|
|
|
|
|
|
|||
|
|
|
|
|
|
|
6 |
|
|
|
|
|
|
|
|
4 |
|
|
|
|
4 |
|
|
||
|
|
2 |
|
|
|
|
|
|
|
|
|
|
|
|
|
3 |
|
|
2 |
|
|
||||
|
|
|
|
|
|
|
|
|
|
|
|
|
|
|
|
|
|
|
2 |
|
|
|
|||
0 |
|
|
|
|
|
|
|
|
|
|
|
|
|
|
|
|
|
|
|
|
|
|
|
|
|
|
|
-4 |
-3 |
|
|
|
|
-4 |
-5 |
|
-4 |
|
|
|
|
|
|
|
|
|
-4 |
-5 |
|
||
|
|
|
|
|
|
|
|
|
|
|
|
|
|
|
|
|
|
||||||||
-10 |
|
-7 |
|
-6 |
|
|
|
|
|
|
-6 |
|
|
|
|
|
|
|
|
||||||
|
|
|
|
|
|
-6 |
|
|
|
|
|
|
|
|
|
|
|
|
|
||||||
|
|
|
-11 |
-10 |
|
-11 |
|
|
-8 |
|
|
-9 |
|
-8 |
|
|
|
|
|
|
|
|
|
|
|
|
|
|
|
-11 |
|
|
|
|
|
|
|
-12 |
|
-12 |
|
-12 -12 |
|
|
-13 |
|
|||||
|
|
|
|
|
|
-12 |
|
-12 |
|
|
-12 |
|
|
|
|
|
|||||||||
|
|
-15 |
|
|
|
|
|
|
|
|
|
|
|
-17 -15 |
|
||||||||||
-20 |
|
|
-18 |
|
|
|
|
-16 |
|
|
-18 |
|
|
|
|
-15 |
-15 |
|
|
|
|
||||
|
|
|
|
|
-19 |
-18 |
|
|
|
|
|
|
|
|
-18 |
|
|||||||||
|
|
|
|
|
|
|
|
|
|
|
|
|
|
|
|
|
|
|
|
|
|||||
|
|
|
|
|
|
|
-24 |
|
|
|
|
|
|
-22 |
|
|
|
|
|
|
|
|
|
|
|
-30 |
|
|
|
|
|
|
|
|
|
|
|
|
|
|
|
-26 |
-25 |
|
|
|
|
|
|
|
|
|
|
|
|
|
|
|
|
|
|
|
|
|
|
|
|
|
|
|
|
|
|
|
|||
|
|
|
|
|
|
|
|
|
|
|
-31 |
|
-31 |
|
|
|
|
|
|
|
|
|
|
|
|
|
|
|
|
|
|
|
|
|
|
|
|
|
|
|
|
|
|
|
|
|
|
|
|
|
|
-40 |
|
|
|
-35 |
|
|
|
|
|
|
|
-35 |
-37 |
|
|
|
|
|
|
|
|
|
|
|
|
|
|
|
|
|
|
|
|
|
|
|
|
|
|
|
|
|
|
|
|
|
|
|
|||
|
|
|
|
|
|
|
|
|
|
|
|
|
|
|
|
-41 |
|
|
|
|
|
|
|
|
|
-50 |
|
|
|
|
|
|
|
|
|
|
|
|
|
|
|
-48 |
|
|
|
|
|
|
|
|
|
|
|
|
|
|
|
|
|
|
|
|
|
|
|
|
|
|
|
|
|
|
|
|
|
||
'80 |
'82 |
'84 |
'86 |
'88 |
|
'90 |
'92 |
'94 |
'96 |
'98 |
'00 |
'02 |
'04 |
'06 |
'08 |
'10 |
'12 |
'14 |
'16 |
'18 |
|
||||
|
|
|
|
|
|
|
|
|
|
|
|
|
|
|
|
|
|
|
|
|
|
|
|
|
|
Source: MSCI, Refinitiv Datastream, J.P Morgan Asset Management. Returns are based on local price only and do not include dividends. Intra-year decline refers to the largest market fall from peak to trough within a short time period during the calendar year. Returns shown are calendar years from 1980 to 2018. YTD is year to date. Past performance is not a reliable indicator of current and future results. Guide to the Markets - Europe. Data as of 30 June 2019.
91
vk.com/id446425943
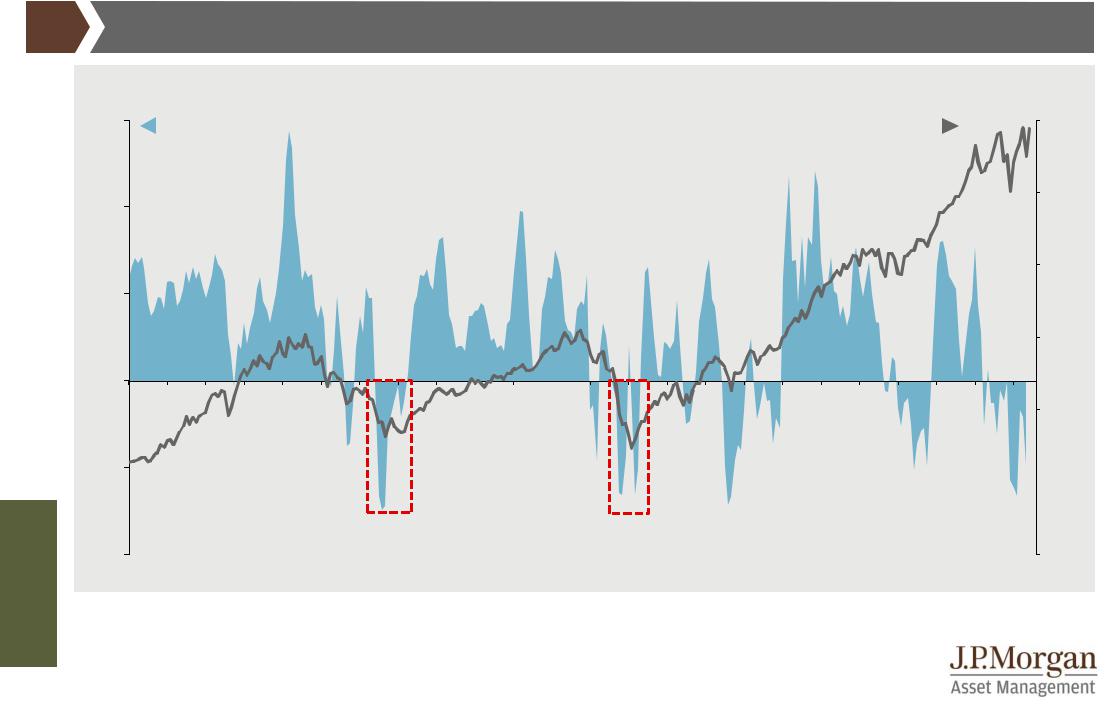
Market timing is difficult |
GTM – Europe | 92 |
US mutual fund and ETF flows and S&P 500 index
|
USD billions, three-month net flow (LHS); index level (RHS) |
|
|
|
|
|
|
|
|
|
|
|
|
|
|
|
||||||||
|
150 |
3-month net fund flows |
|
|
|
|
|
|
|
|
|
|
|
|
S&P 500 index level |
|
3.000 |
|||||||
|
|
|
|
|
|
|
|
|
|
|
|
|
|
|
|
|||||||||
|
100 |
|
|
|
|
|
|
|
|
|
|
|
|
|
|
|
|
|
|
|
|
|
|
2.500 |
|
|
|
|
|
|
|
|
|
|
|
|
|
|
|
|
|
|
|
|
|
|
|
|
|
|
|
|
|
|
|
|
|
|
|
|
|
|
|
|
|
|
|
|
|
|
|
|
|
2.000 |
|
50 |
|
|
|
|
|
|
|
|
|
|
|
|
|
|
|
|
|
|
|
|
|
|
|
|
|
|
|
|
|
|
|
|
|
|
|
|
|
|
|
|
|
|
|
|
|
|
|
1.500 |
|
0 |
|
|
|
|
|
|
|
|
|
|
|
|
|
|
|
|
|
|
|
|
|
|
|
|
|
|
|
|
|
|
|
|
|
|
|
|
|
|
|
|
|
|
|
|
|
|
|
1.000 |
|
-50 |
|
|
|
|
|
|
|
|
|
|
|
|
|
|
|
|
|
|
|
|
|
|
500 |
|
|
|
|
|
|
|
|
|
|
|
|
|
|
|
|
|
|
|
|
|
|
|
|
|
|
|
|
|
|
|
|
|
|
Avoid selling at the bottom |
|
|
|
|
|
|
|
|
|
|
|
||||
Investing principles |
-100 |
|
|
|
|
|
|
|
|
|
|
|
|
|
|
|
|
|
|
|
|
|
|
0 |
'96 |
'97 |
'98 |
'99 |
'00 |
'01 |
'02 |
'03 |
'04 |
'05 |
'06 |
'07 |
'08 |
'09 |
'10 |
'11 |
'12 |
'13 |
'14 |
'15 |
'16 |
'17 |
'18 |
'19 |
|
Source: FactSet, Investment Company Institute, J.P. Morgan Asset Management. Fund flows are US long-term equity fund flows with ETF flows included from 2006 |
|
|
|
|||||||||||||||||||||
onwards. Past performance is not a reliable indicator of current and future results. Guide to the Markets - Europe. Data as of 30 June 2019. |
|
|
|
|
|
|
||||||||||||||||||
92 |
|
|
|
|
|
|
|
|
|
|
|
|
|
|
|
|
|
|
|
|
|
|
|
|
vk.com/id446425943
Investing |
principles |
|
|
US asset returns by holding period |
|
GTM – Europe | 93 |
|
Range of equity and bond total returns |
|
|
|
%, annualised total returns, 1950-present |
|
|
|
75 |
|
|
Large cap equity |
|
|
|
|
|
|
|
Bonds |
|
|
|
|
61% |
|
|
50/50 portfolio |
|
|
||
50 |
49% |
|
|
48% |
|
|
|
25 |
|
30% |
|
|
|
|
|
|
|
|
|
|
|
|
|
24% |
24% |
|
|
|
|
|
|
|
|
|
|
|
|
|
|
|
|
|
|
|
|
|
|
||
|
|
|
|
21% |
|
|
|
|
|
|
|
||
|
|
|
|
|
|
|
|
|
|
|
|
|
|
|
|
|
|
|
|
|
|
|
18% |
|
|
|
|
|
|
|
|
|
|
|
|
17% |
|
|
|
|
|
|
|
|
|
|
|
|
17% |
|
|
|
|||
|
|
|
|
|
|
|
|
|
15% |
|
|||
|
|
|
|
|
|
|
|
|
|
|
13% |
|
|
|
|
|
|
|
|
|
|
|
|
4% |
4% |
|
|
|
|
|
|
|
|
|
|
1% |
|
1% |
|
||
0 |
|
|
|
|
|
|
|
|
|
|
|
||
|
|
|
|
|
-3% |
0% |
|
|
|
|
|
|
|
|
|
-1% |
|
|
|
|
|
|
|
||||
|
|
-7% |
-3% |
|
|
|
|
|
|
|
|||
|
|
|
|
|
|
|
|
|
|
-18%
-24%
-25
|
-43% |
|
|
|
-50 |
1-yr rolling |
5-yr rolling |
10-yr rolling |
20-yr rolling |
|
|
|
|
Source: Strategas/Ibbotson, J.P. Morgan Asset Management. Large cap equity represents the S&P 500 Composite and Bonds represents the Strategas/Ibbotson US Government Bond Index and US Long-term Corporate Bond Index. Returns shown are per annum and are calculated based on monthly returns from 1950 to latest available and include dividends. Past performance is not a reliable indicator of current and future results. Guide to the Markets - Europe. Data as of 30 June 2019.
93

vk.com/id446425943
Investing |
principles |
|
|
94
Asset class returns (EUR) |
|
|
|
|
|
|
|
|
|
|
|
|
|
|
|
GTM – Europe |
| 94 |
|||||||||||
|
|
|
|
|
|
|
|
|
|
|
|
|
|
|
|
|
|
|
|
|
|
|
|
|
|
Ann. |
|
|
2008 |
2009 |
2010 |
2011 |
2012 |
2013 |
2014 |
2015 |
2016 |
2017 |
2018 |
|
YTD |
|
2Q19 |
|
return |
|
Vol. |
||||||||||
|
|
|
since ’08 |
|
||||||||||||||||||||||||
|
|
|
|
|
|
|
|
|
|
|
|
|
|
|
|
|
|
|
|
|
|
|
|
|
|
|
|
|
Govt bonds |
|
EME |
|
REITS |
|
EMD |
|
REITS |
|
DM Equities |
|
REITS |
|
REITS |
|
HY bonds |
|
EME |
|
Govt bonds |
|
REITS |
|
DM Equities |
|
HY bonds |
|
EME |
15,9% |
|
73,5% |
|
36,4% |
|
12,1% |
|
18,3% |
|
21,9% |
|
44,8% |
|
13,9% |
|
17,7% |
|
21,0% |
|
4,6% |
|
19,2% |
|
2,7% |
|
9,3% |
|
29,6% |
|
|
|
|
|
|
|
|
|
|
|
|
|
|
|
|
|
|
|
|
|
|
|
|
|
|
|
|
|
|
|
|
|
|
|
|
|
|
|
|
|
|
|
|
|
|
|
|
|
|
|
|
|
|
|
|
|
|
Cash |
|
HY bonds |
|
EME |
|
REITS |
|
HY bonds |
|
Portfolio |
|
EMD |
|
EMD |
|
Cmdty |
|
DM Equities |
|
IG bonds |
|
DM Equities |
|
IG bonds |
|
REITS |
|
REITS |
5,7% |
|
54,4% |
|
27,5% |
|
10,9% |
|
17,8% |
|
3,3% |
|
20,2% |
|
12,8% |
|
15,1% |
|
8,1% |
|
1,3% |
|
17,8% |
|
2,5% |
|
9,0% |
|
20,3% |
|
|
|
|
|
|
|
|
|
|
|
|
|
|
|
|
|
|
|
|
|
|
|
|
|
|
|
|
|
|
|
|
|
|
|
|
|
|
|
|
|
|
|
|
|
|
|
|
|
|
|
|
|
|
|
|
|
|
IG bonds |
|
DM Equities |
|
Cm dty |
|
Govt bonds |
|
EME |
|
HY bonds |
|
DM Equities |
|
DM Equities |
|
EME |
|
Portfolio |
|
HY bonds |
|
Portfolio |
|
EMD |
|
EMD |
|
HY bonds |
-3,9% |
|
26,7% |
|
24,9% |
|
9,9% |
|
16,8% |
|
2,7% |
|
20,1% |
|
11,0% |
|
14,9% |
|
1,7% |
|
0,8% |
|
11,2% |
|
2,3% |
|
8,3% |
|
18,3% |
|
|
|
|
|
|
|
|
|
|
|
|
|
|
|
|
|
|
|
|
|
|
|
|
|
|
|
|
|
|
|
|
|
|
|
|
|
|
|
|
|
|
|
|
|
|
|
|
|
|
|
|
|
|
|
|
|
|
EMD |
|
Portfolio |
|
HY bonds |
|
IG bonds |
|
EMD |
|
Hedge Funds |
|
IG bonds |
|
HY bonds |
|
EMD |
|
Cash |
|
REITS |
|
EME |
|
Govt bonds |
|
DM Equities |
|
DM Equities |
-6,3% |
|
25,4% |
|
22,8% |
|
7,8% |
|
16,7% |
|
2,1% |
|
17,5% |
|
8,4% |
|
13,5% |
|
-0,3% |
|
0,7% |
|
11,2% |
|
1,9% |
|
6,7% |
|
17,0% |
|
|
|
|
|
|
|
|
|
|
|
|
|
|
|
|
|
|
|
|
|
|
|
|
|
|
|
|
|
|
|
|
|
|
|
|
|
|
|
|
|
|
|
|
|
|
|
|
|
|
|
|
|
|
|
|
|
|
Hedge Funds |
|
EMD |
|
DM Equities |
|
HY bonds |
|
DM Equities |
|
Cash |
|
Portfolio |
|
Govt bonds |
|
REITS |
|
HY bonds |
|
EMD |
|
EMD |
|
HY bonds |
|
IG bonds |
|
Cm dty |
-19,3% |
|
24,2% |
|
20,1% |
|
6,6% |
|
14,7% |
|
0,2% |
|
16,2% |
|
7,7% |
|
12,6% |
|
-3,0% |
|
0,2% |
|
11,0% |
|
1,5% |
|
5,9% |
|
15,7% |
|
|
|
|
|
|
|
|
|
|
|
|
|
|
|
|
|
|
|
|
|
|
|
|
|
|
|
|
|
|
|
|
|
|
|
|
|
|
|
|
|
|
|
|
|
|
|
|
|
|
|
|
|
|
|
|
|
|
Portfolio |
|
REITS |
|
EMD |
|
Cash |
|
Portfolio |
|
REITS |
|
HY bonds |
|
IG bonds |
|
DM Equities |
|
EMD |
|
Cash |
|
HY bonds |
|
Portfolio |
|
Portfolio |
|
Portfolio |
-20,9% |
|
23,5% |
|
19,8% |
|
1,7% |
|
10,7% |
|
-1,3% |
|
13,9% |
|
7,4% |
|
11,4% |
|
-4,0% |
|
-0,3% |
|
9,9% |
|
1,5% |
|
5,8% |
|
11,7% |
|
|
|
|
|
|
|
|
|
|
|
|
|
|
|
|
|
|
|
|
|
|
|
|
|
|
|
|
|
|
|
|
|
|
|
|
|
|
|
|
|
|
|
|
|
|
|
|
|
|
|
|
|
|
|
|
|
|
HY bonds |
|
IG bonds |
|
Portfolio |
|
Portfolio |
|
IG bonds |
|
IG bonds |
|
Hedge Funds |
|
Hedge Funds |
|
Portfolio |
|
REITS |
|
Portfolio |
|
IG bonds |
|
REITS |
|
Govt bonds |
|
EMD |
-23,1% |
|
15,5% |
|
18,9% |
|
1,2% |
|
9,5% |
|
-4,0% |
|
13,2% |
|
7,3% |
|
10,3% |
|
-4,0% |
|
-1,6% |
|
8,7% |
|
0,3% |
|
4,7% |
|
11,4% |
|
|
|
|
|
|
|
|
|
|
|
|
|
|
|
|
|
|
|
|
|
|
|
|
|
|
|
|
|
|
|
|
|
|
|
|
|
|
|
|
|
|
|
|
|
|
|
|
|
|
|
|
|
|
|
|
|
|
Cm dty |
|
Cmdty |
|
Govt bonds |
|
DM Equities |
|
Hedge Funds |
|
EME |
|
Govt bonds |
|
Portfolio |
|
IG bonds |
|
IG bonds |
|
Hedge Funds |
|
Cm dty |
|
Hedge Funds |
|
EME |
|
Hedge Funds |
-32,3% |
|
15,2% |
|
13,3% |
|
-1,8% |
|
1,9% |
|
-6,5% |
|
13,0% |
|
6,4% |
|
7,4% |
|
-4,2% |
|
-2,0% |
|
5,5% |
|
0,0% |
|
2,7% |
|
9,3% |
|
|
|
|
|
|
|
|
|
|
|
|
|
|
|
|
|
|
|
|
|
|
|
|
|
|
|
|
|
|
|
|
|
|
|
|
|
|
|
|
|
|
|
|
|
|
|
|
|
|
|
|
|
|
|
|
|
|
REITS |
|
Hedge Funds |
|
IG bonds |
|
Hedge Funds |
|
Cash |
|
Govt bonds |
|
EME |
|
Cash |
|
Hedge Funds |
|
Govt bonds |
|
DM Equities |
|
Govt bonds |
|
Cash |
|
Hedge Funds |
|
Govt bonds |
-34,1% |
|
9,9% |
|
13,2% |
|
-5,8% |
|
1,2% |
|
-8,4% |
|
11,8% |
|
0,1% |
|
5,6% |
|
-5,8% |
|
-3,6% |
|
5,5% |
|
-0,1% |
|
1,2% |
|
7,6% |
|
|
|
|
|
|
|
|
|
|
|
|
|
|
|
|
|
|
|
|
|
|
|
|
|
|
|
|
|
|
|
|
|
|
|
|
|
|
|
|
|
|
|
|
|
|
|
|
|
|
|
|
|
|
|
|
|
|
DM Equities |
|
Cash |
|
Hedge Funds |
|
Cmdty |
|
Govt bonds |
|
EMD |
|
Cash |
|
EME |
|
Govt bonds |
|
Hedge Funds |
|
Cmdty |
|
Hedge Funds |
|
EME |
|
Cash |
|
IG bonds |
-37,2% |
|
2,3% |
|
12,5% |
|
-10,4% |
|
0,3% |
|
-10,6% |
|
0,3% |
|
-4,9% |
|
4,7% |
|
-6,9% |
|
-6,8% |
|
4,5% |
|
-0,7% |
|
1,1% |
|
7,5% |
|
|
|
|
|
|
|
|
|
|
|
|
|
|
|
|
|
|
|
|
|
|
|
|
|
|
|
|
|
|
|
|
|
|
|
|
|
|
|
|
|
|
|
|
|
|
|
|
|
|
|
|
|
|
|
|
|
|
EME |
|
Govt bonds |
|
Cash |
|
EME |
|
Cmdty |
|
Cm dty |
|
Cmdty |
|
Cm dty |
|
Cash |
|
Cm dty |
|
EME |
|
Cash |
|
Cmdty |
|
Cm dty |
|
Cash |
-50,8% |
|
-0,6% |
|
1,1% |
|
-15,4% |
|
-2,6% |
|
-13,4% |
|
-5,5% |
|
-16,1% |
|
-0,1% |
|
-10,7% |
|
-9,9% |
|
-0,1% |
|
-2,6% |
|
-5,1% |
|
1,7% |
|
|
|
|
|
|
|
|
|
|
|
|
|
|
|
|
|
|
|
|
|
|
|
|
|
|
|
|
|
Source: Barclays, Bloomberg, FTSE, J.P. Morgan Economic Research, MSCI, Refinitiv Datastream, J.P. Morgan Asset Management. Annualised return covers the period from 2008 to 2018. Vol. is the standard deviation of annual returns. Govt bonds: Bloomberg Barclays Global Aggregate Government Treasuries; HY bonds: Bloomberg Barclays Global High Yield; EMD: J.P. Morgan EMBI Global; IG bonds: Bloomberg Barclays Global Aggregate – Corporates; Cmdty: Bloomberg Commodity; REITS: FTSE NAREIT All REITS; DM Equities: MSCI World; EME: MSCI EM; Hedge funds: HFRI Global Hedge Fund Index; Cash: JP Morgan Cash Index EUR (3M). Hypothetical portfolio (for illustrative purposes only and should not be taken as a recommendation): 30% DM equities; 10% EM equities; 15% IG bonds; 12,5% government bonds; 7,5% HY bonds; 5% EMD; 5% commodities; 5% cash; 5% REITS and 5% hedge funds. All returns are total return, in EUR, and are unhedged. Past performance is not a reliable indicator of current and future results. Guide to the Markets - Europe. Data as of 30 June 2019.

vk.com/id446425943
J.P. Morgan Asset Management: Index definitions
All indexes are unmanaged and an individual cannot invest directly in an index. Index returns do not include fees or expenses.
The S&P 500 Index is widely regarded as the best single gauge of the U.S. equities market. This world-renowned index includes a representative sample of 500 leading companies in leading industries of the U.S. economy. Although the S&P 500 Index focuses on the large-cap segment of the market, with approximately 75% coverage of U.S. equities, it is also an ideal proxy for the total market. An investor cannot invest directly in an index.
The S&P 400 Mid Cap Index is representative of 400 stocks in the mid-range sector of the domestic stock market, representing all major industries.
The Russell 3000 Index® measures the performance of the 3,000 largest U.S. companies based on total market capitalization.
The Russell 1000 Index ® measures the performance of the 1,000 largest companies in the Russell 3000.
The Russell 1000 Growth Index ® measures the performance of those Russell 1000 companies with higher price-to-book ratios and higher forecasted growth values.
The Russell 1000 Value Index ® measures the performance of those Russell 1000 companies with lower price-to-book ratios and lower forecasted growth values.
The Russell Midcap Index ® measures the performance of the 800 smallest companies in the Russell 1000 Index.
The Russell Midcap Growth Index ® measures the performance of those Russell Midcap companies with higher price-to- book ratios and higher forecasted growth values. The stocks are also members of the Russell 1000 Growth index.
The Russell Midcap Value Index ® measures the performance of those Russell Midcap companies with lower price-to- book ratios and lower forecasted growth values. The stocks are also members of the Russell 1000 Value index.
The Russell 2000 Index ® measures the performance of the 2,000 smallest companies in the Russell 3000 Index.
The Russell 2000 Growth Index ® measures the performance of those Russell 2000 companies with higher price-to-book ratios and higher forecasted growth values.
The Russell 2000 Value Index ® measures the performance of those Russell 2000 companies with lower price-to-book ratios and lower forecasted growth values.
The Russell Top 200 Index ® measures the performance of the largest cap segment of the U.S. equity universe. It includes approximately 200 of the largest securities based on a combination of their market cap and current index membership and represents approximately 68% of the U.S. market.
The MSCI® EAFE (Europe, Australia, Far East) Net Index is recognized as the pre-eminent benchmark in the United States to measure international equity performance. It comprises 21 MSCI country indexes, representing the developed markets outside of North America.
The MSCI Emerging Markets IndexSM is a free float-adjusted market capitalization index that is designed to measure equity market performance in the global emerging markets. As of June 2007, the MSCI Emerging Markets Index consisted of the following 25 emerging market country indices: Argentina, Brazil, Chile, China, Colombia, Czech Republic, Egypt, Hungary, India, Indonesia, Israel, Jordan, Korea, Malaysia, Mexico, Morocco, Pakistan, Peru, Philippines, Poland, Russia, South Africa, Taiwan, Thailand, and Turkey.
The MSCI ACWI (All Country World Index) Index is a free float-adjusted market capitalization weighted index that is designed to measure the equity market performance of developed and emerging markets. As of June 2009 the MSCI ACWI consisted of 45 country indices comprising 23 developed and 22 emerging market country indices.
The MSCI Small Cap IndicesSM target 40% of the eligible Small Cap universe within each industry group, within each country. MSCI defines the Small Cap universe as all listed securities that have a market capitalization in the range of USD200-1,500 million.
The MSCI All Country Asia Pacific ex-Japan Index is a free float-adjusted market capitalization weighted index that is designed to measure the equity market performance of the developed and emerging markets in the Pacific region. The MSCI All Country Asia Pacific ex-Japan Index consists of the following 11 developed and emerging market countries: Australia, China, Hong Kong, Indonesia, Japan, Korea, Malaysia, New Zealand, Philippines, Singapore, Taiwan, and Thailand.
The MSCI China Index is an unmanaged index considered representative of stocks of China.
The MSCI KOKUSAI Index is a free float-adjusted market capitalization index that is designed to measure the equity market performance of developed markets excluding Japan. The MSCI KOKUSAI Index consists of the following 23 developed market country indices: Australia, Austria, Belgium, Canada, Denmark, Finland, France, Germany, Greece, Hong Kong, Ireland, Israel, Italy, Netherlands, New Zealand, Norway, Portugal, Singapore, Spain, Sweden, Switzerland, the United Kingdom, and the United States*.
The Nikkei 225 Index is a price-weighted average of the 225 top-rated Japanese companies listed in the first section of the Tokyo Stock Exchange.
The Tokyo Price Index (TOPIX) is a capitalization-weighted index lists all firms that are considered to be under the 'first section' on the TSE, which groups all of the large firms on the exchange into one pool. The second section groups all of the remaining smaller firms.
The FTSE 100 Index is an index of the 100 largest companies (by market capitalization) in the United Kingdom.
The FTSE All Share Index is an index of the 630 largest companies (by market capitalization) in the United Kingdom.
The MSCI Value and Growth IndicesSM cover the full range of developed, emerging and All Country MSCI Equity indexes. As of the close of May 30, 2003, MSCI implemented an enhanced methodology for the MSCI Global Value and Growth Indices, adopting a two dimensional framework for style segmentation in which value and growth securities are categorized using different attributes - three for value and five for growth including forward-looking variables. The objective of the index design is to divide constituents of an underlying MSCI Standard Country Index into a value index and a growth index, each targeting 50% of the free float adjusted market capitalization of the underlying country index. Country Value/Growth indices are then aggregated into regional Value/Growth indices. Prior to May 30, 2003, the indices used Price/Book Value (P/BV) ratios to divide the standard MSCI country indices into value and growth indices. All securities were classified as either "value" securities (low P/BV securities) or "growth" securities (high P/BV securities), relative to each MSCI country index. The following MSCI Total Return IndicesSM are calculated with gross dividends:
This series approximates the maximum possible dividend reinvestment. The amount reinvested is the dividend distributed to individuals resident in the country of the company, but does not include tax credits.
The MSCI Europe IndexSM is a free float-adjusted market capitalization index that is designed to measure developed market equity performance in Europe. As of June 2007, the MSCI Europe Index consisted of the following 16 developed market country indices: Austria, Belgium, Denmark, Finland, France, Germany, Greece, Ireland, Italy, the Netherlands, Norway, Portugal, Spain, Sweden, Switzerland and the United Kingdom.
The MSCI Pacific IndexSM is a free float-adjusted market capitalization index that is designed to measure equity market performance in the Pacific region. As of June 2007, the MSCI Pacific Index consisted of the following 5 Developed Market countries: Australia, Hong Kong, Japan, New Zealand, and Singapore.
Credit Suisse/Tremont Hedge Fund Index is compiled by Credit Suisse Tremont Index, LLC. It is an asset-weighted hedge fund index and includes only funds, as opposed to separate accounts. The Index uses the Credit Suisse/Tremont database, which tracks over 4500 funds, and consists only of funds with a minimum of US$50 million under management, a 12-month track record, and audited financial statements. It is calculated and rebalanced on a monthly basis, and shown net of all performance fees and expenses. It is the exclusive property of Credit Suisse Tremont Index, LLC.
The NCREIF Property Index is a quarterly time series composite total rate of return measure of investment performance of a very large pool of individual commercial real estate properties acquired in the private market for investment purposes only. All properties in the NPI have been acquired, at least in part, on behalf of tax-exempt institutional investors - the great majority being pension funds. As such, all properties are held in a fiduciary environment.
The NAREIT EQUITY REIT Index is designed to provide the most comprehensive assessment of overall industry performance, and includes all tax-qualified real estate investment trusts (REITs) that are listed on the NYSE, the American Stock Exchange or the NASDAQ National Market List.

vk.com/id446425943
J.P. Morgan Asset Management: Index definitions
The Dow Jones Industrial Average measures the stock performance of 30 leading blue-chip U.S. companies.
The Dow Jones-UBS Commodity Index is composed of futures contracts on physical commodities and represents twenty two separate commodities traded on U.S. exchanges, with the exception of aluminum, nickel, and zinc.
West Texas Intermediate (WTI) is underlying commodity in the New York Mercantile Exchange's oil futures contracts. The S&P GSCI Index is a composite index of commodity sector returns representing an unleveraged, long-only investment in commodity futures that is broadly diversified across the spectrum of commodities. The returns are calculated on a fully collateralized basis with full reinvestment.
The Bloomberg Barclays U.S. Aggregate Index represents securities that are SEC-registered, taxable, and dollar denominated. The index covers the U.S. investment grade fixed rate bond market, with index components for government and corporate securities, mortgage pass-through securities, and asset-backed securities.
This U.S. Treasury Index is a component of the U.S. Government index.
The Bloomberg Barclays High Yield Index covers the universe of fixed rate, non-investment grade debt. Pay-in-kind (PIK) bonds, Eurobonds, and debt issues from countries designated as emerging markets (e.g., Argentina, Brazil, Venezuela, etc.) are excluded, but Canadian and global bonds (SEC registered) of issuers in non-EMG countries are included.
The Bloomberg Barclays 1-3 Month U.S. Treasury Bill Index includes all publicly issued zero-coupon U.S. Treasury Bills that have a remaining maturity of less than 3 months and more than 1 month, are rated investment grade, and have $250 million or more of outstanding face value.
The Bloomberg Barclays Euro-Aggregate Index consists of bond issued in the euro or the legacy currencies of the sovereign countries participating the European Monetary Union (EMU).
The Global Bond Index Emerging Market Broad Diversified Index (GBI-EM) is a comprehensive global local emerging markets index, and consists of liquid, fixed-rate, domestic currency government bonds.
The Bloomberg Barclays Global Aggregate Corporate Index consists of corporate issues in Europe, the US and Asiapacific regions.
The Bloomberg Barclays Global High Yield Index is an unmanaged index considered representative of fixed rate, noninvestment-grade debt of companies in the U.S., developed markets and emerging markets.
The Bloomberg Barclays Emerging Markets Index includes USD-denominated debt from emerging markets in the following regions: Americas, Europe, Middle East, Africa, and Asia. As with other fixed income benchmarks provided by Barclays Capital, the index is rules-based, which allows for an unbiased view of the marketplace and easy replicability. The Bloomberg Barclays MBS Index covers the mortgage-backed pass-through securities of Ginnie Mae, Fannie Mae, and Freddie Mac. Aggregate components must have a weighted average maturity of at least one year, must have $250 million par amount outstanding, and must be fixed rate mortgages.
The Bloomberg Barclays Corporate Bond Index is the Corporate component of the U.S. Credit index. The Bloomberg Barclays TIPS Index consists of Inflation-Protection securities issued by the U.S. Treasury.
The J.P. Morgan EMBI Global Index includes U.S. dollar denominated Brady bonds, Eurobonds, traded loans and local market debt instruments issued by sovereign and quasi-sovereign entities.
The Li Keqiang Index is a composite measure composed of China’s electricity production, financial institution loans and railway freight.
The Euro Stoxx 600 Index represents large, mid and small capitalisation companies across 18 European countries. The JPMorgan GBI-EM Global Diversified consists of regularly traded, liquid fixed-rate, domestic currency government
bonds to which international investors can gain exposure. The weightings among the countries are more evenly distributed within this index.
The JPMorgan Corporate Emerging Markets Bond Index (CEMBI): The CEMBI tracks total returns of US dollardenominated debt instruments issued by corporate entities in Emerging Markets countries, and consists of an investable universe of corporate bonds. Both indices are also available in Diversified version.
The JPMorgan CEMBI Index is a USD denominated external debt index tracking bond issued by sovereigns and quasisovereigns in the developing nations.
The J.P. Morgan Domestic High Yield Index is designed to mirror the investable universe of the U.S. dollar domestic high yield corporate debt market.
The CS/Tremont Equity Market Neutral Index takes both long and short positions in stocks with the aim of minimizing exposure to the systematic risk of the market (i.e. a beta of zero).*
The CS/Tremont Multi-Strategy Index consists of funds that allocate capital based on perceived opportunities among several hedge fund strategies. Strategies adopted in a multi-strategy fund may include, but are not limited to, convertible bond arbitrage, equity long/short, statistical arbitrage and merger arbitrage.
The Bloomberg Barclays U.S. Dollar Floating Rate Note (FRN) Index provides a measure of the U.S. dollar denominated floating rate note market.
*Market Neutral returns for November 2008 are estimates by J.P. Morgan Funds Market Strategy, and are based on a December 8, 2008 published estimate for November returns by CS/Tremont in which the Market Neutral returns were estimated to be +0.85% (with 69% of all CS/Tremont constituents having reported return data). Presumed to be excluded from the November return are three funds, which were later marked to $0 by CS/Tremont in connection with the Bernard Madoff scandal. J.P. Morgan Funds believes this distortion is not an accurate representation of returns in the category. CS/Tremont later published a finalized November return of -40.56% for the month, reflecting this mark-down. CS/Tremont assumes no responsibility for these estimates.
The Office of National Statistics (ONS) Index is a mix-adjusted average housing price index. The index is calculated monthly using mortgage financed transactions from the Regulated Mortgage Survey by the Council of Mortgage Lenders. The Nationwide House Price Index is a mix adjusted index constructed from Nationwide lending data across the UK. The Halifax House Price Index is constructed from mortgage data derived from Halifax lending data across the UK.
The MSCI AC World High Dividend Yield Index is composed of those securities that have higher-than-average dividend yield within its parent index, a track record of consistent dividend payments and the capacity to sustain future dividend payments.

vk.com/id446425943
J.P. Morgan Asset Management: Risks and disclosures
The Market Insights program provides comprehensive data and commentary on global markets without reference to products. Designed as a tool to help clients understand the markets and support investment decision-making, the program explores the implications of current economic data and changing market conditions. For the purposes of MiFID II, the JPM Market Insights and Portfolio Insights programs are marketing communications and are not in scope for any MiFID II / MiFIR requirements specifically related to investment research. Furthermore, the J.P. Morgan Asset Management Market Insights and Portfolio Insights programs, as non-independent research, have not been prepared in accordance with legal requirements designed to promote the independence of investment research, nor are they subject to any prohibition on dealing ahead of the dissemination of investment research.
This document is a general communication being provided for informational purposes only. It is educational in nature and not designed to be taken as advice or a recommendation for any specific investment product, strategy, plan feature or other purpose in any jurisdiction, nor is it a commitment from J.P. Morgan Asset Management or any of its subsidiaries to participate in any of the transactions mentioned herein. Any examples used are generic, hypothetical and for illustration purposes only. This material does not contain sufficient information to support an investment decision and it should not be relied upon by you in evaluating the merits of investing in any securities or products. In addition, users should make an independent assessment of the legal, regulatory, tax, credit, and accounting implications and determine, together with their own professional advisers, if any investment mentioned herein is believed to be suitable to their personal goals. Investors should ensure that they obtain all available relevant information before making any investment. Any forecasts, figures, opinions or investment techniques and strategies set out are for information purposes only, based on certain assumptions and current market conditions and are subject to change without prior notice. All information presented herein is considered to be accurate at the time of production, but no warranty of accuracy is given and no liability in respect of any error or omission is accepted. It should be noted that investment involves risks, the value of investments and the income from them may fluctuate in accordance with market conditions and taxation agreements and investors may not get back the full amount invested. Both past performance and yields are not a reliable indicator of current and future results. J.P. Morgan Asset Management is the brand for the asset management business of JPMorgan Chase & Co. and its affiliates worldwide. To the extent permitted by applicable law, we may record telephone calls and monitor electronic communications to comply with our legal and regulatory obligations and internal policies. Personal data will be collected, stored and processed by J.P. Morgan Asset Management in accordance with our Company’s Privacy Policy (https://www.jpmorgan.com/global/privacy).For further information regarding our local privacy policies, please follow the respective links: Australia (https://www.jpmorganam.com.au/wps/portal/auec/PrivacyPolicy), EMEA (www.jpmorgan.com/emea-privacy-policy), Hong Kong (https://www.jpmorganam.com.hk/jpm/am/en/privacy-statement), Japan (https://www.jpmorganasset.co.jp/wps/portal/Policy/Privacy), Singapore (http://www.jpmorganam.com.sg/privacy) and Taiwan (https://www.jpmorgan.com/country/GB/en/privacy/taiwan ).
This communication is issued by the following entities: in the United Kingdom by JPMorgan Asset Management (UK) Limited, which is authorized and regulated by the Financial Conduct Authority; in other European jurisdictions by JPMorgan Asset Management (Europe) S.à r.l.; in Hong Kong by JF Asset Management Limited, or JPMorgan Funds (Asia) Limited, or JPMorgan Asset Management Real Assets (Asia) Limited; in Singapore by JPMorgan Asset Management (Singapore) Limited (Co. Reg. No. 197601586K), or JPMorgan Asset Management Real Assets (Singapore) Pte Ltd (Co. Reg. No. 201120355E); in Taiwan by JPMorgan Asset Management (Taiwan) Limited; in Japan by JPMorgan Asset Management (Japan) Limited which is a member of the Investment Trusts Association, Japan, the Japan Investment Advisers Association, Type II Financial Instruments Firms Association and the Japan Securities Dealers Association and is regulated by the Financial Services Agency (registration number “Kanto Local Finance Bureau (Financial Instruments Firm) No. 330”); in Australia to wholesale clients only as defined in section 761A and 761G of the Corporations Act 2001 (Cth) by JPMorgan Asset Management (Australia) Limited (ABN 55143832080) (AFSL 376919); in Brazil by Banco J.P. Morgan S.A.; in Canada for institutional clients’ use only by JPMorgan Asset Management (Canada) Inc., and in the United States by JPMorgan Distribution Services Inc. and J.P. Morgan Institutional Investments, Inc., both members of FINRA; and J.P. Morgan Investment Management Inc.
In APAC, distribution is for Hong Kong, Taiwan, Japan and Singapore. For all other countries in APAC, to intended recipients only.
Copyright 2019 JPMorgan Chase & Co. All rights reserved.
Prepared by: Karen Ward, Tilmann Galler, Vincent Juvyns, Maria Paola Toschi, Michael Bell, Hugh Gimber, Jai Malhi and Ambrose Crofton.
Unless otherwise stated, all data as of 30 June 2019 or most recently available.
Guide to the Markets - Europe
JP-LITTLEBOOK
0903c02a81fb9230