

J.P. Morgan - Guide to the Markets_watermark
.pdfvk.com/id446425943
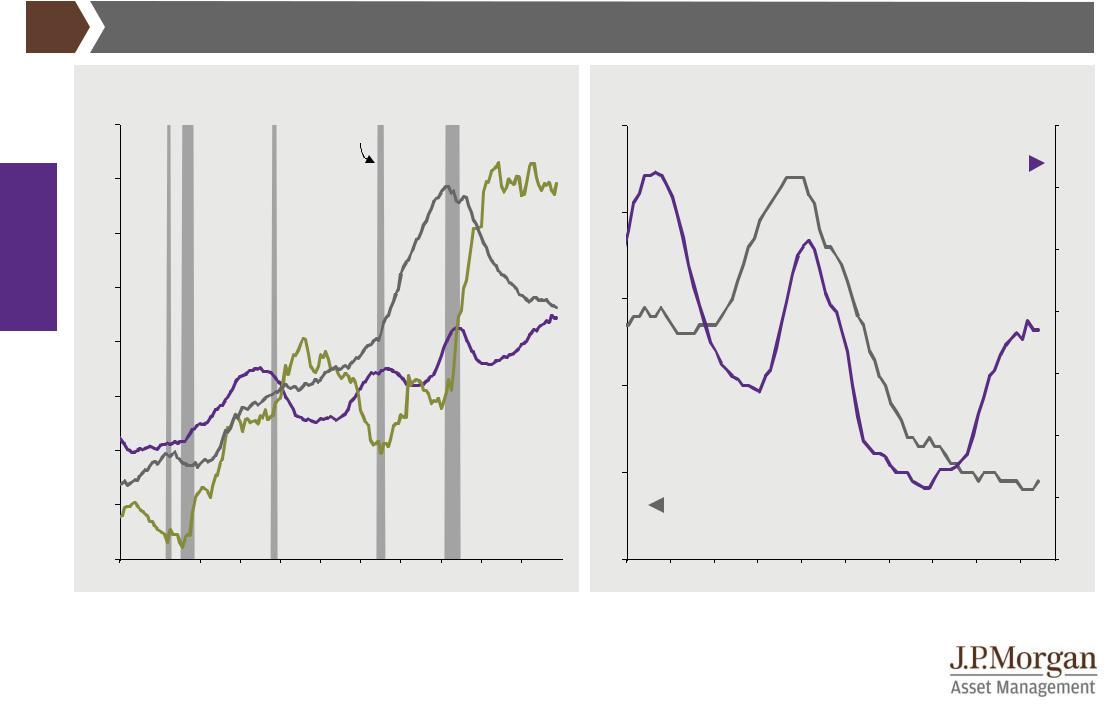
Global economy
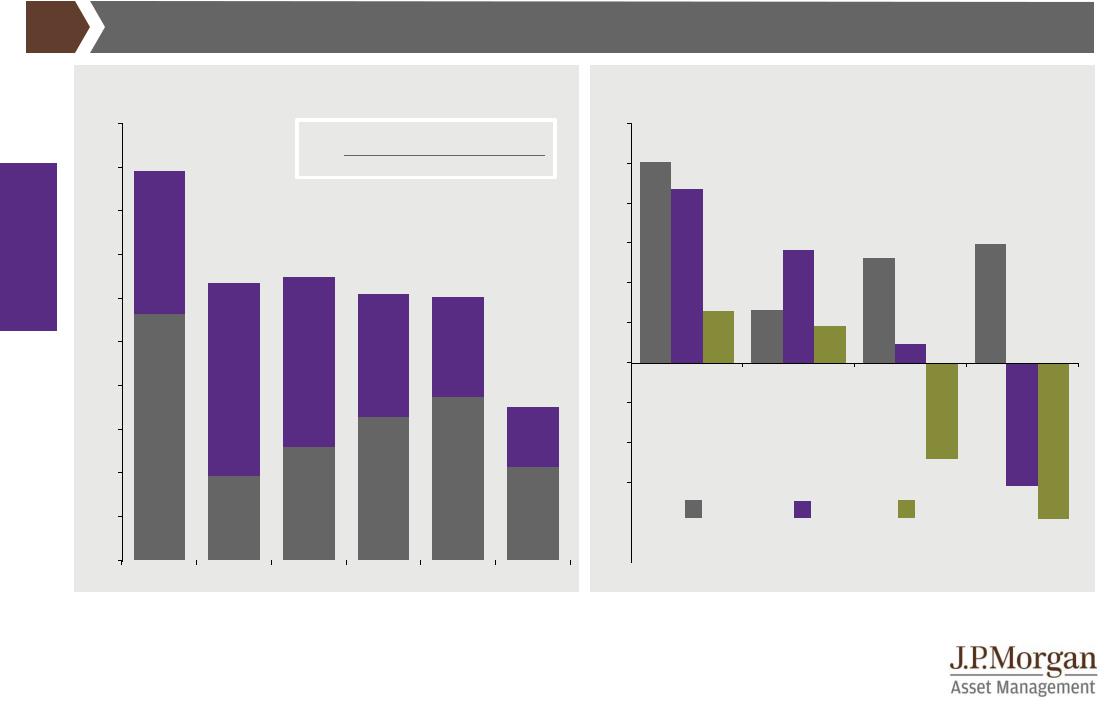
Global trade |
GTM – Europe | 11 |
Exports of goods
% of nominal GDP, 2018
US
Eurozone
Canada
UK
Brazil
India
China
Russia
Mexico
Japan
Korea
US
 China
China
EM ex-China
Eurozone
Other
0 |
5 |
10 |
15 |
20 |
25 |
30 |
35 |
40 |
45 |
Global export volumes
% change year on year, three-month moving average 8
DM
|
|
Global |
|
|
|
6 |
|
EM |
|
||
|
|
4
2
0
-2
-4
'12 |
'13 |
'14 |
'15 |
'16 |
'17 |
'18 |
'19 |
Source: (Left) IMF Direction of Trade, IMF World Economic Outlook, J.P. Morgan Asset Management. (Right) CPB Netherlands, Refinitiv Datastream,
J.P. Morgan Asset Management. Past performance is not a reliable indicator of current and future results. Guide to the Markets - Europe. Data as of 30 June 2019.
11
vk.com/id446425943
Productivity and population growth
Drivers of US GDP growth
Average % change year on year
5,0 |
|
Growth in workers |
|
|
|
|
4,5% |
+ Growth in real output per worker |
4,5 |
Growth in real GDP |
economy |
4,0 |
|
|
|
|
|
|
|
|
|
|
|
|
|
|
Global |
3,5 |
1,6% |
|
|
|
|
|
3,0 |
3,2% |
3,2% |
|
|
|
||
|
|
|
|
|
|
||
|
|
|
|
3,0% |
|
|
|
|
|
|
|
|
3,0% |
|
|
|
|
|
|
|
|
|
|
|
2,5 |
|
|
|
|
|
|
|
2,0 |
|
|
|
|
1,1% |
1,8% |
|
|
|
|
|
1,4% |
|
|
|
|
|
|
|
|
|
|
|
1,5 |
|
|
1,9% |
|
|
|
|
|
|
|
|
|
|
|
|
1,0 |
|
2,2% |
|
|
|
0,7% |
|
|
|
|
|
|
||
|
|
|
|
|
|
|
|
|
0,5 |
|
|
|
|
|
|
|
0,0 |
2,8% |
1,0% |
1,3% |
1,6% |
1,9% |
1,1% |
|
|
|
|
|
|
|
|
|
'58 - '67 |
'68 - '77 |
'78 - '87 |
'88 - '97 |
'98 - '07 |
'08 - '18 |
|
|
|
GTM – Europe | 12
Global working-age population growth
Annualised % change 1,2
1,0 |
|
|
|
|
|
0,8 |
|
|
|
|
|
0,6 |
|
|
|
|
|
0,4 |
|
|
|
|
|
0,2 |
|
|
|
|
|
0,0 |
|
|
|
|
|
-0,2 |
|
|
|
|
|
-0,4 |
|
|
|
|
|
-0,6 |
|
|
|
|
|
-0,8 |
1980-2000 |
|
2000-2020 |
2020-2040 |
|
|
|
|
|
|
|
-1,0 |
US |
UK |
Eurozone |
Japan |
|
|
|||||
Source: (Left) BEA, BLS, J.P. Morgan Asset Management. GDP drivers are calculated as the average annualised growth between 4Q from the preceding year in the period and 4Q of the last year of the period. (Right) United Nations (UN) Department of Economic and Social Affairs, J.P. Morgan Asset Management. Working-age population is defined as aged 15-69. Data from 2020 onwards are UN forecasts. Past performance is not a reliable indicator of current and future results.
Guide to the Markets - Europe. Data as of 30 June 2019.
12
vk.com/id446425943
Global economy
|
|
|
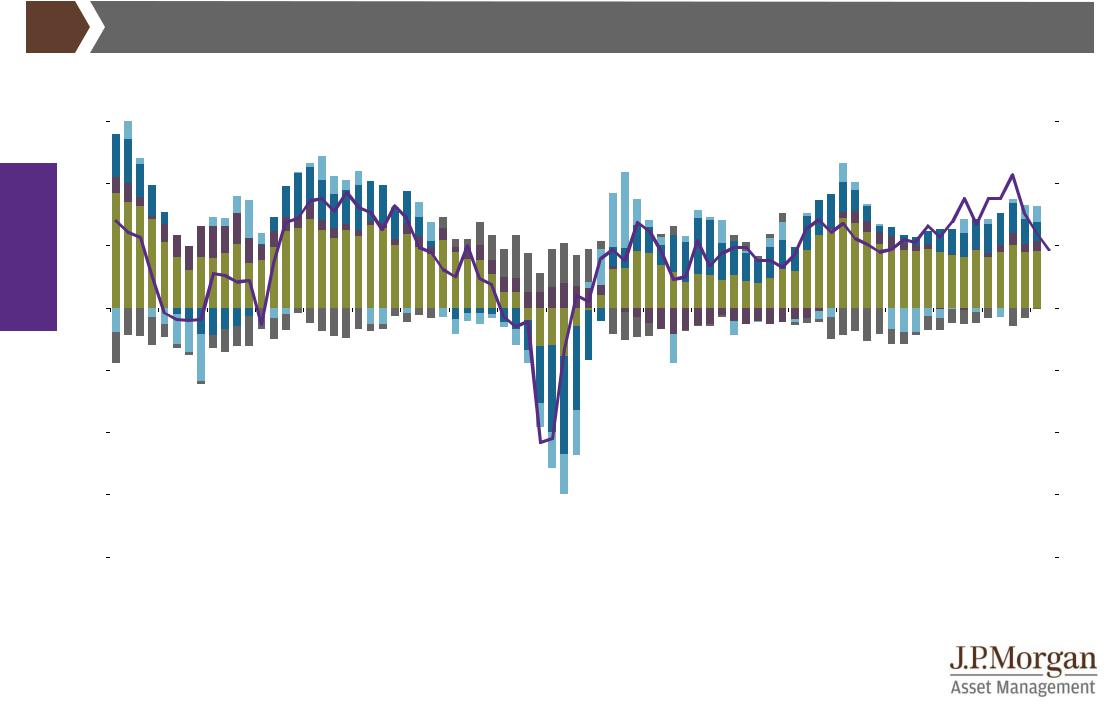
US GDP |
|
|
|
|
|
|
|
|
|
|
|
|
|
|
|
|
|
GTM – Europe |
| 13 |
||||
|
|
|
|
|
|
|
|
|
|
|
|
|
|
|
|
|
|
|||||||||
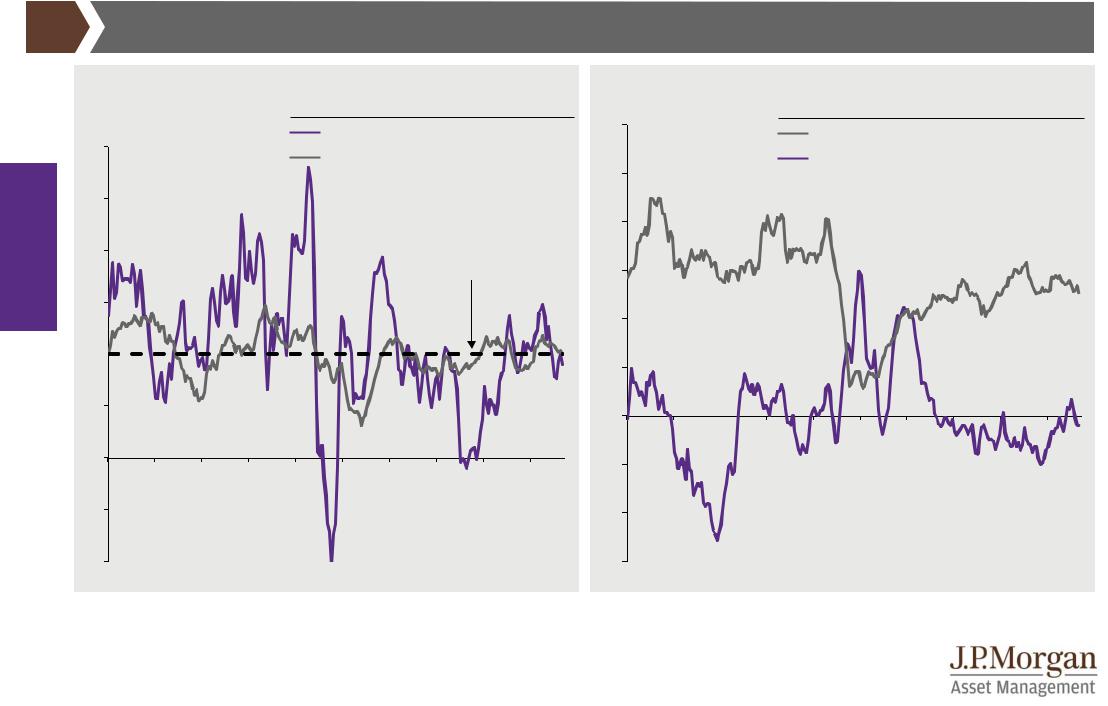
Contribution to US real GDP growth and ISM manufacturing |
|
|
|
|
|
|
|
|
|
|
|
|
|
|||||||||||||
% change year on year (LHS); index level (RHS) |
|
|
|
|
|
|
|
|
|
|
|
|
|
|
|
|
|
|||||||||
6 |
|
|
|
|
|
|
|
|
|
|
|
|
|
|
|
|
|
|
|
|
|
|
|
|
|
65 |
|
|
|
|
|
|
|
|
|
|
|
|
|
|
|
|
|
|
|
|
|
|
|
||||
4 |
|
|
|
|
|
|
|
|
|
|
|
|
|
|
|
|
|
|
|
|
|
|
|
|
|
60 |
2 |
|
|
|
|
|
|
|
|
|
|
|
|
|
|
|
|
|
|
|
|
|
|
|
|
|
55 |
0 |
|
|
|
|
|
|
|
|
|
|
|
|
|
|
|
|
|
|
|
|
|
|
|
|
|
50 |
|
|
|
|
|
|
|
|
|
|
|
|
|
|
|
|
|
|
|
|
|
|
|
|
|
||
-2 |
|
|
|
|
|
|
|
|
|
|
|
|
|
|
|
|
|
|
|
|
|
|
|
|
|
45 |
|
|
|
|
|
|
|
|
|
Net exports |
|
|
|
|
|
|
|
|
|
|
|
|
|
|
|
|
|
|
|
|
|
|
|
|
|
|
|
|
|
|
|
|
|
|
|
|
|
|
|
|
|
|
||
-4 |
|
|
|
|
|
|
|
|
Change in inventories |
|
|
|
|
|
|
|
|
|
|
|
|
|
|
40 |
||
|
|
|
|
|
|
|
|
|
|
|
|
|
|
|
|
|
|
|
|
|
|
|||||
|
|
|
|
|
|
|
|
Investment |
|
|
|
|
|
|
|
|
|
|
|
Average |
|
|
|
|||
|
|
|
|
|
|
|
|
|
|
|
|
|
|
|
|
|
|
|
|
|
|
|||||
|
|
|
|
|
|
|
|
|
|
|
|
|
|
|
|
|
|
|
|
|
|
|
|
|||
|
|
|
|
|
|
|
|
|
Government |
|
|
|
|
|
|
|
|
|
|
|
1Q19 |
|
|
|
||
|
|
|
|
|
|
|
|
|
|
|
|
|
|
|
|
|
|
|
|
|
|
|
||||
|
|
|
|
|
|
|
|
|
|
|
|
|
|
|
|
|
|
|
since 2000 |
|
|
|
||||
-6 |
|
|
|
|
|
|
|
|
Consumption |
|
|
|
|
|
|
|
|
|
|
|
|
|
35 |
|||
|
|
|
|
|
|
|
|
|
|
|
|
|
|
|
|
|
|
|
2,1% |
3,2% |
|
|
||||
-8 |
|
|
|
|
|
|
|
|
ISM composite (RHS) |
|
|
|
|
|
|
|
|
|
|
|
|
30 |
||||
|
|
|
|
|
|
|
|
|
|
|
|
|
|
|
|
|
|
|
|
|
|
|||||
|
|
|
|
|
|
|
|
|
|
|
|
|
|
|
|
|
|
|
|
|
|
|||||
|
|
|
|
|
|
|
|
|
|
|
|
|
|
|
|
|
|
|
|
|
|
|
|
|
||
|
|
|
|
|
|
|
|
|
|
|
|
|
|
|
|
|
|
|
|
|
|
|
||||
'00 |
'01 |
'02 |
'03 |
'04 |
'05 |
'06 |
'07 |
'08 |
'09 |
'10 |
'11 |
'12 |
'13 |
'14 |
'15 |
'16 |
'17 |
'18 |
'19 |
|
|
|||||
|
|
|
|
|
|
|
|
|
|
|
|
|
|
|
|
|
|
|
|
|
|
|
|
|
|
|
Source: BEA, Bloomberg, ISM, Refinitiv Datastream, J.P. Morgan Asset Management. The Institute for Supply Management (ISM) composite is an economy weighted average of the manufacturing and non-manufacturing surveys. A score of 50 indicates that economic activity is neither expanding nor contracting, above 50 indicates expansion. ISM data is shown with quarterly frequency. Past performance is not a reliable indicator of current and future results. Guide to the Markets - Europe.
Data as of 30 June 2019.
13
vk.com/id446425943
Global economy
|
|
|
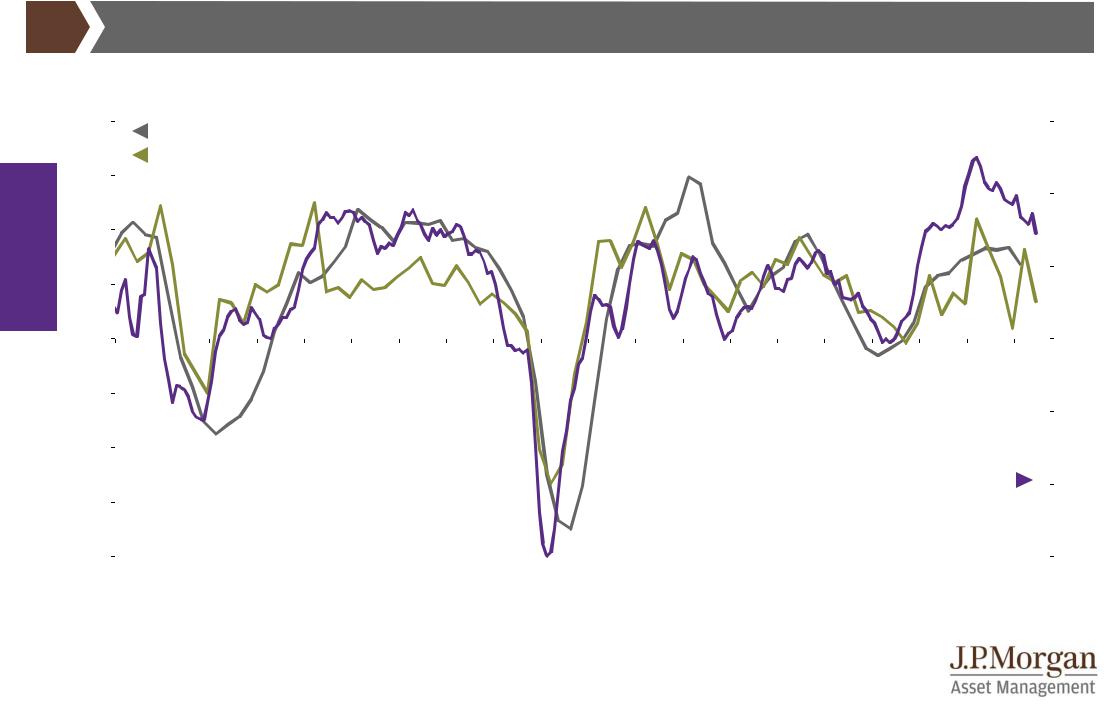
US corporates |
|
|
|
|
|
|
|
|
|
|
|
|
|
GTM – Europe | 14 |
||||||
|
|
|
|
|
|
|
|
|
|
|
|
|
|
|
|
||||||||
US future capex intentions and business investment |
|
|
|
|
|
|
|
|
|
|
|
|
|
||||||||||
% change year on year (LHS); index level (RHS) |
|
|
|
|
|
|
|
|
|
|
|
|
|
|
|
|
|||||||
20 |
|
|
Business investment |
|
|
|
|
|
|
|
|
|
|
|
|
|
|
|
|
40 |
|||
|
|
|
|
|
|
|
|
|
|
|
|
|
|
|
|
||||||||
|
|
|
|
|
|
|
|
|
|
|
|
|
|
|
|
|
|
|
|
||||
|
|
|
Duke CFO future capex intentions |
|
|
|
|
|
|
|
|
|
|
|
|
|
|
|
|
||||
15 |
|
|
|
|
|
|
|
|
|
|
|
|
|
|
|
|
|
|
|
|
|
|
|
|
|
|
|
|
|
|
|
|
|
|
|
|
|
|
|
|
|
|
|
|
|
|
30 |
10 |
|
|
|
|
|
|
|
|
|
|
|
|
|
|
|
|
|
|
|
|
|
|
|
|
|
|
|
|
|
|
|
|
|
|
|
|
|
|
|
|
|
|
|
|
|
|
20 |
5 |
|
|
|
|
|
|
|
|
|
|
|
|
|
|
|
|
|
|
|
|
|
|
|
0 |
|
|
|
|
|
|
|
|
|
|
|
|
|
|
|
|
|
|
|
|
|
|
10 |
|
|
|
|
|
|
|
|
|
|
|
|
|
|
|
|
|
|
|
|
|
|
||
-5 |
|
|
|
|
|
|
|
|
|
|
|
|
|
|
|
|
|
|
|
|
|
|
|
|
|
|
|
|
|
|
|
|
|
|
|
|
|
|
|
|
|
|
|
|
|
|
0 |
-10 |
|
|
|
|
|
|
|
|
|
|
|
|
|
|
|
|
|
|
|
|
|
|
|
|
|
|
|
|
|
|
|
|
|
|
|
|
|
|
|
|
|
Future capex intentions |
|
|
-10 |
||
|
|
|
|
|
|
|
|
|
|
|
|
|
|
|
|
|
|
|
|
|
|
|
|
-15 |
|
|
|
|
|
|
|
|
|
|
|
|
|
|
|
|
|
|
|
|
|
|
|
-20 |
|
|
|
|
|
|
|
|
|
|
|
|
|
|
|
|
|
|
|
|
|
|
-20 |
|
|
|
|
|
|
|
|
|
|
|
|
|
|
|
|
|
|
|
|
||||
'00 |
'01 |
'02 |
'03 |
'04 |
'05 |
'06 |
'07 |
'08 |
'09 |
'10 |
'11 |
'12 |
'13 |
'14 |
'15 |
'16 |
'17 |
'18 |
'19 |
|
|
||
|
|
|
|
|
|
|
|
|
|
|
|
|
|
|
|
|
|
|
|
|
|
|
|
Source: BEA, Dallas Fed, Duke CFO Global Business Outlook, Haver Analytics, Kansas City Fed, New York Fed, Philadelphia Fed, Refinitiv Datastream, Richmond Fed, J.P. Morgan Asset Management. Future capex intentions is an average index level of the five aforementioned fed districts equally weighted, displayed using a three-month moving average. Duke CFO future capex intentions is expected growth in the next 12 months. Past performance is not a reliable indicator of current and future results. Guide to the Markets - Europe. Data as of 30 June 2019.
14
vk.com/id446425943
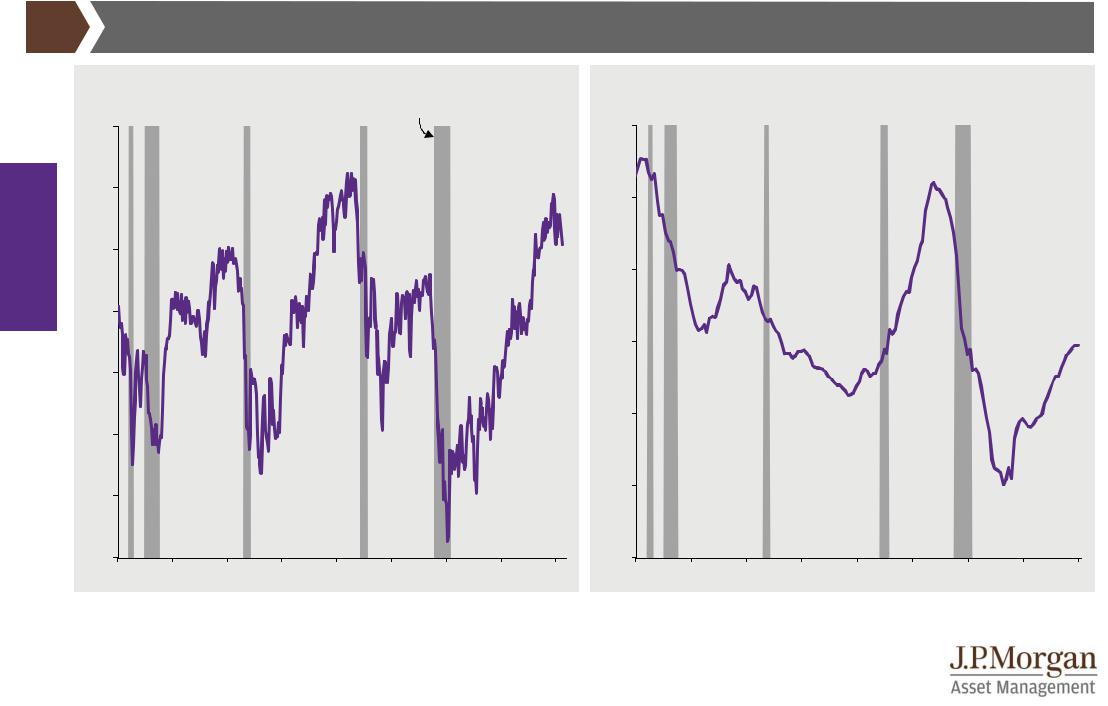
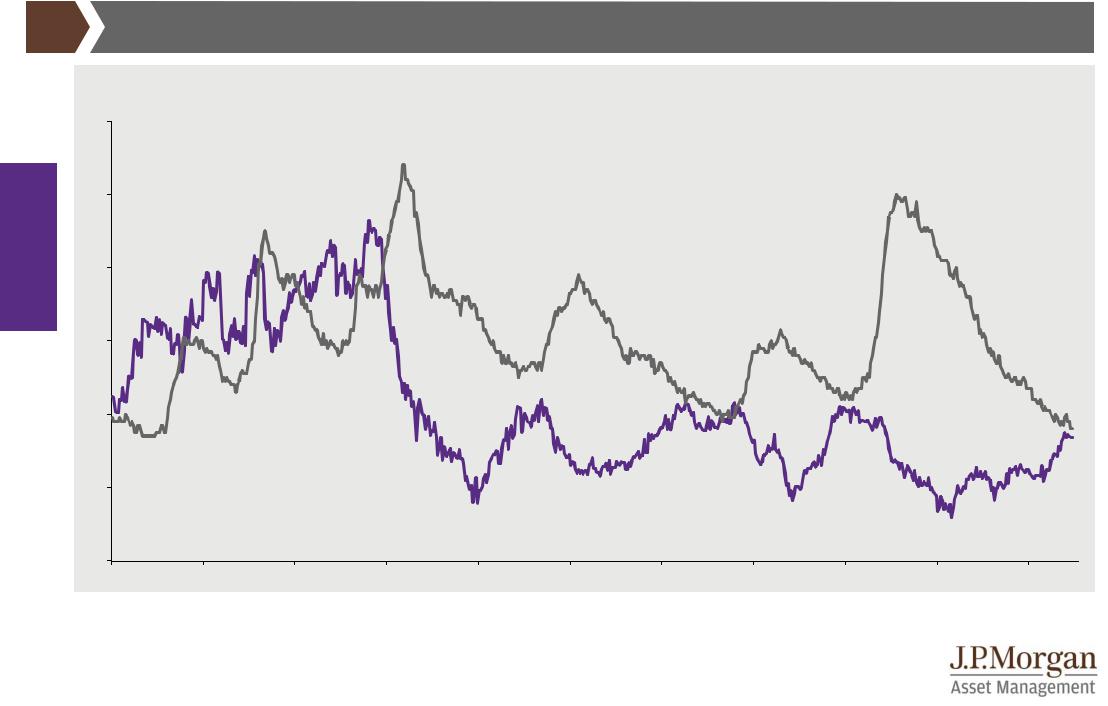
US consumer |
GTM – Europe | 15 |
US consumer confidence |
US house prices relative to income |
|
Index level |
|
|
|
|
Recession |
|
|
|
Index level |
|
|
|
|
|
|
|
|
|
|
|
|
|
|
|
|
|
140 |
|
|
|
|
|
|
|
|
|
|
160 |
|
|
|
|
|
|
|
|
|
|
|
|
|
|
|
|
|
economy |
140 |
|
|
|
|
|
|
|
|
130 |
|
|
|
|
|
|
|
|
|
|
|
|
|
|
|
|
|
|
|
|
|
|
|
|
|
||
120 |
|
|
|
|
|
|
|
|
|
|
|
|
|
|
|
|
|
|
Global |
|
|
|
|
|
|
|
|
|
120 |
|
|
|
|
|
|
|
|
100 |
|
|
|
|
|
|
|
|
|
|
|
|
|
|
|
|
|
|
|
|
|
|
|
|
|
|
|
|
|
|
|
|
|
|
|
|
|
|
|
|
|
|
|
|
|
|
|
110 |
|
|
|
|
|
|
|
|
|
80 |
|
|
|
|
|
|
|
|
|
|
|
|
|
|
|
|
|
|
|
|
|
|
|
|
|
|
|
100 |
|
|
|
|
|
|
|
|
|
60 |
|
|
|
|
|
|
|
|
|
|
|
|
|
|
|
|
|
|
40 |
|
|
|
|
|
|
|
|
90 |
|
|
|
|
|
|
|
|
|
|
|
|
|
|
|
|
|
|
|
|
|
|
|
|
|
|
|
|
20 |
|
|
|
|
|
|
|
|
80 |
|
|
|
|
|
|
|
|
|
'79 |
'84 |
'89 |
'94 |
'99 |
'04 |
'09 |
'14 |
'19 |
'79 |
'84 |
'89 |
'94 |
'99 |
'04 |
'09 |
'14 |
'19 |
Source: (Left) Conference Board, Refinitiv Datastream, J.P. Morgan Asset Management. (Right) OECD, Refinitiv Datastream, J.P. Morgan Asset Management. Periods of “recession” are defined using US National Bureau of Economic Research (NBER) business cycle dates. Past performance is not a reliable indicator of current and future results. Guide to the Markets - Europe. Data as of 30 June 2019.
15
vk.com/id446425943
US labour market |
GTM – Europe | 16 |
US unemployment rate and wage growth
|
%, wage growth is year on year |
|
|
|
|
|
|
|
|
|
|
|
12 |
|
|
|
|
|
|
|
|
|
|
economy |
10 |
|
|
|
|
|
|
|
|
|
|
|
|
|
|
|
Unemployment |
|
|
|
|
|
|
Global |
8 |
|
|
|
|
|
|
|
|
|
|
|
|
|
|
|
|
|
|
|
|
||
|
|
|
|
|
|
|
|
|
|
|
|
|
6 |
|
|
|
|
|
|
|
|
|
|
|
|
|
|
|
|
|
|
|
|
|
Jun 2019: |
|
|
|
|
|
|
|
|
|
|
|
3,7% |
|
4 |
|
|
|
|
|
|
|
|
|
|
|
2 |
|
|
|
|
Wage growth |
|
|
|
|
Jun 2019: |
|
|
|
|
|
|
|
|
|
|
||
|
|
|
|
|
|
|
|
|
|
|
|
|
|
|
|
|
|
|
|
|
|
|
3,4% |
|
0 |
|
|
|
|
|
|
|
|
|
|
|
'67 |
'72 |
'77 |
'82 |
'87 |
'92 |
'97 |
'02 |
'07 |
'12 |
'17 |
Source: BEA, Refinitiv Datastream, J.P. Morgan Asset Management. Wage growth is average hourly earnings of total private production and non-supervisory employees. Past performance is not a reliable indicator of current and future results. Guide to the Markets - Europe. Data as of 30 June 2019.
16
vk.com/id446425943
US inflation |
|
|
|
GTM – Europe |
| 17 |
|
US headline and core inflation |
Average |
May |
US core goods and services inflation |
Average |
May |
|
% change year on year |
% change year on year |
|||||
since 2000 |
2019 |
since 2000 |
2019 |
|
|
|
|
|
|
Headline CPI |
2,2% |
|
1,8% |
6 |
|
|
6 |
|
|
|
|
|
|
||||
|
|
|
|
|
Core CPI |
2,0% |
|
2,0% |
|
||
|
|
|
|
|
|
|
|
||||
economy |
|
|
|
|
|
|
|
|
|
|
5 |
5 |
|
|
|
|
|
|
|
|
|
|
|
|
|
|
|
|
|
|
|
|
|
4 |
|
4 |
|
|
|
|
|
|
Headline inflation |
|
|||
Global |
|
|
|
|
|
|
|
target |
|
3 |
|
3 |
|
|
|
|
|
|
|
|
|
|
|
|
|
|
|
|
|
|
|
|
|
2 |
|
|
|
|
|
|
|
|
|
|
|
|
|
|
2 |
|
|
|
|
|
|
|
|
|
1 |
|
|
|
|
|
|
|
|
|
|
|
|
|
1 |
|
|
|
|
|
|
|
|
|
0 |
|
|
|
|
|
|
|
|
|
|
|
|
|
0 |
|
|
|
|
|
|
|
|
|
-1 |
|
|
|
|
|
|
|
|
|
|
|
|
|
-1 |
|
|
|
|
|
|
|
|
|
-2 |
|
-2 |
|
|
|
|
|
|
|
|
|
-3 |
|
'00 |
'02 |
'04 |
'06 |
'08 |
'10 |
'12 |
'14 |
'16 |
'18 |
|
|
|
|
|
Services CPI |
|
2,8% |
|
2,5% |
|
|
|
|
|
Core goods CPI |
0,0% |
|
-0,2% |
||
'00 |
'02 |
'04 |
'06 |
'08 |
'10 |
'12 |
'14 |
'16 |
'18 |
Source: (All charts) BLS, Refinitiv Datastream, J.P. Morgan Asset Management. CPI is the Consumer Price Index. Core CPI is defined as CPI excluding food and energy. Core goods CPI is defined as goods CPI excluding food and energy. Past performance is not a reliable indicator of current and future results.
Guide to the Markets - Europe. Data as of 30 June 2019.
17
vk.com/id446425943
Global economy
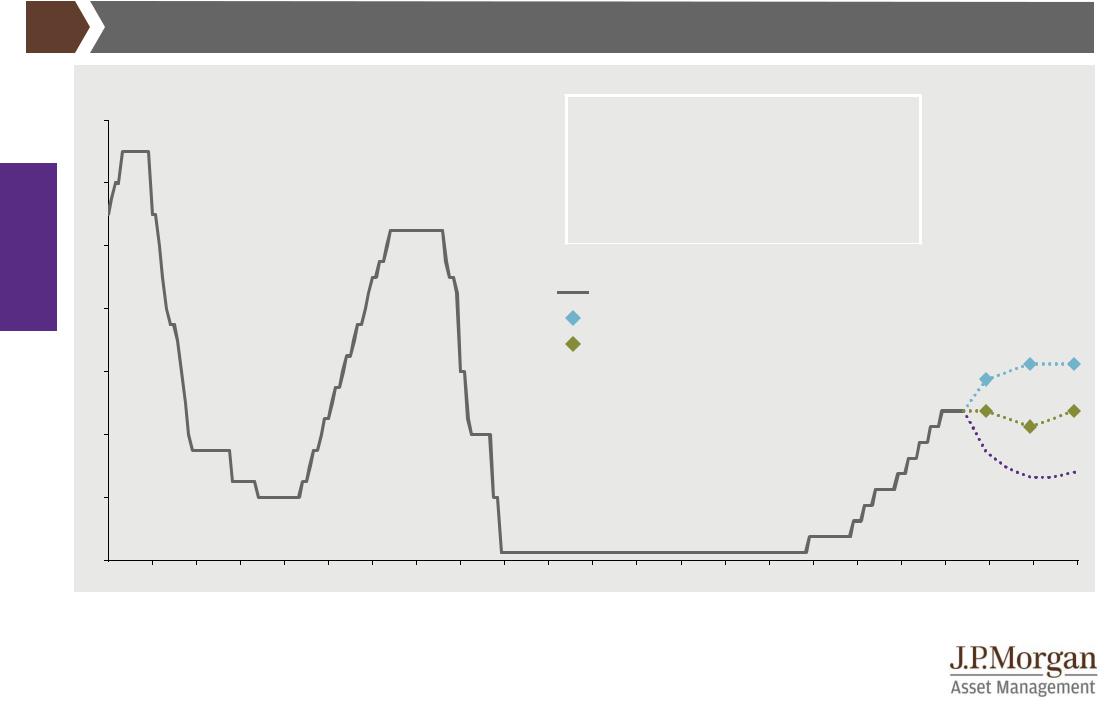
US Federal Reserve policy rate |
|
|
GTM – Europe | 18 |
|||
Federal funds policy rate expectations |
|
|
|
|
|
|
% Fed funds rate, FOMC and market expectations |
|
|
|
|
|
|
FOMC June 2019 forecasts* (%) |
|
|
|
|
||
7 |
|
|
|
|
|
|
|
2019 |
2020 |
2021 |
|
|
|
|
|
|
|
|||
|
|
|
|
|
|
|
|
|
2,1 |
2,0 |
1,8 |
|
|
6 |
|
|
|
|
|
|
3,6 |
3,7 |
3,8 |
|
|
||
|
|
|
|
|||
|
|
|
|
|
|
|
|
|
1,5 |
1,9 |
2,0 |
|
|
5 |
|
|
|
|
|
|
|
|
|
|
|
||
4
forecasts (median)
(median)
3 |
|
2019 (mean) |
|
2
1
0
'00 |
'01 |
'02 |
'03 |
'04 |
'05 |
'06 |
'07 |
'08 |
'09 |
'10 |
'11 |
'12 |
'13 |
'14 |
'15 |
'16 |
'17 |
'18 |
'19 |
'20 |
'21 |
'22 |
Source: Bloomberg, US Federal Reserve, J.P. Morgan Asset Management. *Forecasts are median estimates of Federal Open Market Committee (FOMC) participants. PCE is personal consumption expenditure. Market expectations are calculated using OIS forwards. Past performance is not a reliable indicator of current and future results. Guide to the Markets - Europe. Data as of 30 June 2019.
18
vk.com/id446425943
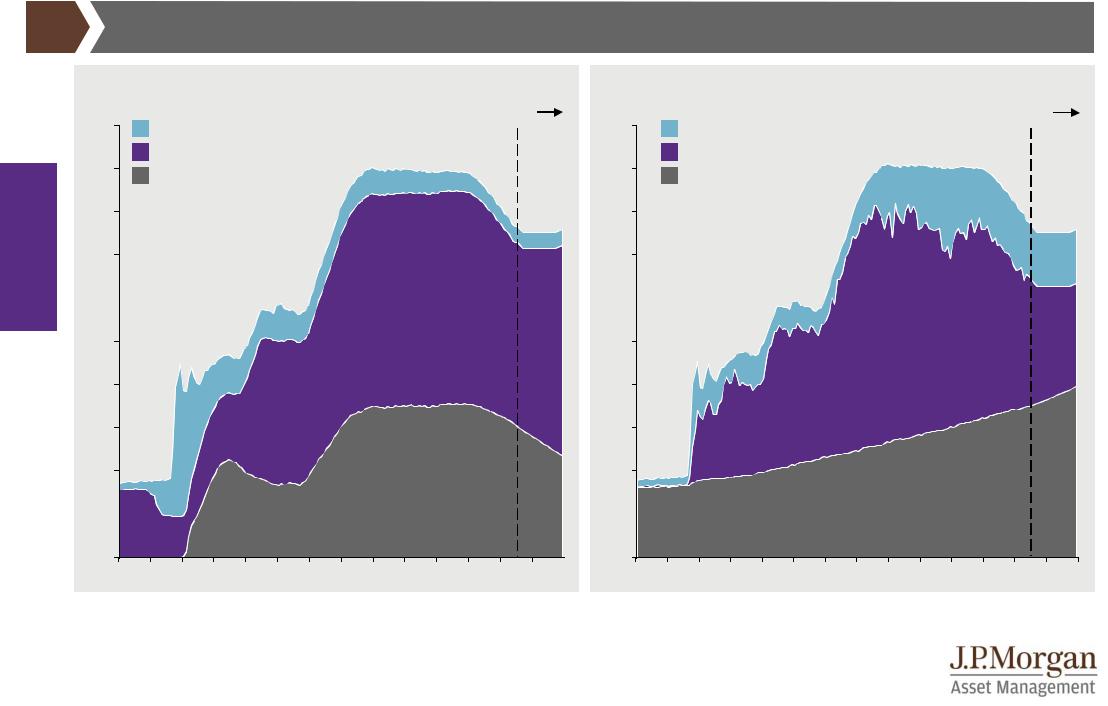
US Federal Reserve balance sheet
US Federal Reserve: Balance sheet assets
|
USD trillions |
|
|
|
|
|
|
|
|
|
Forecast |
|||
|
5,0 |
|
|
|
|
|
|
|
|
|
|
|||
|
|
Other |
|
|
|
|
|
|
|
|
|
|
|
|
|
4,5 |
|
Treasuries |
|
|
|
|
|
|
|
|
|
|
|
|
|
Mortgage-backed securities |
|
|
|
|
|
|
||||||
economy |
|
|
|
|
|
|
|
|
||||||
4,0 |
|
|
|
|
|
|
|
|
|
|
|
|
|
|
3,5 |
|
|
|
|
|
|
|
|
|
|
|
|
|
|
Global |
|
|
|
|
|
|
|
|
|
|
|
|
|
|
3,0 |
|
|
|
|
|
|
|
|
|
|
|
|
|
|
|
|
|
|
|
|
|
|
|
|
|
|
|
|
|
|
2,5 |
|
|
|
|
|
|
|
|
|
|
|
|
|
|
2,0 |
|
|
|
|
|
|
|
|
|
|
|
|
|
|
1,5 |
|
|
|
|
|
|
|
|
|
|
|
|
|
|
1,0 |
|
|
|
|
|
|
|
|
|
|
|
|
|
|
0,5 |
|
|
|
|
|
|
|
|
|
|
|
|
|
|
0,0 |
|
|
|
|
|
|
|
|
|
|
|
|
|
|
'07 |
'08 |
'09 |
'10 |
'11 |
'12 |
'13 |
'14 |
'15 |
'16 |
'17 |
'18 |
'19 |
'20 |
GTM – Europe | 19
US Federal Reserve: Balance sheet liabilities
USD trillions |
|
|
|
|
|
|
|
|
|
Forecast |
|||
5,0 |
|
Other |
|
|
|
|
|
|
|
||||
|
|
|
|
|
|
|
|
|
|
|
|||
4,5 |
|
Reserves |
|
|
|
|
|
|
|
|
|
|
|
|
Currency in circulation |
|
|
|
|
|
|
|
|||||
|
|
|
|
|
|
|
|
|
|||||
4,0 |
|
|
|
|
|
|
|
|
|
|
|
|
|
3,5 |
|
|
|
|
|
|
|
|
|
|
|
|
|
3,0 |
|
|
|
|
|
|
|
|
|
|
|
|
|
2,5 |
|
|
|
|
|
|
|
|
|
|
|
|
|
2,0 |
|
|
|
|
|
|
|
|
|
|
|
|
|
1,5 |
|
|
|
|
|
|
|
|
|
|
|
|
|
1,0 |
|
|
|
|
|
|
|
|
|
|
|
|
|
0,5 |
|
|
|
|
|
|
|
|
|
|
|
|
|
0,0 |
|
|
|
|
|
|
|
|
|
|
|
|
|
'07 |
'08 |
'09 |
'10 |
'11 |
'12 |
'13 |
'14 |
'15 |
'16 |
'17 |
'18 |
'19 |
'20 |
Source: (All charts) Refinitiv Datastream, US Federal Reserve, J.P. Morgan Asset Management. Forecast: US Federal Reserve (Fed) balance sheet assets are projected to decrease until the end of September 2019, in line with the Fed’s announced plans. Reserves are subsequently expected to decline to a level of USD 1.2 trillion and then expected to be held constant, with overall liabilities growing in line with currency in circulation, which is expected to be 6.8% per annum (in line with the historical average). The asset side of the balance sheet will match in overall terms, but is expected to be progressively shifted from mortgage-backed securities to US Treasuries. Other assets and other liabilities are held constant over the forecast period. Past performance is not a reliable indicator of current and future results.
Guide to the Markets - Europe. Data as of 30 June 2019.
19
vk.com/id446425943
US debt |
GTM – Europe | 20 |
US debt to GDP ratios |
US debt service ratios |
|
% of nominal GDP |
|
|
|
|
|
|
|
|
% of disposable income |
|
|
|
|
|
|
|
||||
|
110 |
|
|
|
|
Recession |
|
|
|
|
12 |
|
|
|
|
|
|
|
|
48 |
|
|
|
|
|
|
|
|
|
Government |
|
|
|
|
|
|
|
|
|
|
|||
|
|
|
|
|
|
|
|
|
|
|
|
|
|
|
|
|
|
|
|
||
|
100 |
|
|
|
|
|
|
|
|
|
|
|
|
|
|
|
|
Non-financial corporates |
|||
economy |
|
|
|
|
|
|
|
|
|
|
|
|
|
|
|
|
|
|
|
44 |
|
|
|
|
|
|
|
|
|
|
|
|
|
|
|
|
|
|
|
|
|
|
46 |
|
|
|
|
|
|
|
|
|
|
|
|
11 |
|
|
|
|
|
|
|
|
|
Global |
90 |
|
|
|
|
|
|
|
|
|
Households |
|
|
|
|
|
|
|
|
|
|
80 |
|
|
|
|
|
|
|
|
|
|
10 |
|
|
|
|
|
|
|
|
|
|
|
|
|
|
|
|
|
|
|
|
|
|
|
|
|
|
|
|
|
|
||
|
|
|
|
|
|
|
|
|
|
|
|
|
|
|
|
|
|
|
|
42 |
|
|
|
|
|
|
|
|
|
|
|
|
|
|
|
|
|
|
|
|
|
|
|
|
70 |
|
|
|
|
|
|
|
|
|
|
|
|
|
|
|
|
|
|
|
|
|
|
|
|
|
|
|
|
|
|
Non-financial |
9 |
|
|
|
|
|
|
|
|
40 |
|
|
60 |
|
|
|
|
|
|
|
|
|
|
|
|
|
|
|
|
|
|||
|
|
|
|
|
|
|
|
|
corporates |
|
|
|
|
|
|
|
|
|
|
||
|
|
|
|
|
|
|
|
|
|
|
|
|
|
|
|
|
|
|
|
||
|
50 |
|
|
|
|
|
|
|
|
|
|
|
|
|
|
|
|
|
|
|
38 |
|
|
|
|
|
|
|
|
|
|
|
|
|
|
|
|
|
|
|
|
|
|
|
|
|
|
|
|
|
|
|
|
|
|
8 |
|
|
|
|
|
|
|
|
|
|
40 |
|
|
|
|
|
|
|
|
|
|
|
Households |
|
|
|
|
|
36 |
||
|
|
|
|
|
|
|
|
|
|
|
|
|
|
|
|
|
|
||||
|
30 |
|
|
|
|
|
|
|
|
|
|
7 |
|
|
|
|
|
|
|
|
34 |
|
'75 |
'79 |
'83 |
'87 |
'91 |
'95 |
'99 |
'03 |
'07 |
'11 |
'15 |
'00 |
'02 |
'04 |
'06 |
'08 |
'10 |
'12 |
'14 |
'16 |
'18 |
Source: (All charts) Bank for International Settlements, Refinitiv Datastream, J.P. Morgan Asset Management. Debt refers to gross debt. For the household sector, gross disposable income is the amount of money that all of the individuals in the household sector have available for spending or saving after income distribution measures (for example, taxes, social contributions and benefits) have taken effect. For the non-financial corporate sector, gross disposable income is essentially akin to gross operating surplus before dividends or interest is paid. Periods of “recession” are defined using US National Bureau of Economic Research (NBER) business cycle dates. Past performance is not a reliable indicator of current and future results. Guide to the Markets - Europe. Data as of 30 June 2019.
20