

J.P. Morgan - Guide to the Markets_watermark
.pdfvk.com/id446425943
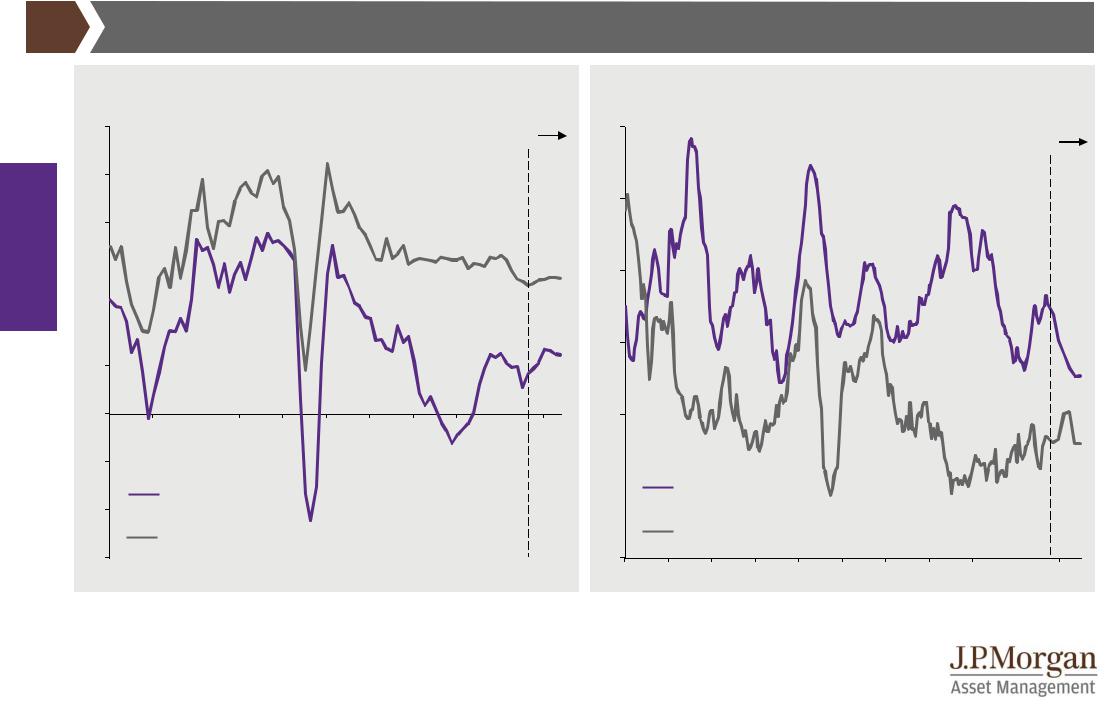
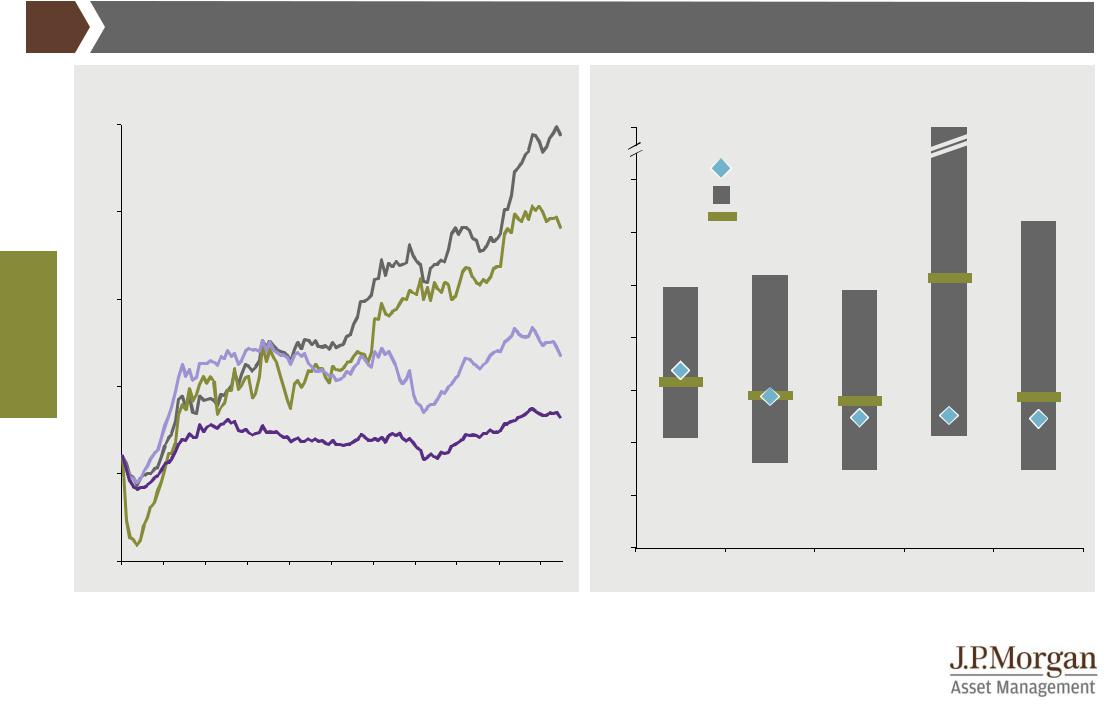
China inflation and policy rates |
GTM – Europe | 41 |
|
China inflation |
|
|
|
|
|
|
Average |
|
May |
|||
|
% change year on year |
|
|
|
|
|
|
||||||
|
|
|
|
|
|
since 2007 |
|
2019 |
|||||
|
|
|
|
|
|
|
|
|
|
|
|||
|
15 |
|
|
|
|
|
Headline CPI* |
2,7% |
|
2,7% |
|||
|
|
|
|
|
|
|
Core CPI |
|
1,3% |
|
1,6% |
||
economy |
|
|
|
|
|
|
Headline PPI** |
1,1% |
|
0,6% |
|||
10 |
|
|
|
|
|
|
|
|
|
|
|
|
|
|
|
|
|
|
|
|
|
|
|
|
|
|
|
Global |
5 |
|
|
|
|
|
|
|
|
|
|
|
|
|
|
|
|
|
|
|
|
|
|
|
|
|
|
|
0 |
|
|
|
|
|
|
|
|
|
|
|
|
|
-5 |
|
|
|
|
|
|
|
|
|
|
|
|
|
-10 |
|
|
|
|
|
|
|
|
|
|
|
|
|
'07 |
'08 |
'09 |
'10 |
'11 |
'12 |
'13 |
'14 |
'15 |
'16 |
'17 |
'18 |
'19 |
China interbank rate and reserve requirement ratio (RRR)
% rate |
|
|
|
|
|
|
|
|
|
|
|
|
7 |
|
|
|
|
|
|
|
|
|
|
|
30 |
|
SHIBOR |
|
|
|
|
|
|
|
|
RRR |
|
|
6 |
|
|
|
|
|
|
|
|
|
|
|
|
|
|
|
|
|
|
|
|
|
|
|
|
25 |
5 |
|
|
|
|
|
|
|
|
|
|
|
|
4 |
|
|
|
|
|
|
|
|
|
|
|
20 |
|
|
|
|
|
|
|
|
|
|
|
|
|
3 |
|
|
|
|
|
|
|
|
|
|
|
15 |
|
|
|
|
|
|
|
|
|
|
|
|
|
2 |
|
|
|
|
|
|
|
|
|
|
|
|
|
|
|
|
|
|
|
|
|
|
|
|
10 |
1 |
|
|
|
|
|
|
|
|
|
|
|
|
0 |
|
|
|
|
|
|
|
|
|
|
|
5 |
'07 |
'08 |
'09 |
'10 |
'11 |
'12 |
'13 |
'14 |
'15 |
'16 |
'17 |
'18 |
'19 |
Source: (Left) Bloomberg, Refinitiv Datastream, J.P. Morgan Asset Management. *CPI is the Consumer Price Index. Core CPI is defined as CPI excluding food and energy. **PPI is the Producer Price Index. (Right) People’s Bank of China, Refinitiv Datastream, J.P. Morgan Asset Management. Average RRR for large and small banks. SHIBOR is the 3-month interbank rate. Past performance is not a reliable indicator of current and future results. Guide to the Markets - Europe.
Data as of 30 June 2019.
41
vk.com/id446425943 |
|
|
|
|
|
|
|
|
|
|
|
|
|
|
|
|
|
|
|
|
|||
|
|
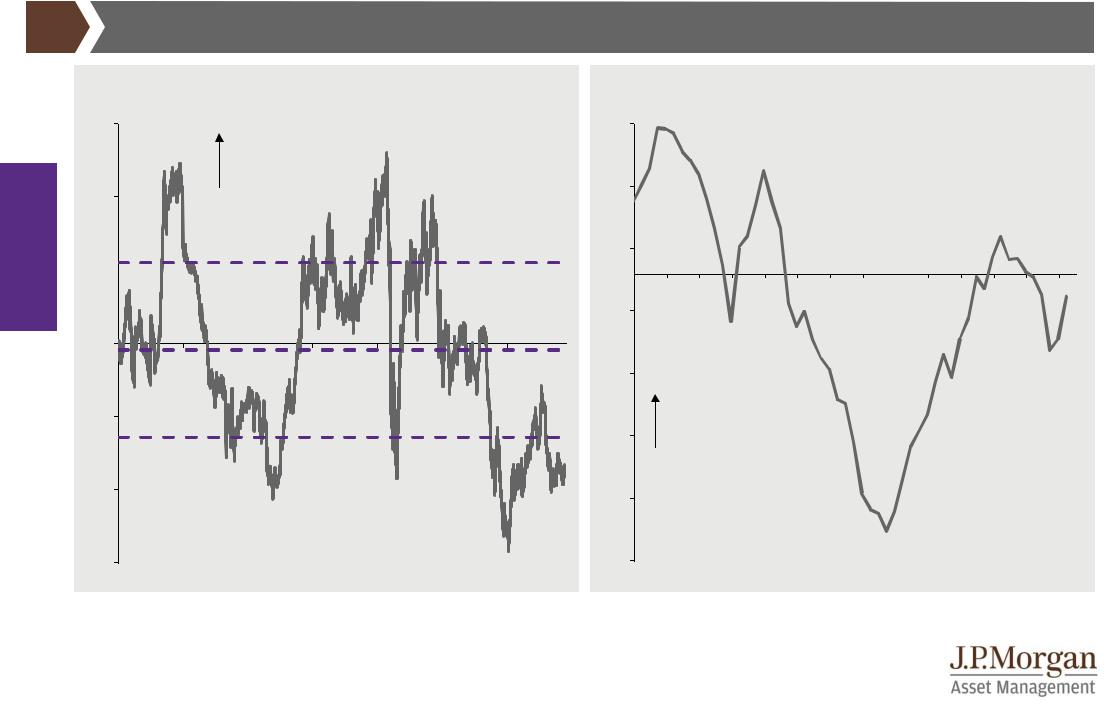
Emerging markets GDP and inflation |
|
|
|
|
|
|
|
|
GTM – Europe |
| |
42 |
||||||||||
|
EM GDP growth |
|
|
|
|
|
|
|
|
EM inflation |
|
|
|
|
|
|
|
|
|
||||
|
% change year on year |
|
|
|
|
|
|
|
|
% change year on year |
|
|
|
|
|
|
|
|
|
||||
|
12 |
|
|
|
|
|
|
|
|
Forecast |
|
12 |
|
|
|
|
|
|
|
|
Forecast |
|
|
|
|
|
|
|
|
|
|
|
|
|
|
|
|
|
|
|
|
|
|
|
|||
|
|
|
|
|
|
|
|
|
|
|
|
|
|
|
|
|
|
|
|
|
|
||
economy |
10 |
|
|
|
|
|
|
|
|
|
|
|
|
|
|
|
|
|
|
|
|
|
|
|
|
|
|
|
|
|
|
|
|
|
10 |
|
|
|
|
|
|
|
|
|
|
|
|
8 |
|
|
|
|
|
|
|
|
|
|
|
|
|
|
|
|
|
|
|
|
|
|
|
|
|
|
|
|
|
|
|
|
|
|
|
|
|
|
|
|
|
|
|
|
|
|
|
Global |
6 |
|
|
|
|
|
|
|
|
|
|
8 |
|
|
|
|
|
|
|
|
|
|
|
4 |
|
|
|
|
|
|
|
|
|
|
|
|
|
|
|
|
|
|
|
|
|
|
|
|
|
|
|
|
|
|
|
|
|
|
|
|
|
|
|
|
|
|
|
|
|
|
|
|
|
|
|
|
|
|
|
|
|
|
|
6 |
|
|
|
|
|
|
|
|
|
|
|
|
2 |
|
|
|
|
|
|
|
|
|
|
|
|
|
|
|
|
|
|
|
|
|
|
|
0 |
|
|
|
|
|
|
|
|
|
|
4 |
|
|
|
|
|
|
|
|
|
|
|
|
-2 |
|
|
|
|
|
|
|
|
|
|
|
|
|
|
|
|
|
|
|
|
|
|
|
|
|
Commodity |
|
|
|
|
|
|
|
2 |
|
|
|
|
|
|
|
|
|
|
|
|
|
-4 |
|
countries |
|
|
|
|
|
|
|
|
|
|
|
|
|
|
|
|
|
|
|
|
|
|
|
|
|
|
|
|
|
|
|
|
|
Other EM |
|
|
|
|
|
|
|
|
|
|
|
|
|
Other EM |
|
|
|
|
|
|
|
|
|
|
|
|
|
|
|
|
|
|
|
|
|
|
|
|
|
|
|
|
|
|
|
|
|
countries |
|
|
|
|
|
|
|
|
|
|
|
-6 |
|
countries |
|
|
|
|
|
|
|
|
0 |
|
|
|
|
|
|
|
|
|
|
|
|
|
|
|
|
|
|
|
|
|
|
|
|
|
|
|
|
|
|
|
|
|||
|
|
|
|
|
|
|
|
|
|
|
|
|
|
|
|
|
|
|
|
|
|
||
|
'00 |
'02 |
'04 |
'06 |
'08 |
'10 |
'12 |
'14 |
'16 |
'18 |
'20 |
'00 |
'02 |
'04 |
'06 |
'08 |
'10 |
'12 |
'14 |
'16 |
'18 |
|
'20 |
Source: (All charts) IMF, national statistics agencies, J.P. Morgan Securities Research, J.P. Morgan Asset Management. Other EM countries are China, India, Malaysia, Mexico, Philippines, Poland, Romania, Thailand, Turkey, Vietnam. Commodity countries are Argentina, Brazil, Chile, Colombia, Indonesia, Kazakhstan, Peru, Russia, South Africa, Venezuela. GDP and inflation aggregates are calculated using a GDP-weighted average. Forecasts are from J.P. Morgan Securities Research. Past performance is not a reliable indicator of current and future results. Guide to the Markets - Europe. Data as of 30 June 2019.
42
vk.com/id446425943
Emerging markets currencies and current account |
GTM – Europe | 43 |
|
EM currencies vs. US dollar |
EM current account balance |
|
|
% from fair value, relative to US dollar |
|
|
|
% of GDP |
|
|
|
|
|
|
|
|
|
|
|
|
||||
|
30 |
|
|
|
|
|
|
1,2 |
|
|
|
|
|
|
|
|
|
|
|
|
|
|
|
|
EM currencies |
|
|
|
|
|
|
|
|
|
|
|
|
|
|
|
|
|
|
|
|
|
expensive |
|
|
|
|
|
|
|
|
|
|
|
|
|
|
|
|
|
|
economy |
20 |
|
relative to USD |
|
|
|
0,7 |
|
|
|
|
|
|
|
|
|
|
|
|
|
|
|
|
|
|
|
|
|
|
|
|
|
|
|
|
|
|
|
|
|
|||
|
|
|
|
|
|
|
|
|
|
|
|
|
|
|
|
|
|
|
|
||
|
|
|
|
|
|
+1 std. dev. |
0,2 |
|
|
|
|
|
|
|
|
|
|
|
|
|
|
Global |
10 |
|
|
|
|
|
|
|
|
|
|
|
|
|
|
|
|
|
|
|
|
|
|
|
|
|
|
|
-0,3 |
|
|
|
|
|
|
|
|
|
|
|
|
|
|
|
|
|
|
|
|
|
|
|
|
|
|
|
|
|
|
|
|
|
|
|
|
|
0 |
|
|
|
|
|
|
|
|
|
|
|
|
|
|
|
|
|
|
|
|
|
|
|
Average |
|
|
|
|
-0,8 |
|
|
|
|
|
|
|
|
|
|
|
|
|
|
|
|
|
|
|
|
|
|
|
|
|
|
|
|
|
|
|
|
|
|
|
|
-10 |
|
|
|
|
|
|
|
|
|
|
|
|
|
|
|
|
|
|
|
|
|
|
|
|
|
|
-1 std. dev. |
-1,3 |
|
|
|
|
|
|
|
|
|
|
|
|
|
|
|
|
|
|
|
|
|
|
|
|
|
|
|
|
|
|
|
|
|
|
||
|
-20 |
|
|
|
|
|
|
-1,8 |
|
|
|
|
|
|
|
|
|
|
|
|
|
|
|
|
|
|
|
|
|
|
|
|
|
|
|
|
|
|
|
|
|
|
|
|
-30 |
|
|
|
|
|
|
-2,3 |
|
|
|
|
|
|
|
|
|
|
|
|
|
|
'92 |
'96 |
'00 |
'04 |
'08 |
'12 |
'16 |
'06 |
'07 |
'08 |
'09 |
'10 |
'11 |
'12 |
'13 |
'14 |
'15 |
'16 |
'17 |
'18 |
'19 |
Source: (Left) J.P. Morgan Asset Management. Fair value is based on nominal exchange rates relative to PPP exchange rates and adjusted for GDP per capita. (Right) Bloomberg, J.P. Morgan Asset Management. EM currencies and current account balances are created using the current weighted average of JPM GBI-EM Global Diversified Index countries. Current account balance is the balance of a country’s net trade in goods and services, its net earnings on cross-border investments and its net transfer payments. Past performance is not a reliable indicator of current and future results. Guide to the Markets - Europe. Data as of 30 June 2019.
43
vk.com/id446425943
Global economy
Emerging markets structural dynamics |
GTM – Europe | 44 |
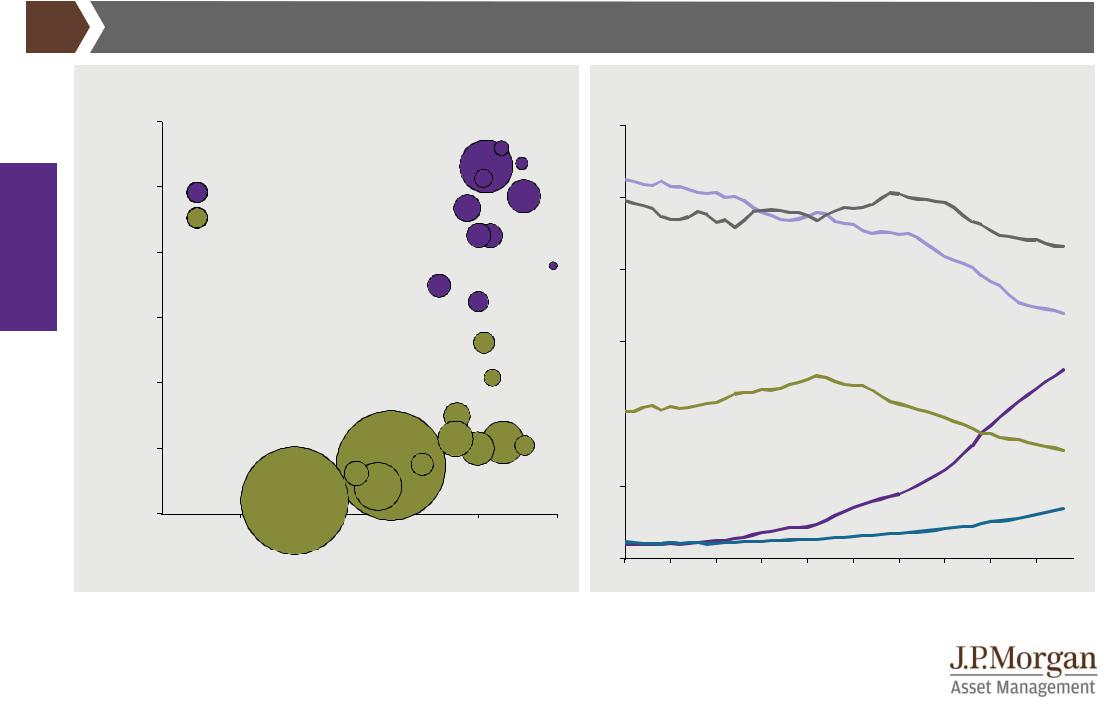
Urbanisation, real GDP per capita and population size |
Share of global real GDP |
Urbanisation rates, %, and GDP per capita, USD, bubble size is population |
% |
|
|
|
|
|
|
|
|
|
||||||||
|
60.000 |
|
|
|
|
|
|
AUS |
30 |
|
|
|
|
|
|
|
|
|
|
|
|
|
|
|
USA |
|
|
|
|
|
|
|
|
|
|
||
|
|
|
|
|
|
NLD |
|
|
|
|
|
|
|
|
|
|
||
|
|
|
|
|
|
|
|
|
|
|
|
|
|
|
|
|
|
|
|
50.000 |
Developed markets |
|
|
|
CAN |
|
|
|
|
|
|
|
|
|
|
||
|
|
|
|
|
JPN |
25 |
|
|
|
|
|
|
|
|
|
|||
|
|
|
DEU |
|
|
|
|
|
|
|
|
|
|
|
||||
|
|
Emerging markets |
|
|
|
|
|
|
|
|
|
|
|
|
|
|
||
|
|
|
|
|
|
|
|
|
|
|
|
|
|
|
|
US |
||
|
|
|
|
|
FRA |
|
|
GBR |
|
|
|
|
|
|
|
|
|
|
|
40.000 |
|
|
|
|
|
|
|
|
|
|
|
|
|
|
|
||
|
|
|
|
|
|
|
|
|
|
|
|
|
|
|
|
|
|
|
capita |
|
|
|
ITA |
|
|
HKG |
20 |
|
|
|
|
|
|
|
|
|
|
|
|
|
|
|
|
|
|
|
|
|
|
|
|
|
||||
30.000 |
|
|
|
|
|
ESP |
|
|
|
|
|
|
|
|
|
|
||
|
|
|
|
|
|
|
|
|
|
|
|
|
|
|
|
|||
per |
|
|
|
|
|
|
|
|
|
|
|
|
|
|
|
Eurozone |
||
|
|
|
|
|
|
|
|
|
|
|
|
|
|
|
|
|||
|
|
|
|
|
|
|
KOR |
15 |
|
|
|
|
|
|
|
|
|
|
GDP |
|
|
|
|
|
|
|
SAU |
|
|
|
|
|
|
|
|
|
China |
|
|
|
|
|
|
|
|
|
|
|
|
|
|
|
|
|
|
|
|
20.000 |
|
|
|
TUR |
|
|
|
|
|
|
|
|
|
|
|
|
|
|
|
|
|
|
|
|
|
|
|
|
|
|
|
|
|
|
|
|
|
|
|
|
|
|
|
|
|
10 |
|
|
|
|
|
|
|
|
|
|
|
|
CHN |
RUS |
BRA |
|
|
|
|
|
|
|
|
|
|
|||
|
10.000 |
|
|
|
|
ARG |
|
|
|
|
|
|
|
|
|
|
||
|
|
THA |
|
|
MEX |
|
|
|
|
|
|
|
|
|
Japan |
|||
|
|
|
|
|
|
|
|
|
|
|
|
|
|
|
|
|
||
|
|
|
|
|
|
|
|
|
|
|
|
|
|
|
|
|
|
|
|
|
|
IDN |
|
ZAF |
|
|
|
5 |
|
|
|
|
|
|
|
|
|
|
0 |
|
IND |
|
|
|
|
|
|
|
|
|
|
|
|
|
|
|
|
|
|
|
|
|
|
|
|
|
|
|
|
|
|
|
|
|
|
|
0 |
20 |
40 |
60 |
|
80 |
100 |
|
|
|
|
|
|
|
|
|
India |
|
|
0 |
|
|
|
|
|
|
|
|
|
|
|||||||
|
|
|
|
|
|
|
|
|
0 |
|
|
|
|
|
|
|
|
|
|
-10.000 |
|
Urbanisation rate |
|
|
|
'70 |
'75 |
'80 |
'85 |
'90 |
'95 |
'00 |
'05 |
'10 |
'15 |
||
Source: (Left) World Bank, J.P. Morgan Asset Management. Urbanisation rate refers to the proportion of the total population living within an urban area defined by national statistical offices. Countries are labelled using three-letter International Organisation of Standardisation country codes. (Right) Refinitiv Datastream, World Bank, J.P. Morgan Asset Management. Past performance is not a reliable indicator of current and future results. Guide to the Markets - Europe.
Data as of 30 June 2019.
44
vk.com/id446425943
Emerging markets focus: China stimulus |
GTM – Europe | 45 |
Global economy
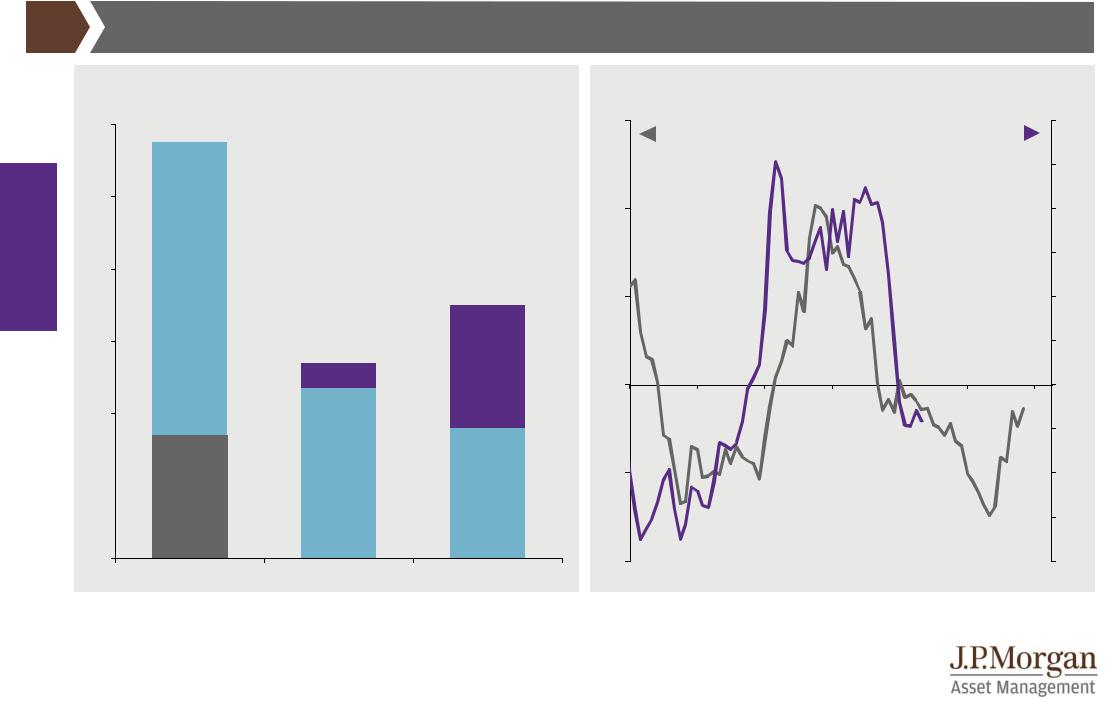
China stimulus
% of GDP 12
10
8
6
4
2
 Tax cuts
 Local government
 Central government
0
2008-2009 |
2015-2016 |
2018-2019 |
China broad credit impulse and imports
% of GDP (LHS); % change year on year, three-month moving average (RHS)
15 |
China broad credit impulse |
|
China imports |
30 |
||
|
|
|
||||
|
(advanced 18 months) |
|
|
|
||
|
|
|
|
|
||
|
|
|
|
|
|
25 |
10 |
|
|
|
|
|
20 |
|
|
|
|
|
|
15 |
5 |
|
|
|
|
|
10 |
|
|
|
|
|
|
5 |
0 |
|
|
|
|
|
0 |
|
|
|
|
|
|
-5 |
-5 |
|
|
|
|
|
-10 |
|
|
|
|
|
|
-15 |
-10 |
|
|
|
|
|
-20 |
'15 |
'16 |
'17 |
'18 |
'19 |
'20 |
'21 |
Source: (Left) Ministry of Finance of China, J.P. Morgan Securities Research, J.P. Morgan Asset Management. Central government spending is the incremental expenditure by the central government on infrastructure construction and subsidies to certain economic sectors. The spending is financed by tax revenue and issuance of treasury bonds. Local government spending is mostly composed of infrastructure investment conducted by local governments and their financing vehicles. These investments are mainly financed by bank loans, issuance of special local government bonds, policy bank loans and Private Public Partnership (PPP) projects. Tax cuts include cuts to VAT, personal income tax, corporate taxes and tariffs. (Right) China Customs, People’s Bank of China (PBoC), Refinitiv Datastream,
J.P. Morgan Asset Management. Broad credit impulse is the rate of change (using absolute 12-month changes) of annual broad credit as a % of GDP. Past 45 performance is not a reliable indicator of current and future results. Guide to the Markets - Europe. Data as of 30 June 2019.
vk.com/id446425943
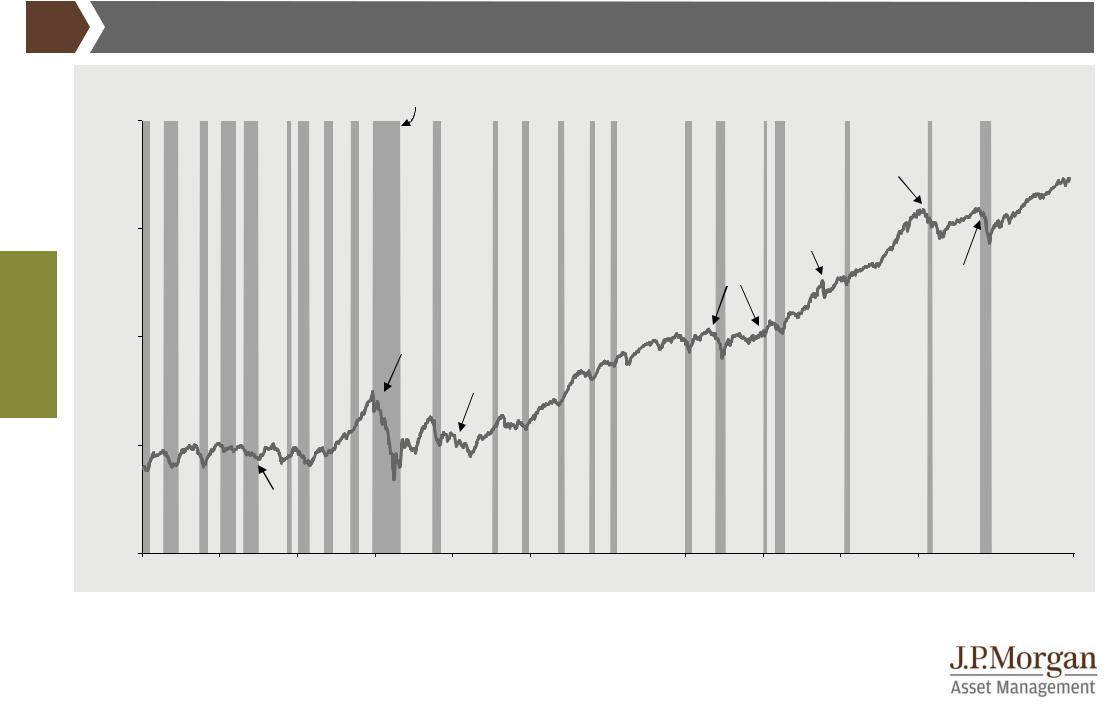
Equities
Global equity earnings and valuations |
GTM – Europe | 46 |
Global earnings per share
NTM EUR earnings per share estimates, rebased to 100 in Jan 2009 |
US |
|
290 |
||
|
240
Japan
190
EM
140
Europe
90
40
'09 |
'10 |
'11 |
'12 |
'13 |
'14 |
'15 |
'16 |
'17 |
'18 |
'19 |
Global forward price-to-earnings ratios
x, multiple 40x75
Current
35x
Range since 1990
Average since 1990
30x
25x
20x
15x
10x
5x
0x
US |
Europe |
UK |
Japan |
EM |
|
ex-UK |
|
|
|
Source: (Left) IBES, MSCI, Refinitiv Datastream, Standard & Poor’s, J.P. Morgan Asset Management. NTM is next 12 months. (Right) IBES, MSCI, Refinitiv Datastream, Standard & Poor’s, J.P. Morgan Asset Management. Earnings and valuation charts use MSCI indices for all regions/countries, except for the US, which is the S&P 500. EM is emerging markets. Past performance is not a reliable indicator of current and future results. Guide to the Markets - Europe.
Data as of 30 June 2019.
46
vk.com/id446425943 |
|
|
|
|
|
|
|
|
|
|
|
|
|
|
|
US stock market |
|
|
|
|
|
|
|
GTM – Europe |
| |
47 |
|||
|
S&P 500 Index |
|
|
Recession |
|
|
|
|
|
|
|
|
|
|
|
Log scale |
|
|
|
|
|
|
|
|
|
|
|
||
|
10.000 |
|
|
|
|
|
|
|
|
|
|
|
|
|
|
|
|
|
|
|
|
|
|
|
|
Tech |
|
|
|
|
|
|
|
|
|
|
|
|
|
|
bust (2000) |
|
|
|
|
|
|
|
|
|
|
|
|
|
Black |
|
|
|
|
|
1.000 |
|
|
|
|
|
|
|
|
Monday |
|
|
|
|
|
|
|
|
|
|
|
|
|
|
(1987) |
|
|
|
|
|
|
|
|
|
|
|
|
|
Oil shocks |
|
|
|
|
|
|
|
|
|
|
|
|
|
(1973 & 1979) |
|
Global financial |
|
|
||
|
|
|
|
|
|
|
|
|
|
|
|
|
||
Equities |
|
|
|
|
|
|
|
|
|
|
|
crisis (2008) |
|
|
|
|
|
Great |
|
|
|
|
|
|
|
|
|
|
|
100 |
|
|
Depression |
|
|
|
|
|
|
|
|
|
|
|
|
|
(1929-1939) |
|
|
|
|
|
|
|
|
|
|
||
|
|
|
|
|
|
|
|
|
|
|
|
|
||
|
|
|
|
World War II |
|
|
|
|
|
|
|
|
|
|
|
|
|
|
|
|
|
|
|
|
|
|
|
|
|
|
|
|
|
|
(1939-1945) |
|
|
|
|
|
|
|
|
|
|
10 |
|
|
|
|
|
|
|
|
|
|
|
|
|
|
|
|
World War I |
|
|
|
|
|
|
|
|
|
|
|
|
|
|
(1914-1918) |
|
|
|
|
|
|
|
|
|
|
|
|
1 |
|
|
|
|
|
|
|
|
|
|
|
|
|
|
1900' |
'10 |
'20 |
'30 |
'40 |
'50 |
'60 |
'70 |
'80 |
'90 |
'00 |
'10 |
|
|
Source: Refinitiv Datastream, Robert Shiller, Standard & Poor’s, J.P. Morgan Asset Management. Periods of “recession” are defined using US National Bureau of Economic Research (NBER) business cycle dates. Past performance is not a reliable indicator of current and future results. Guide to the Markets - Europe.
Data as of 30 June 2019.
47
vk.com/id446425943
US earnings |
GTM – Europe | 48 |
Equities
S&P 500 earnings and performance
Next 12 months’ earnings per share estimates (LHS); index level (RHS)
180 |
3.200 |
S&P 500 EPS |
S&P 500 index level |
|
3.000 |
160 |
2.800 |
|
|
|
2.600 |
140 |
2.400 |
|
|
|
2.200 |
2.000
120
1.800
|
|
|
|
|
|
|
|
|
|
|
|
|
1.600 |
|
100 |
|
|
|
|
|
|
|
|
|
|
|
|
1.400 |
|
|
|
|
|
|
|
|
|
|
|
|
|
|
||
|
|
|
|
|
|
|
|
|
|
|
|
|
1.200 |
|
80 |
|
|
|
|
|
|
|
|
|
|
|
|
1.000 |
|
|
|
|
|
|
|
|
|
|
|
|
|
|
||
|
|
|
|
|
|
|
|
|
|
|
|
|
800 |
|
60 |
|
|
|
|
|
|
|
|
|
|
|
|
|
600 |
|
|
|
|
|
|
|
|
|
|
|
|
|
||
'07 |
'08 |
'09 |
'10 |
'11 |
'12 |
'13 |
'14 |
'15 |
'16 |
'17 |
'18 |
'19 |
|
|
S&P 500 earnings per share growth
% change year on year
44  Start of year EPS growth expectations
Delivered EPS growth
36
 Current EPS growth expectations
28
20
11%
12
4 |
3% |
|
|
-4 |
|
|
-12
-20
-28
-36
'07 |
'08 |
'09 |
'10 |
'11 |
'12 |
'13 |
'14 |
'15 |
'16 |
'17 |
'18 |
'19 |
'20 |
Source: (All charts) IBES, Refinitiv Datastream, Standard & Poor’s, J.P. Morgan Asset Management. EPS is earnings per share. Expected earnings growth and delivered earnings growth are calculated using IBES consensus estimates for next 12 months’ EPS and last 12 months’ EPS, respectively. Year on year growth rates are calculated using year-end data. Past performance is not a reliable indicator of current and future results. Guide to the Markets - Europe. Data as of 30 June 2019.
48

vk.com/id446425943
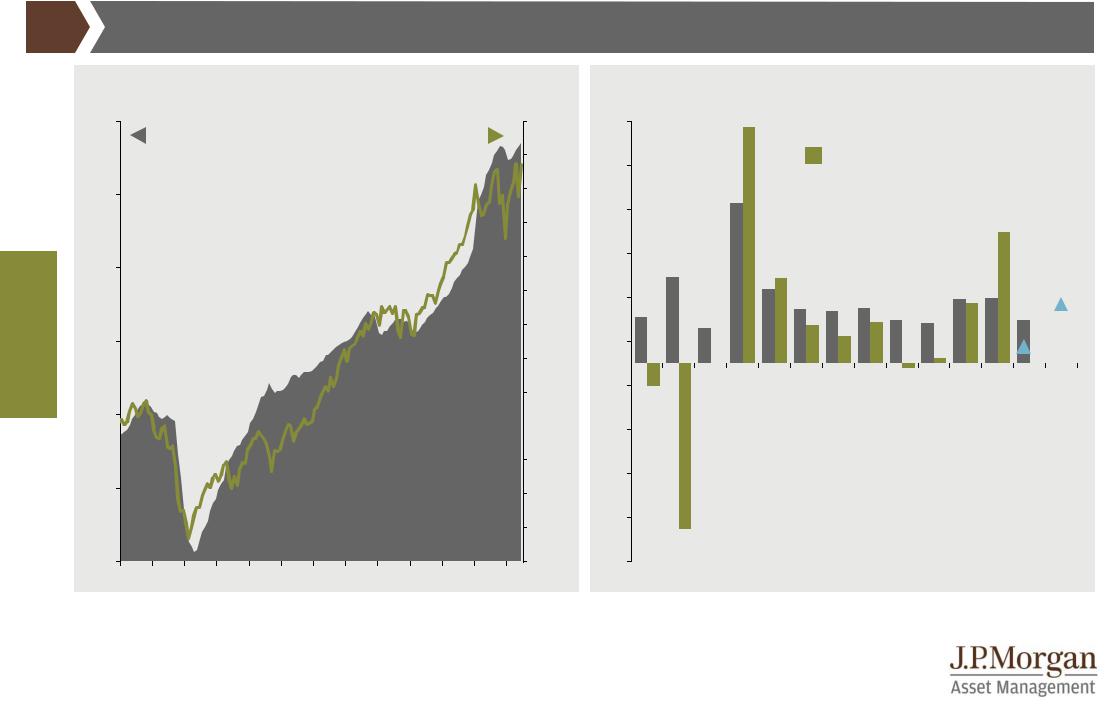
US equity macro correlations |
GTM – Europe | 49 |
Leading economic indicator vs. S&P 500 performance |
Initial jobless claims vs. S&P 500 performance |
|
Index level |
|
|
|
|
|
|
|
|
|
|
|
Index level (LHS); thousands, 12-week moving average (RHS) |
|
||||||||||
|
3.500 |
S&P 500 index level |
|
Leading economic |
115 |
3.000 |
S&P 500 index level |
|
Initial jobless claims |
700 |
||||||||||||||
|
|
|
|
|
|
|
|
|
indicator |
|
|
|
|
|
|
|
|
|
|
|||||
|
|
|
|
|
|
|
|
|
|
|
|
110 |
|
|
|
|
|
|
|
|
|
|
|
650 |
|
3.000 |
|
|
|
|
|
|
|
|
|
|
|
|
|
|
|
|
|
|
|
|
|
|
|
|
|
|
|
|
|
|
Recession |
|
|
|
2.500 |
|
|
|
|
|
|
|
|
|
|
|
||
|
|
|
|
|
|
|
|
|
|
|
|
|
|
|
|
|
|
|
|
|
600 |
|||
|
|
|
|
|
|
|
|
|
|
|
|
105 |
|
|
|
|
|
|
|
|
|
|
|
|
|
|
|
|
|
|
|
|
|
|
|
|
|
|
|
|
|
|
|
|
|
|
|
|
|
|
2.500 |
|
|
|
|
|
|
|
|
|
|
|
|
|
|
|
|
|
|
|
|
|
|
550 |
|
|
|
|
|
|
|
|
|
|
|
|
100 |
2.000 |
|
|
|
|
|
|
|
|
|
|
|
|
|
|
|
|
|
|
|
|
|
|
|
|
|
|
|
|
|
|
|
|
|
|
||
Equities |
2.000 |
|
|
|
|
|
|
|
|
|
|
|
|
|
|
|
|
|
|
|
|
|
|
500 |
|
|
|
|
|
|
|
|
|
|
95 |
|
|
|
|
|
|
|
|
|
|
|
|
||
|
|
|
|
|
|
|
|
|
|
|
|
|
|
|
|
|
|
|
|
|
|
|
||
|
|
|
|
|
|
|
|
|
|
|
|
1.500 |
|
|
|
|
|
|
|
|
|
|
450 |
|
|
|
|
|
|
|
|
|
|
|
|
90 |
|
|
|
|
|
|
|
|
|
|
|
|
|
|
1.500 |
|
|
|
|
|
|
|
|
|
|
|
|
|
|
|
|
|
|
|
|
|
|
|
|
|
|
|
|
|
|
|
|
|
|
|
|
|
|
|
|
|
|
|
|
|
|
400 |
|
|
|
|
|
|
|
|
|
|
|
|
|
|
|
|
|
|
|
|
|
|
|
|
|
|
|
|
|
|
|
|
|
|
|
|
|
|
85 |
1.000 |
|
|
|
|
|
|
|
|
|
|
350 |
|
1.000 |
|
|
|
|
|
|
|
|
|
|
|
|
|
|
|
|
|
|
|
|
|
|
|
|
|
|
|
|
|
|
|
|
|
|
|
|
|
|
|
|
|
|
|
|
|
|
|
|
|
|
|
|
|
|
|
|
|
|
|
|
80 |
|
|
|
|
|
|
|
|
|
|
|
300 |
|
|
|
|
|
|
|
|
|
|
|
|
|
500 |
|
|
|
|
|
|
|
|
|
|
|
|
500 |
|
|
|
|
|
|
|
|
|
|
|
|
|
|
|
|
|
|
|
|
|
|
|
|
|
|
|
|
|
|
|
|
|
|
75 |
|
|
|
|
|
|
|
|
|
|
|
|
|
|
|
|
|
|
|
|
|
|
|
|
|
|
|
|
|
|
|
|
|
|
|
|
250 |
|
|
|
|
|
|
|
|
|
|
|
|
|
|
|
|
|
|
|
|
|
|
|
|
|
|
|
0 |
|
|
|
|
|
|
|
|
|
|
70 |
0 |
|
|
|
|
|
|
|
|
|
|
200 |
|
'97 |
'99 |
'01 |
'03 |
'05 |
'07 |
'09 |
'11 |
'13 |
'15 |
'17 |
'19 |
'97 |
'99 |
'01 |
'03 |
'05 |
'07 |
'09 |
'11 |
'13 |
'15 |
'17 |
'19 |
Source: (Left) Conference Board, Refinitiv Datastream, Standard & Poor’s, J.P. Morgan Asset Management. (Right) BLS, Refinitiv Datastream, Standard & Poor’s, J.P. Morgan Asset Management. Periods of “recession” are defined using US National Bureau of Economic Research (NBER) business cycle dates. Past performance is not a reliable indicator of current and future results. Guide to the Markets - Europe. Data as of 30 June 2019.
49
vk.com/id446425943
Equities
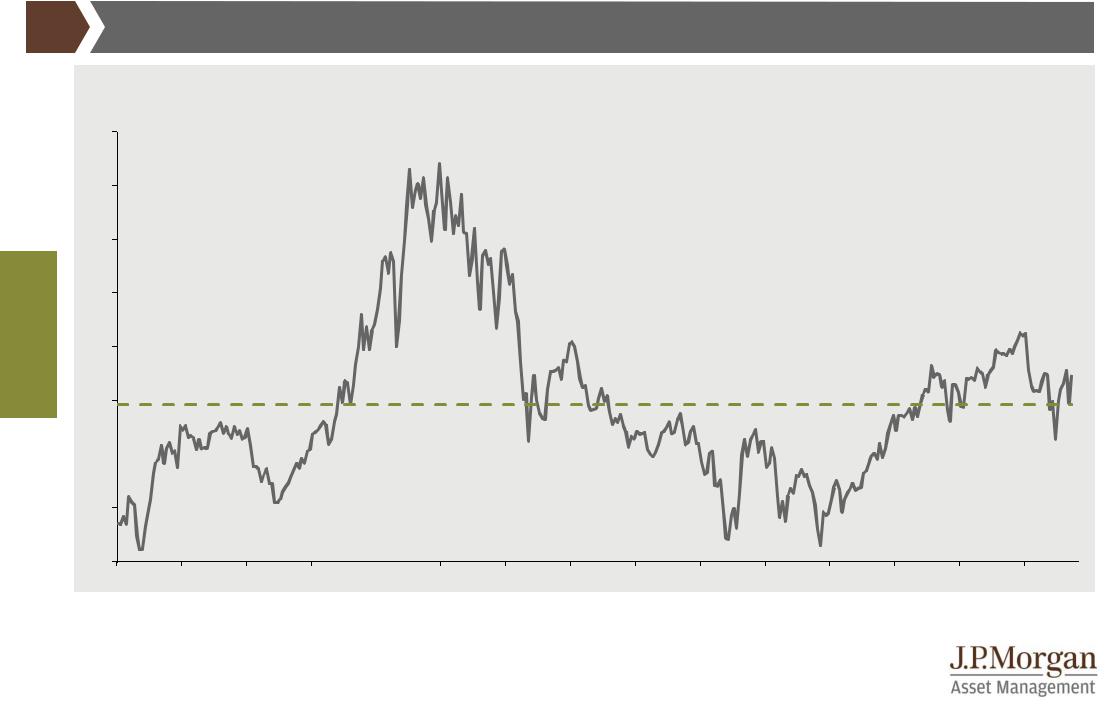
US equity valuations |
|
GTM – Europe | 50 |
||
S&P 500 forward P/E ratio |
|
|
|
|
x, multiple |
|
|
|
|
Valuation measure |
Average |
Latest |
|
|
|
since 1990 |
|
||
26 |
|
|
|
|
Shiller cyclically-adjusted P/E ratio |
25,8x |
30,2x |
|
|
|
|
|||
|
P/B ratio |
2,9x |
3,3x |
|
24 |
|
|
|
|
|
|
|
|
|
22
20
30 June 2019:
16,9x
18
16
Average: 15,8x
14
12
10
'90 |
'92 |
'94 |
'96 |
'98 |
'00 |
'02 |
'04 |
'06 |
'08 |
'10 |
'12 |
'14 |
'16 |
'18 |
Source: FactSet, IBES, Refinitiv Datastream, Robert Shiller, Standard & Poor’s, J.P. Morgan Asset Management. P/E ratio calculated using IBES earnings estimates for next 12 months. P/E data may differ from Guide to the Markets – US , which uses FactSet earnings estimates. Shiller cyclically-adjusted P/E is price-to-earnings ratio adjusted using trailing 10-year average inflation-adjusted earnings. P/B ratio is trailing price-to-book ratio. Past performance is not a reliable indicator of current and future results. Guide to the Markets - Europe. Data as of 30 June 2019.
50