

J.P. Morgan - Guide to the Markets_watermark
.pdfvk.com/id446425943
European politics
European parliament seat breakdown
% of seats |
|
|
|
|
|
|
||
|
|
Pro-Europe |
|
Moderately Eurosceptic |
|
Eurosceptic |
|
Other |
|
|
|
|
|
||||
100 |
|
|
|
|
|
|
||
economy |
90 |
|
|
|
|
|
|
|
|
|
|
Global |
80 |
|
|
|
|
70 |
|
|
|
|
|
|
|
|
|
|
|
|
60 |
|
|
|
|
|
50 |
|
|
|
|
|
|
|
|
|
|
|
40 |
|
|
|
|
|
30 |
|
|
|
|
|
20 |
|
|
|
|
|
10 |
|
|
|
|
|
0 |
|
|
|
|
|
|
|
|
|
|
|
2004 |
2009 |
2014 |
2019 |
|
GTM – Europe | 31
Survey results: Do you support the euro?
% answering “yes”
85 |
|
|
|
|
80 |
Nov ’13 |
|
|
|
Nov ’17 |
|
|
|
|
|
|
|
|
|
75 |
Nov ’18 |
|
|
|
|
|
|
|
|
70 |
|
|
|
|
65 |
|
|
|
|
60 |
|
|
|
|
55 |
|
|
|
|
50 |
|
|
|
|
45 |
|
|
|
|
40 |
Italy |
France |
Spain |
Germany |
|
Source: (Left) European Parliament, J.P. Morgan Asset Management. Pro-Europe includes EPP: European People's Party, Renew Europe, Greens/EFA: The Greens/European Free Alliance, S&D: Group of the Progressive Alliance of Socialists and Democrats in the European Parliament. Moderately Eurosceptic includes GUE/NGL: European United Left-Nordic Green Left. Eurosceptic includes ID: Identity and Democracy, EFDD: Europe of Nations and Freedom, ECR: European Conservatives and Reformists. (Right) Eurobarometer survey, J.P. Morgan Asset Management. Past performance is not a reliable indicator of current and future results. Guide to the Markets - Europe. Data as of 30 June 2019.
31
vk.com/id446425943
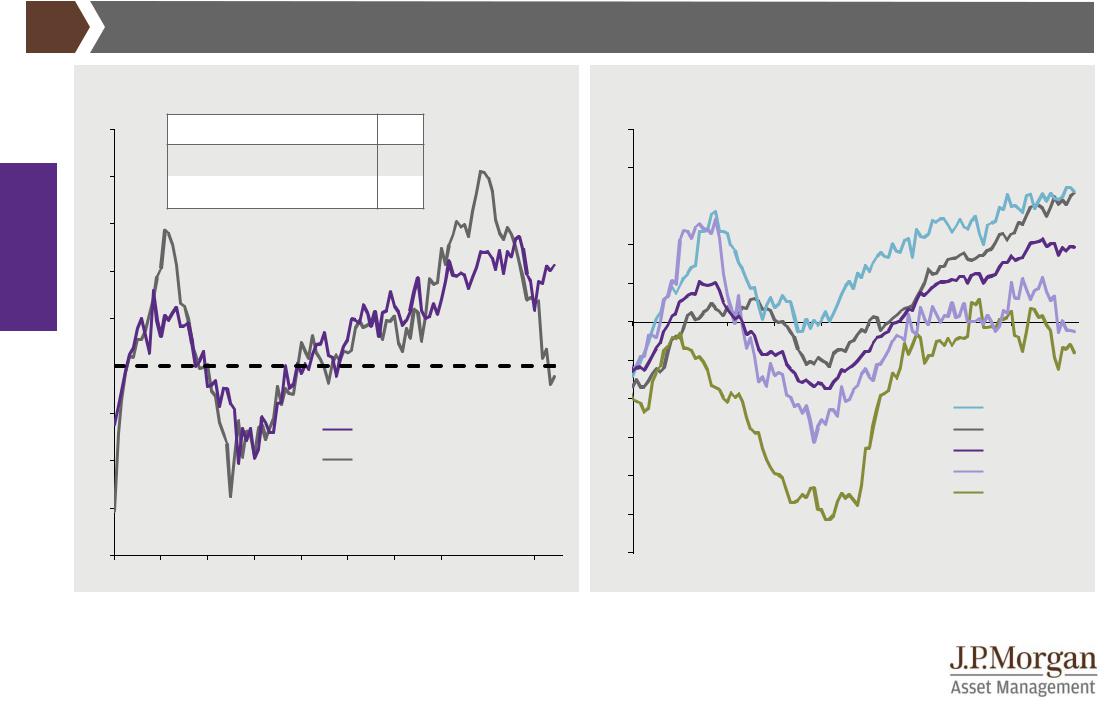
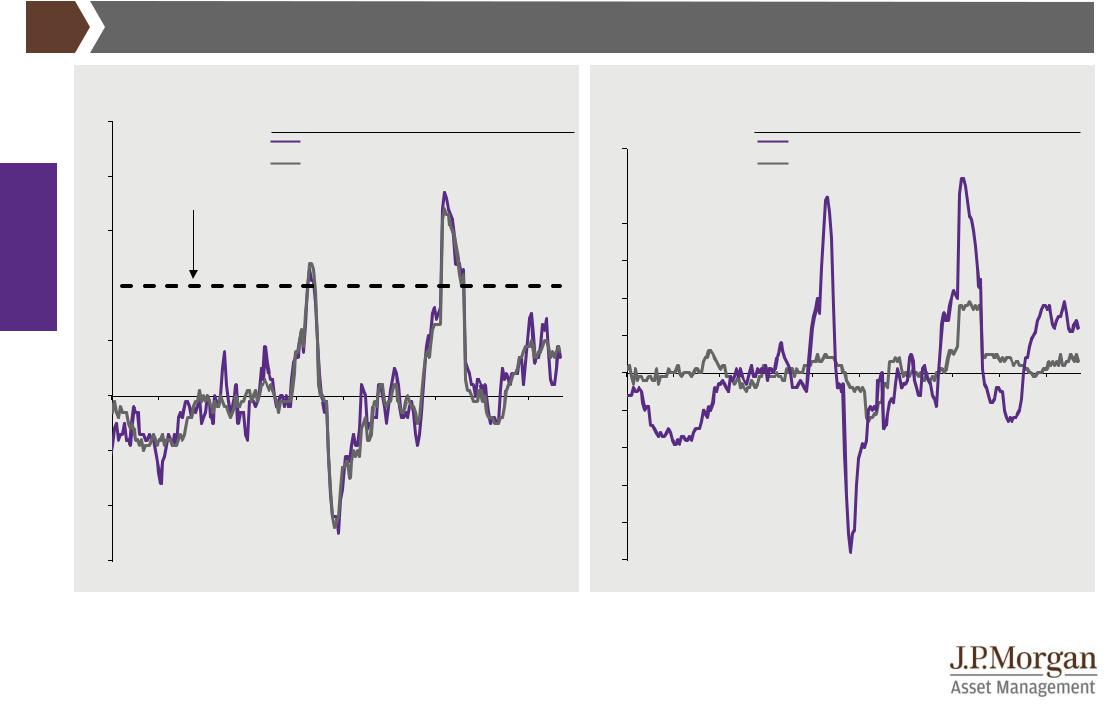
Eurozone focus: Employment and loan growth |
GTM – Europe | 32 |
|
Eurozone PMI: Employment |
Eurozone loan growth to non-financial corporates |
|
|
Index level |
|
|
|
|
|
|
|
|
|
% change year on year |
|
|
|
|
|
|
|
||
|
60 |
|
Share of total employment |
|
|
|
10 |
|
|
|
|
|
|
|
|
|
||||
|
58 |
|
Services |
|
|
|
76% |
|
|
|
8 |
|
|
|
|
|
|
|
|
|
|
|
|
|
|
|
|
|
|
|
|
|
|
|
|
|
|
|
|
||
economy |
|
|
|
|
|
|
|
|
|
|
|
|
|
|
|
|
|
|
|
|
|
|
Manufacturing |
|
|
14% |
|
|
|
6 |
|
|
|
|
|
|
|
|
|
||
|
|
|
|
|
|
|
|
|
|
|
|
|
|
|
|
|
||||
|
|
|
|
|
|
|
|
|
|
|
|
|
|
|
|
|
|
|
|
|
|
56 |
|
|
|
|
|
|
|
|
|
|
|
|
|
|
|
|
|
|
|
Global |
|
|
|
|
|
|
|
|
|
|
4 |
|
|
|
|
|
|
|
|
|
54 |
|
|
|
|
|
|
|
|
|
2 |
|
|
|
|
|
|
|
|
|
|
|
|
|
|
|
|
|
|
|
|
|
|
|
|
|
|
|
|
|
||
|
|
|
|
|
|
|
|
|
|
|
|
|
|
|
|
|
|
|
|
|
|
52 |
|
|
|
|
|
|
|
|
|
0 |
|
|
|
|
|
|
|
|
|
|
50 |
|
|
|
|
|
|
|
|
|
-2 |
|
|
|
|
|
|
|
|
|
|
|
|
|
|
|
|
|
|
|
|
|
|
|
|
|
|
|
|
|
|
|
48 |
|
|
|
|
|
|
|
|
|
-4 |
|
|
|
|
|
|
|
France |
|
|
|
|
|
|
|
|
|
|
|
|
|
|
|
|
|
|
|
|
||
|
|
|
|
|
|
Services: Employment |
|
|
|
|
|
|
|
|
|
Germany |
||||
|
|
|
|
|
|
|
|
-6 |
|
|
|
|
|
|
|
|||||
|
|
|
|
|
|
|
|
|
|
|
|
|
|
|
|
|
|
Eurozone |
||
|
46 |
|
|
|
|
|
Manufacturing: Employment |
|
|
|
|
|
|
|
|
|||||
|
|
|
|
|
|
-8 |
|
|
|
|
|
|
|
Italy |
|
|||||
|
|
|
|
|
|
|
|
|
|
|
|
|
|
|
|
|
|
|
||
|
44 |
|
|
|
|
|
|
|
|
|
|
|
|
|
|
|
|
|
Spain |
|
|
|
|
|
|
|
|
|
|
|
-10 |
|
|
|
|
|
|
|
|
|
|
|
|
|
|
|
|
|
|
|
|
|
|
|
|
|
|
|
|
|
|
|
|
42 |
|
|
|
|
|
|
|
|
|
-12 |
|
|
|
|
|
|
|
|
|
|
'10 |
'11 |
'12 |
'13 |
'14 |
'15 |
'16 |
'17 |
'18 |
'19 |
'10 |
'11 |
'12 |
'13 |
'14 |
'15 |
'16 |
'17 |
'18 |
'19 |
Source: (Left) Markit, J.P. Morgan Asset Management. PMI is Purchasing Managers’ Index where a score of 50 indicates that economic activity is neither expanding nor contracting, above 50 indicates expansion. 10% of total eurozone employment is accounted for by other industries, mainly comprising of construction and agriculture. (Right) ECB, J.P. Morgan Asset Management. Loan growth measure is adjusted to reflect loans that have been sold or securitised and are no longer reported on banks’ balance sheets. Past performance is not a reliable indicator of current and future results. Guide to the Markets - Europe. Data as of 30 June 2019.
32
vk.com/id446425943
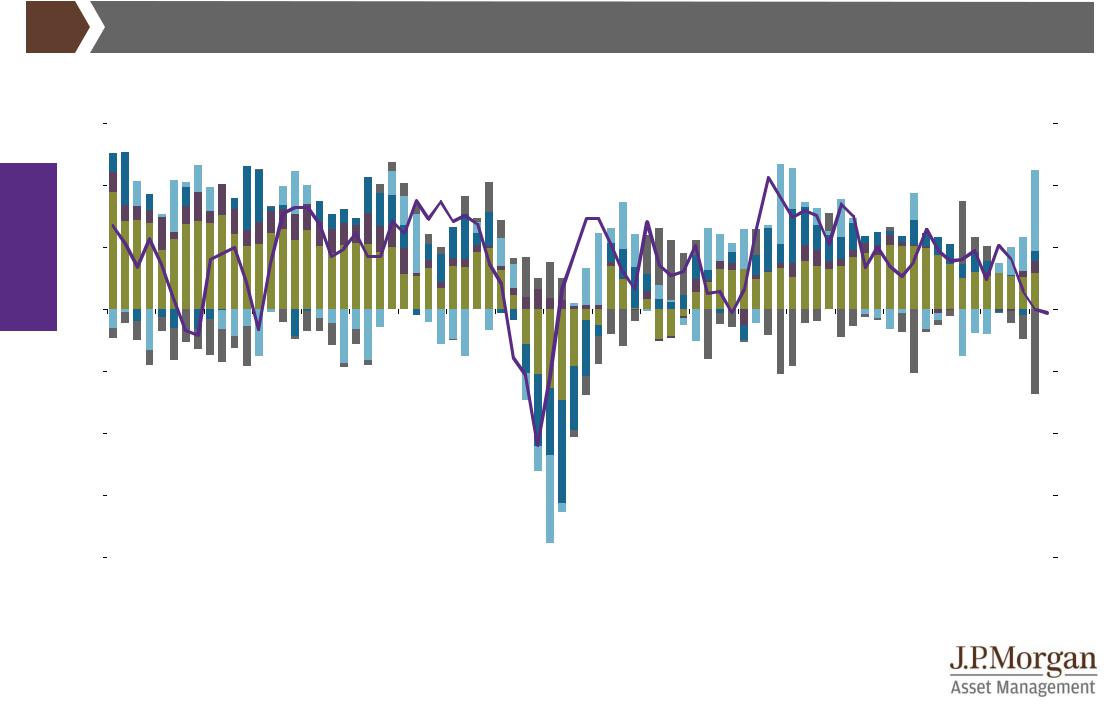
Global economy
|
|
|
UK GDP |
|
|
|
|
|
|
|
|
|
|
|
|
|
|
|
|
|
GTM – Europe |
| 33 |
|||||
|
|
|
|
|
|
|
|
|
|
|
|
|
|
|
|
|
|
|
|
||||||||
Contribution to UK real GDP growth and composite PMI |
|
|
|
|
|
|
|
|
|
|
|
|
|
|
|
||||||||||||
% change year on year (LHS); index level (RHS) |
|
|
|
|
|
|
|
|
|
|
|
|
|
|
|
|
|
|
|||||||||
6 |
|
|
|
|
|
|
|
|
|
|
|
|
|
|
|
|
|
|
|
|
|
|
|
|
|
65 |
|
|
|
|
|
|
|
|
|
|
|
|
|
|
|
|
|
|
|
|
|
|
|
|
|||||
4 |
|
|
|
|
|
|
|
|
|
|
|
|
|
|
|
|
|
|
|
|
|
|
|
|
|
60 |
|
2 |
|
|
|
|
|
|
|
|
|
|
|
|
|
|
|
|
|
|
|
|
|
|
|
|
|
55 |
|
0 |
|
|
|
|
|
|
|
|
|
|
|
|
|
|
|
|
|
|
|
|
|
|
|
|
|
50 |
|
|
|
|
|
|
|
|
|
|
|
|
|
|
|
|
|
|
|
|
|
|
|
|
|
|
|
||
-2 |
|
|
|
|
|
|
|
|
|
|
|
|
|
|
|
|
|
|
|
|
|
|
|
|
|
45 |
|
|
|
|
|
|
|
|
|
|
Net exports |
|
|
|
|
|
|
|
|
|
|
|
|
|
|
|
|
|
|
|
|
|
|
|
|
|
|
|
|
|
|
|
|
|
|
|
|
|
|
|
|
|
|
|
|||
-4 |
|
|
|
|
|
|
|
|
Change in inventories |
|
|
|
|
|
|
|
|
|
|
|
|
|
|
|
40 |
||
|
|
|
|
|
|
|
|
|
|
|
|
|
|
|
|
|
|
|
|
|
|
||||||
|
|
|
|
|
|
|
|
|
|
|
|
|
|
|
|
|
|||||||||||
|
|
|
|
|
|
|
|
|
Investment |
|
|
|
|
|
|
|
|
|
|
|
|
|
|
|
|
|
|
|
|
|
|
|
|
|
|
|
Government |
|
|
|
|
|
|
|
|
|
|
|
Average |
1Q19 |
|
|
|
|
|
|
|
|
|
|
|
|
|
|
|
|
|
|
|
|
|
|
|
|
|
|
|
|
|
||||
-6 |
|
|
|
|
|
|
|
|
|
|
|
|
|
|
|
|
|
|
|
since 2000 |
|
|
|
35 |
|||
|
|
|
|
|
|
|
|
Consumption |
|
|
|
|
|
|
|
|
|
|
|
|
|
|
|
||||
|
|
|
|
|
|
|
|
|
|
|
|
|
|
|
|
|
|
|
|
|
|
|
|
||||
|
|
|
|
|
|
|
|
|
|
|
|
|
|
|
|
|
|
|
|
1,9% |
1,8% |
|
|
|
|
||
-8 |
|
|
|
|
|
|
|
|
Composite PMI (RHS) |
|
|
|
|
|
|
|
|
|
|
|
|
|
30 |
||||
|
|
|
|
|
|
|
|
|
|
|
|
|
|
|
|
|
|
|
|
|
|
|
|||||
|
|
|
|
|
|
|
|
|
|
|
|
|
|
|
|
|
|
|
|
|
|
|
|||||
|
|
|
|
|
|
|
|
|
|
|
|
|
|
|
|
|
|
|
|
|
|
|
|
|
|||
|
|
|
|
|
|
|
|
|
|
|
|
|
|
|
|
|
|
|
|
|
|
|
|||||
'00 |
'01 |
'02 |
'03 |
'04 |
'05 |
'06 |
'07 |
'08 |
'09 |
'10 |
'11 |
'12 |
'13 |
'14 |
'15 |
'16 |
'17 |
'18 |
'19 |
|
|
||||||
|
|
|
|
|
|
|
|
|
|
|
|
|
|
|
|
|
|
|
|
|
|
|
|
|
|
|
|
Source: Markit, ONS, Refinitiv Datastream, J.P. Morgan Asset Management. PMI is Purchasing Managers’ Index where a score of 50 indicates that economic activity is neither expanding nor contracting, above 50 indicates expansion. PMI data is shown with quarterly frequency. Past performance is not a reliable indicator of current and future results. Guide to the Markets - Europe. Data as of 30 June 2019.
33
vk.com/id446425943
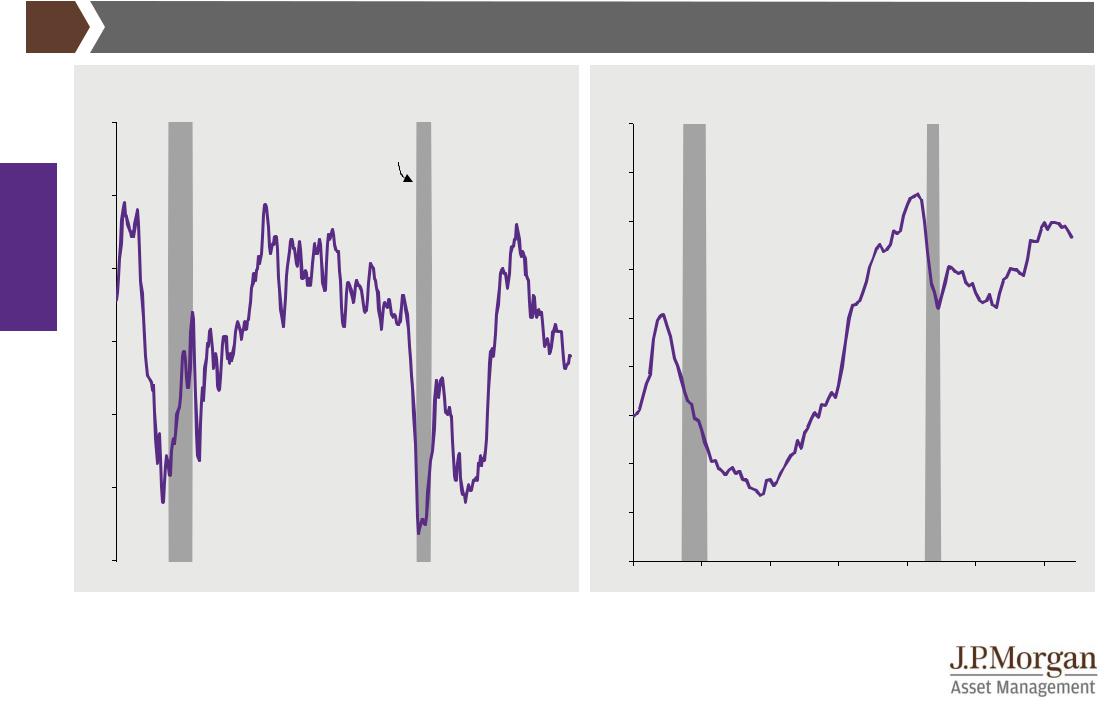
Global economy
UK consumer |
GTM – Europe | 34 |
UK consumer confidence |
UK house prices relative to income |
Index level, three-month moving average |
|
|
|
Index level |
|
|
|
|
|
|
|||
20 |
|
|
|
|
|
|
130 |
|
|
|
|
|
|
|
|
|
|
Recession |
|
|
|
|
|
|
|
|
|
|
|
|
|
|
|
|
120 |
|
|
|
|
|
|
10 |
|
|
|
|
|
|
|
|
|
|
|
|
|
|
|
|
|
|
|
|
110 |
|
|
|
|
|
|
0 |
|
|
|
|
|
|
100 |
|
|
|
|
|
|
|
|
|
|
|
|
|
90 |
|
|
|
|
|
|
-10 |
|
|
|
|
|
|
|
|
|
|
|
|
|
|
|
|
|
|
|
|
80 |
|
|
|
|
|
|
-20 |
|
|
|
|
|
|
70 |
|
|
|
|
|
|
|
|
|
|
|
|
|
60 |
|
|
|
|
|
|
-30 |
|
|
|
|
|
|
|
|
|
|
|
|
|
|
|
|
|
|
|
|
50 |
|
|
|
|
|
|
-40 |
|
|
|
|
|
|
40 |
|
|
|
|
|
|
'87 |
'92 |
'97 |
'02 |
'07 |
'12 |
'17 |
'87 |
'92 |
'97 |
'02 |
'07 |
'12 |
'17 |
Source: (Left) GfK, Refinitiv Datastream, J.P. Morgan Asset Management. (Right) OECD, Refinitiv Datastream, J.P. Morgan Asset Management. Light grey columns indicate recession. Past performance is not a reliable indicator of current and future results. Guide to the Markets - Europe. Data as of 30 June 2019.
34

vk.com/id446425943
UK inflation
UK headline and core inflation
|
% change year on year |
|
|
|
|
Average |
May |
|||
|
6 |
|
|
|
|
|
|
since 2000 |
2019 |
|
|
|
|
|
|
Headline CPI |
2,1% |
|
2,0% |
||
|
|
|
|
|
|
|
||||
|
|
|
|
|
|
Core CPI |
|
1,7% |
|
1,7% |
economy |
5 |
|
|
|
|
|
|
|
|
|
4 |
|
|
|
|
|
|
|
|
|
|
Global |
|
|
|
|
|
|
|
|
|
|
|
Headline inflation |
|
|
|
|
|
|
|||
|
|
target |
|
|
|
|
|
|
|
|
3 |
|
|
|
|
|
|
|
|
|
|
|
|
|
|
|
|
|
|
|
|
|
|
2 |
|
|
|
|
|
|
|
|
|
|
1 |
|
|
|
|
|
|
|
|
|
|
0 |
|
|
|
|
|
|
|
|
|
|
-1 |
|
|
|
|
|
|
|
|
|
|
'00 |
'02 |
'04 |
'06 |
'08 |
'10 |
'12 |
'14 |
'16 |
'18 |
GTM – Europe | 35
UK core goods and services inflation
% change year on year |
|
|
|
|
Average |
May |
|||
6 |
|
|
|
|
|
|
since 2000 |
2019 |
|
|
|
|
Services CPI |
3,3% |
|
2,6% |
|||
|
|
|
|
|
|||||
|
|
|
|
Core goods CPI |
-0,7% |
|
0,4% |
||
4 |
|
|
|
|
|
|
|
|
|
2 |
|
|
|
|
|
|
|
|
|
0 |
|
|
|
|
|
|
|
|
|
-2 |
|
|
|
|
|
|
|
|
|
-4 |
|
|
|
|
|
|
|
|
|
-6 |
|
|
|
|
|
|
|
|
|
'00 |
'02 |
'04 |
'06 |
'08 |
'10 |
'12 |
'14 |
'16 |
'18 |
Source: (All charts) ONS, Refinitiv Datastream, J.P. Morgan Asset Management. CPI is the Consumer Price Index. Core CPI is defined as CPI less energy, food, alcohol and tobacco. Core goods CPI is defined as goods CPI less energy, food, alcohol and tobacco. Past performance is not a reliable indicator of current and future results. Guide to the Markets - Europe. Data as of 30 June 2019.
35

vk.com/id446425943
UK focus: Brexit
|
|
|
No- |
Customs |
Single |
|
|
|
deal |
union |
market |
|
|
|
|
|
|
|
|
Control of migration |
|
|
|
|
|
|
|
||
economy |
|
|
|
|
|
|
‘Sovereignty’ |
|
|
|
|
|
|
No budget payments to |
|
|
|
|
|
EU |
|
|
|
Global |
|
|
|
|
|
- Ability to set broader |
|
|
|
||
|
|
laws |
|
|
|
|
|
- Ability to set goods |
|
|
|
|
|
regulations |
|
|
|
|
|
|
|
|
|
|
|
|
|
|
|
|
|
Ability to negotiate trade |
|
~ |
|
|
|
deals |
|
||
|
|
|
|
|
|
|
|
Resolves Northern Ireland |
|
|
|
|
|
border/Union risk |
|
||
|
|
|
|
|
|
|
|
|
|
|
|
|
|
Preserve current supply |
|
|
|
|
|
chain and economic links |
|
||
|
|
|
|
|
|
|
|
|
|
|
|
GTM – Europe | 36
What Brexit outcome would you prefer to see?
% of respondents
40
35
35
30
30
25
20
16
15
|
10 |
10 |
9 |
5
0
No-deal |
This deal Single market Remain |
Not sure |
Source: (Left) J.P. Morgan Asset Management. (Right) YouGov, J.P. Morgan Asset Management. Survey fieldwork was carried out on 10-11 April 2019. Past performance is not a reliable indicator of current and future results. Guide to the Markets - Europe. Data as of 30 June 2019.
36
vk.com/id446425943
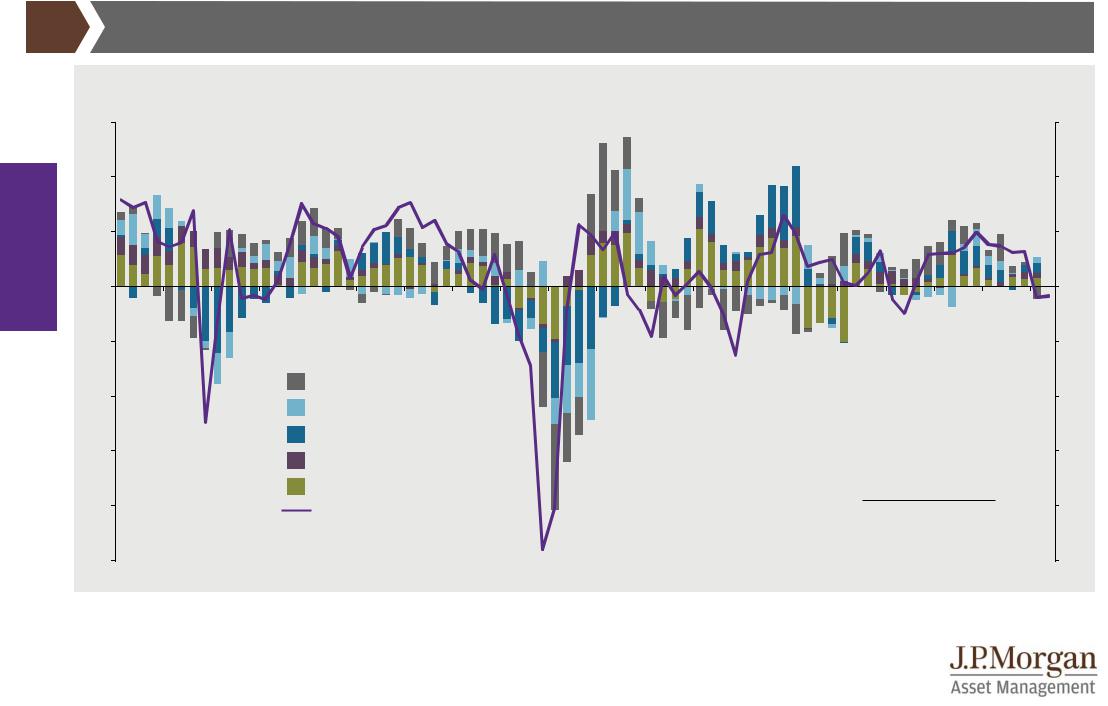
Japan GDP |
GTM – Europe | 37 |
Contribution to Japan real GDP growth and composite PMI
|
% change year on year (LHS); index level (RHS) |
|
|
|
|
|
|
|
|
|
|
|
|
|
|
|||||
|
6 |
|
|
|
|
|
|
|
|
|
|
|
|
|
|
|
|
|
|
62 |
economy |
4 |
|
|
|
|
|
|
|
|
|
|
|
|
|
|
|
|
|
|
58 |
2 |
|
|
|
|
|
|
|
|
|
|
|
|
|
|
|
|
|
|
54 |
|
|
|
|
|
|
|
|
|
|
|
|
|
|
|
|
|
|
|
|
|
|
Global |
0 |
|
|
|
|
|
|
|
|
|
|
|
|
|
|
|
|
|
|
50 |
|
|
|
|
|
|
|
|
|
|
|
|
|
|
|
|
|
|
|
|
|
|
-2 |
|
|
|
|
|
|
|
|
|
|
|
|
|
|
|
|
|
|
46 |
|
-4 |
|
|
|
Net exports |
|
|
|
|
|
|
|
|
|
|
|
|
|
42 |
|
|
|
|
|
Change in inventories |
|
|
|
|
|
|
|
|
|
|
|
|||||
|
|
|
|
|
|
|
|
|
|
|
|
|
|
|
|
|
||||
|
-6 |
|
|
|
Investment |
|
|
|
|
|
|
|
|
|
|
|
|
|
38 |
|
|
|
|
|
Government |
|
|
|
|
|
|
|
|
|
|
|
|
|
|||
|
|
|
|
|
|
|
|
|
|
|
|
|
|
|
Average |
|
|
|||
|
|
|
|
|
Consumption |
|
|
|
|
|
|
|
|
|
1Q19 |
|
||||
|
|
|
|
|
|
|
|
|
|
|
|
|
|
since 2000 |
|
|||||
|
|
|
|
|
|
|
|
|
|
|
|
|
|
|
|
|||||
|
-8 |
|
|
|
Manufacturing PMI (RHS) |
|
|
|
|
|
|
|
|
0,9% |
|
0,9% |
34 |
|||
|
|
|
|
|
|
|
|
|
|
|
|
|
|
|
||||||
|
-10 |
|
|
|
|
|
|
|
|
|
|
|
|
|
|
|
|
|
|
30 |
|
'00 |
'01 |
'02 |
'03 |
'04 |
'05 |
'06 |
'07 |
'08 |
'09 |
'10 |
'11 |
'12 |
'13 |
'14 |
'15 |
'16 |
'17 |
'18 |
'19 |
Source: Japan Cabinet Office, Markit, Refinitiv Datastream, J.P. Morgan Asset Management. PMI is Purchasing Managers’ Index where a score of 50 indicates that economic activity is neither expanding nor contracting, above 50 indicates expansion. PMI data is shown with quarterly frequency. Past performance is not a reliable indicator of current and future results. Guide to the Markets - Europe. Data as of 30 June 2019.
37
vk.com/id446425943
Japan inflation |
GTM – Europe | 38 |
Japan headline and core inflation
|
% change year on year |
|
|
|
|
Average |
May |
|||
|
5 |
|
|
|
|
|
|
since 2000 |
2019 |
|
|
|
|
|
|
|
Headline CPI |
0,1% |
0,7% |
||
|
4 |
Headline inflation |
|
Core CPI |
|
0,1% |
0,8% |
|||
economy |
|
|
|
|
|
|
||||
|
|
target |
|
|
|
|
|
|
|
|
3 |
|
|
|
|
|
|
|
|
|
|
|
|
|
|
|
|
|
|
|
|
|
Global |
2 |
|
|
|
|
|
|
|
|
|
|
|
|
|
|
|
|
|
|
|
|
|
1 |
|
|
|
|
|
|
|
|
|
|
0 |
|
|
|
|
|
|
|
|
|
|
-1 |
|
|
|
|
|
|
|
|
|
|
-2 |
|
|
|
|
|
|
|
|
|
|
-3 |
|
|
|
|
|
|
|
|
|
|
'00 |
'02 |
'04 |
'06 |
'08 |
'10 |
'12 |
'14 |
'16 |
'18 |
Japan core goods and services inflation
% change year on year |
Average |
May |
|
since 2000 |
2019 |
6 |
|
|
|
Core goods CPI |
0,0% |
|
1,2% |
||
|
|
|
Services CPI |
|
0,1% |
|
0,3% |
||
|
|
|
|
|
|
||||
5 |
|
|
|
|
|
|
|
|
|
4 |
|
|
|
|
|
|
|
|
|
3 |
|
|
|
|
|
|
|
|
|
2 |
|
|
|
|
|
|
|
|
|
1 |
|
|
|
|
|
|
|
|
|
0 |
|
|
|
|
|
|
|
|
|
-1 |
|
|
|
|
|
|
|
|
|
-2 |
|
|
|
|
|
|
|
|
|
-3 |
|
|
|
|
|
|
|
|
|
-4 |
|
|
|
|
|
|
|
|
|
-5 |
|
|
|
|
|
|
|
|
|
'00 |
'02 |
'04 |
'06 |
'08 |
'10 |
'12 |
'14 |
'16 |
'18 |
Source: (All charts) Japan Ministry of Internal Affairs & Communications, Refinitiv Datastream, J.P. Morgan Asset Management. CPI is the Consumer Price Index. Core CPI is defined as CPI excluding fresh food. Core goods CPI is defined as goods CPI excluding fresh food. Increase in Japan inflation measures between 2014 and 2016 can be attributed to the impact of the consumption tax hike over this period. Past performance is not a reliable indicator of current and future results.
Guide to the Markets - Europe. Data as of 30 June 2019.
38

vk.com/id446425943
China GDP |
GTM – Europe | 39 |
|
Contribution to China real GDP growth |
1Q 2019 |
2019 |
China industrial production and retail sales |
|
||||||||||||||||
|
% change year on year |
|
|
|
|
|
|
consensus |
% change year on year |
|
|
|
|
||||||||
|
|
|
|
|
|
|
|
|
|
forecast |
|
|
|
|
|||||||
|
20 |
|
|
|
|
|
|
|
|
|
|
|
|
25 |
|
|
|
|
|
||
|
|
|
|
|
|
|
GDP growth |
6,4% |
|
6,2% |
|
|
|
|
|
||||||
|
|
|
|
|
|
|
|
|
|
|
|
|
|
|
|||||||
economy |
|
|
|
|
|
|
|
Investment |
|
|
|
|
|
|
|
|
|
|
|
||
|
|
|
|
|
|
|
Consumption |
|
|
|
|
|
|
|
|
|
|
||||
|
|
|
|
|
|
|
|
|
|
|
|
|
|
|
|
|
|
||||
|
15 |
|
|
|
|
|
|
Net exports |
|
|
|
|
|
20 |
|
|
|
|
|
||
Global |
10 |
|
|
|
|
|
|
|
|
|
|
|
|
|
|
15 |
|
|
|
|
|
|
|
|
|
|
|
|
|
|
|
|
|
|
|
|
|
|
|
|
|
||
|
|
|
|
|
|
|
|
|
|
|
|
|
|
|
|
|
|
|
|
|
Retail sales |
|
5 |
|
|
|
|
|
|
|
|
|
|
|
|
|
|
10 |
|
|
|
|
|
|
0 |
|
|
|
|
|
|
|
|
|
|
|
|
|
|
5 |
|
|
|
Industrial production |
|
|
|
|
|
|
|
|
|
|
|
|
|
|
|
|
|
|
|
|
|
||
|
-5 |
|
|
|
|
|
|
|
|
|
|
|
|
|
|
0 |
|
|
|
|
|
|
'90 |
'92 |
'94 |
'96 |
'98 |
'00 |
'02 |
'04 |
'06 |
'08 |
'10 |
'12 |
'14 |
'16 |
'18 |
'96 |
'00 |
'04 |
'08 |
'12 |
'16 |
Source: (Left) Bloomberg, National Bureau of Statistics of China, Refinitiv Datastream, J.P. Morgan Asset Management. Forecast is from Bloomberg contributor composite. (Right) National Bureau of Statistics of China, Refinitiv Datastream, J.P. Morgan Asset Management. Industrial production is a three-month moving average and retail sales is a six-month moving average. Past performance is not a reliable indicator of current and future results. Guide to the Markets - Europe. Data as of 30 June 2019.
39
vk.com/id446425943
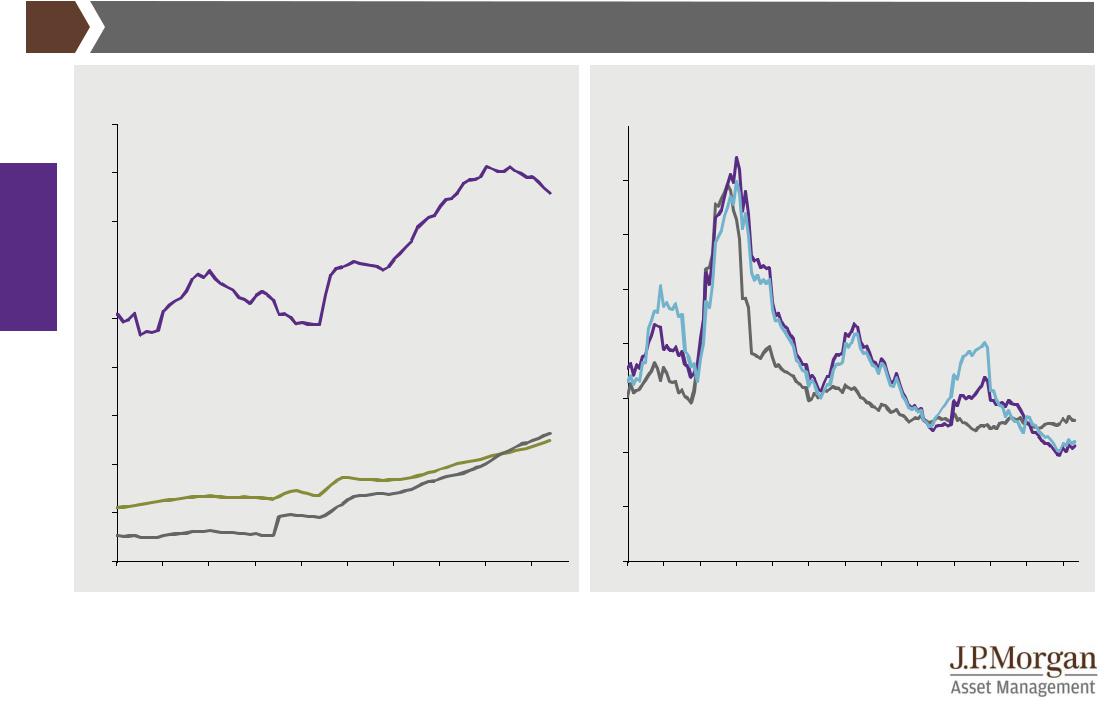
China debt |
GTM – Europe | 40 |
China debt to GDP ratios |
China credit growth |
|
% of nominal GDP |
|
|
|
|
|
|
|
|
% change year on year |
|
|
|
|
|
|
|
|
|
||||
|
180 |
|
|
|
|
|
|
|
|
|
40 |
|
|
|
|
|
|
|
|
|
|
|
|
|
|
|
|
|
|
|
Non-financial corporates |
|
|
|
|
|
|
|
|
|
|
|
|
|
|||
|
160 |
|
|
|
|
|
|
|
|
|
35 |
|
|
|
Total social financing |
|
|
|
|
|
|||
economy |
|
|
|
|
|
|
|
|
|
|
|
|
|
|
|
|
|
|
|
|
|
||
|
|
|
|
|
|
|
|
|
|
|
|
|
|
|
|
|
|
|
|
|
|
||
140 |
|
|
|
|
|
|
|
|
|
30 |
|
|
|
|
|
|
|
|
|
|
|
|
|
|
|
|
|
|
|
|
|
|
|
|
|
|
|
|
|
|
|
|
|
|
|
||
Global |
|
|
|
|
|
|
|
|
|
|
|
|
|
|
|
|
|
|
|
|
|
|
|
120 |
|
|
|
|
|
|
|
|
|
|
|
|
|
|
|
|
|
|
|
|
|
|
|
|
|
|
|
|
|
|
|
|
|
|
|
|
|
|
|
|
|
|
|
|
|
|
|
|
|
|
|
|
|
|
|
|
|
|
25 |
|
|
|
|
|
|
|
|
|
|
|
|
|
100 |
|
|
|
|
|
|
|
|
|
|
|
|
|
|
|
|
|
|
Broad credit |
|
||
|
|
|
|
|
|
|
|
|
|
|
20 |
|
|
|
|
|
|
|
|
|
|
|
|
|
80 |
|
|
|
|
|
|
|
|
|
|
|
|
|
|
|
|
|
|
|
|
|
|
|
|
|
|
|
|
|
|
|
|
|
15 |
|
|
|
|
|
|
|
|
|
|
|
|
|
60 |
|
|
|
|
|
|
|
|
|
|
|
|
|
|
|
|
|
|
|
|
|
|
|
|
|
|
|
|
|
Government |
|
|
10 |
|
|
|
RMB bank lending |
|
|
|
|
|
||||
|
|
|
|
|
|
|
|
|
|
|
|
|
|
|
|
|
|
|
|
|
|||
|
40 |
|
|
|
|
|
|
|
|
|
|
|
|
|
|
|
|
|
|
|
|
|
|
|
|
|
|
|
|
|
|
|
|
|
|
|
|
|
|
|
|
|
|
|
|
|
|
|
|
|
|
|
|
|
|
|
Households |
|
|
|
|
|
|
|
|
|
|
|
|
|
|
|
20 |
|
|
|
|
|
|
|
|
|
5 |
|
|
|
|
|
|
|
|
|
|
|
|
|
|
|
|
|
|
|
|
|
|
|
|
|
|
|
|
|
|
|
|
|
|
|
|
|
0 |
|
|
|
|
|
|
|
|
|
0 |
|
|
|
|
|
|
|
|
|
|
|
|
|
'00 |
'02 |
'04 |
'06 |
'08 |
'10 |
'12 |
'14 |
'16 |
'18 |
'07 |
'08 |
'09 |
'10 |
'11 |
'12 |
'13 |
'14 |
'15 |
'16 |
'17 |
'18 |
'19 |
Source: (Left) Bank for International Settlements, Refinitiv Datastream, J.P. Morgan Asset Management. Debt refers to gross debt. (Right) People’s Bank of China (PBoC), J.P. Morgan Asset Management. This chart includes three measures of credit ranging from the narrowest – RMB bank lending – to the more extensive broad credit. Specifically, RMB bank lending is the sum of all loans made by the commercial banking system to domestic borrowers. Total social financing (TSF) is all funding to domestic borrowers that is not explicitly backed by the sovereign and thus includes bank lending, trust loans, entrusted loans, bankers’ acceptances, corporate bonds and equity financing by non-financial enterprises, asset backed securities, loan write-offs and local government ‘special’ bonds. Broad credit is total social financing plus all finance provided by local and central governments. Past performance is not a reliable indicator of current and future results.
40 Guide to the Markets - Europe. Data as of 30 June 2019.