

J.P. Morgan - Guide to the Markets_watermark
.pdfvk.com/id446425943
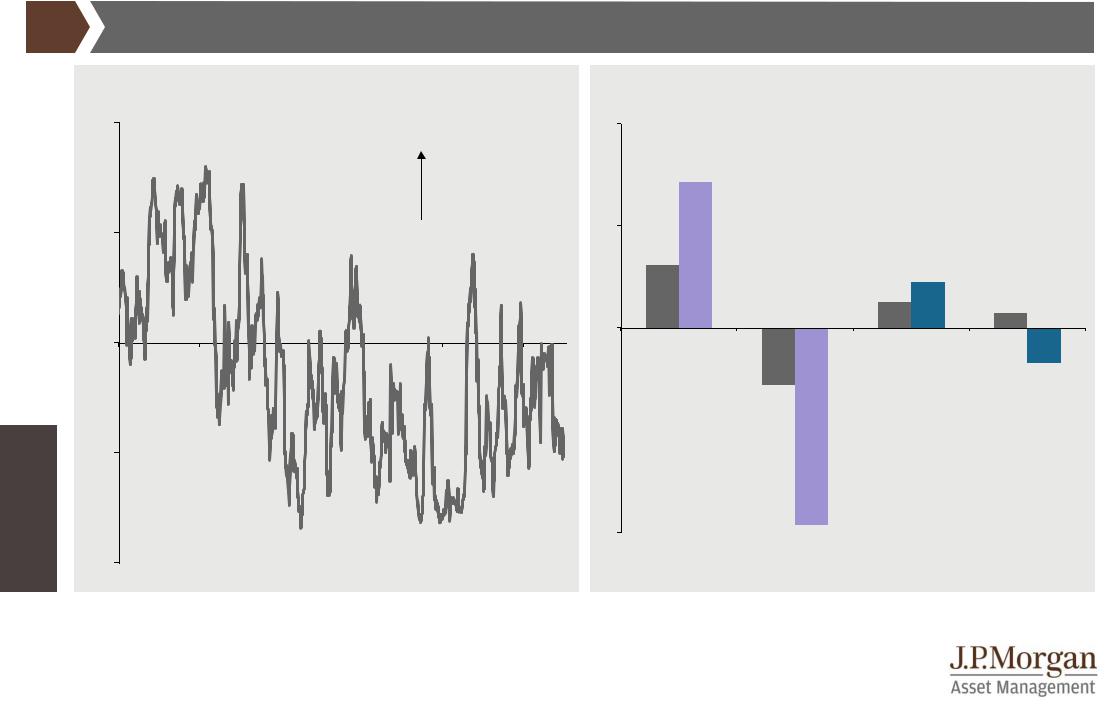
Global fixed income spreads and returns
Fixed income spreads
%, option-adjusted spread 20
|
18 |
|
|
|
|
|
|
|
|
|
|
|
|
|
|
|
|
|
|
|
|
16 |
|
|
|
|
|
|
Current |
|
|
|
|
|
|
|
|
|
|
|
|
|
|
|
|
|
|
|
Range since 1998 |
|
|
|
|
|
|
|
|
|||||
|
|
|
|
|
|
|
|
|
|
|
|
|
|
|
|
|||||
|
14 |
|
|
|
|
|
|
Average |
|
|
|
|
|
|
|
|
|
|
|
|
|
|
|
|
|
|
|
|
|
|
|
|
|
|
|
|
|
|
|||
|
|
|
|
|
|
|
|
|
|
|
|
|
|
|
|
|
|
|||
|
|
|
|
|
|
|
|
|
|
|
|
|
|
|
|
|
|
|
|
|
|
12 |
|
|
|
|
|
|
|
|
|
|
|
|
|
|
|
|
|
|
|
|
10 |
|
|
|
|
|
|
|
|
|
|
|
|
|
|
|
|
|
|
|
income |
|
|
|
|
|
|
|
|
|
|
|
|
|
|
|
|
|
|
|
|
8 |
|
|
|
|
|
|
|
|
|
|
|
|
|
|
|
|
|
|
|
|
|
|
|
|
|
|
|
|
|
|
|
|
|
|
|
|
|
|
|
|
|
Fixed |
6 |
|
|
|
|
|
|
|
|
|
|
|
|
|
|
|
|
|
|
|
|
|
|
|
|
|
|
|
|
|
|
|
|
|
|
|
|
|
|
||
|
|
|
|
|
|
|
|
|
|
|
|
|
|
|
|
|
|
|
||
4 |
|
|
|
|
|
|
|
|
|
|
|
|
|
|
4,1 |
|||||
|
|
|
|
|
|
|
|
|
|
|
|
|
|
|||||||
|
|
|
|
|
|
|
|
|
|
|
3,7 |
|||||||||
|
|
|
|
|
|
|
|
|
|
|
|
|
3,7 |
|
|
|||||
|
|
|
|
|
|
|
|
|
|
|
|
|
|
|
|
|
|
|||
|
2 |
|
|
|
|
|
1,1 |
|
1,2 |
|
|
1,5 |
|
|
|
|
|
|
|
|
|
|
|
|
|
|
|
|
|
|
|
|
|
|
|
|
|||||
|
0 |
|
|
|
|
|
|
|
|
|
|
|
|
|
|
|
||||
|
|
|
|
|
|
|
|
|
|
|
|
|
|
|||||||
|
|
|
|
|
|
|
|
|
|
|
|
|
|
|
|
|
||||
|
|
|
|
|
|
|
|
|
|
|
|
|
|
|
|
|
|
|
|
|
|
Euro IG US IG |
UK IG |
|
EMD |
Euro HY US HY |
|||||||||||||||
|
|
|
||||||||||||||||||
|
|
(USD Sov.) |
||||||||||||||||||
|
|
|
|
GTM – Europe |
| 81 |
|
|
|
|
|
|
|
|
|
|
Fixed income returns |
|
|
Ann. return |
||||
2015 |
2016 |
2017 |
2018 |
YTD |
2Q19 |
since ’08 |
|
€ :12,8% |
21,0% |
6,1% |
5,9% |
11,0% |
3,4% |
10,4% |
|
EM Debt |
US HY |
Euro HY |
US Treas. |
EM Debt |
Euro Gov |
US HY |
|
LCL:1,2% |
17,5% |
6,1% |
0,9% |
10,6% |
3,4% |
7,7% |
|
|
|
|
|
|
|
|
|
12,3% |
13,5% |
2,4% |
2,7% |
10,5% |
3,0% |
9,2% |
|
US Treas. |
EM Debt |
Euro IG |
US HY |
US HY |
US IG |
EM Debt |
|
0,8% |
10,2% |
2,4% |
-2,3% |
10,1% |
4,5% |
6,6% |
|
|
|
|
|
|
|
|
|
10,6% |
10,1% |
1,4% |
2,4% |
10,3% |
2,8% |
8,0% |
|
US IG |
Euro HY |
Infl Linked |
US IG |
US IG |
Infl Linked |
US IG |
|
-0,7% |
10,1% |
1,4% |
-2,5% |
9,9% |
2,8% |
5,4% |
|
|
|
|
|
|
|
|
|
6,4% |
9,3% |
0,2% |
1,3% |
7,6% |
2,4% |
7,3% |
|
Portfolio |
US IG |
Euro Gov |
Portfolio |
Portfolio |
Portfolio |
Euro HY |
|
0,1% |
6,1% |
0,2% |
-1,4% |
7,4% |
3,2% |
7,3% |
|
|
|
|
|
|
|
|
|
6,3% |
8,1% |
-2,9% |
1,0% |
7,5% |
2,3% |
7,0% |
|
US HY |
Portfolio |
Portfolio |
Euro Gov |
Euro HY |
EM Debt |
Portfolio |
|
-4,6% |
6,4% |
4,2% |
1,0% |
7,5% |
3,8% |
5,5% |
|
|
|
|
|
|
|
|
|
1,7% |
4,7% |
-4,0% |
0,2% |
6,0% |
2,2% |
6,0% |
|
Euro Gov |
Euro IG |
EM Debt |
EM Debt |
Euro Gov |
Euro IG |
US Treas. |
|
1,7% |
4,7% |
9,3% |
-4,6% |
6,0% |
2,2% |
3,4% |
|
|
|
|
|
|
|
|
|
0,8% |
4,1% |
-5,6% |
-1,3% |
5,6% |
2,2% |
5,0% |
|
Infl Linked |
US Treas. |
US HY |
Euro IG |
US Treas. |
Euro HY |
Euro Gov |
|
0,8% |
1,0% |
7,5% |
-1,3% |
5,2% |
2,2% |
5,0% |
|
|
|
|
|
|
|
|
|
0,5% |
3,8% |
-6,5% |
-1,5% |
5,4% |
1,6% |
4,6% |
|
Euro HY |
Infl Linked |
US IG |
Infl Linked |
Euro IG |
US Treas. |
Euro IG |
|
0,5% |
3,8% |
6,4% |
-1,5% |
5,4% |
3,0% |
4,6% |
|
|
|
|
|
|
|
|
|
-0,6% |
3,2% |
-10,1% |
-3,7% |
4,1% |
1,1% |
2,8% |
|
Euro IG |
Euro Gov |
US Treas. |
Euro HY |
Infl Linked |
US HY |
Infl Linked |
|
-0,6% |
3,2% |
2,3% |
-3,7% |
4,1% |
2,5% |
2,8% |
|
|
|
|
|
|
|
|
|
|
Source: (All charts) Bloomberg Barclays, BofA/Merrill Lynch, J.P. Morgan Economic Research, Refinitiv Datastream, J.P. Morgan Asset Management. UK IG: |
|
Bloomberg Barclays Sterling Agg. – Corporates; US HY: BofA/Merrill Lynch US High Yield Constrained; EM Debt: J.P. Morgan EMBI Global; Euro HY: BofA/Merrill |
|
Lynch Euro Non-Financial High Yield Constrained; US IG: Bloomberg Barclays US Agg. – Corporate – Investment Grade; US Treasuries: Bloomberg Barclays US |
|
Agg. Gov. – Treasury; Euro IG: Bloomberg Barclays Euro Agg. – Corporate; Euro Gov.: Bloomberg Barclays Euro Agg. Government; Infl Linked: Bloomberg Barclays |
|
Euro Gov. Inflation-Linked. Hypothetical portfolio (for illustrative purposes only and should not be taken as a recommendation): 20% Euro Gov.; 15% US Treasuries; |
81 |
10% Linkers; 15% US IG; 10% Euro IG; 10% US HY; 5% Euro HY; 15% EM Debt. Annualised return covers period 2008 to 2018. Returns are unhedged in euro and |
local currencies. Past performance is not a reliable indicator of current and future results. Guide to the Markets - Europe. Data as of 30 June 2019. |

vk.com/id446425943
Commodities |
GTM – Europe | 82 |
WTI crude oil price and US rig count
|
USD/barrel (LHS); number of rigs (RHS) |
|
|
|
|
|
|||||||
|
160 |
Oil price |
|
|
|
|
|
|
|
Rigs |
|||
|
|
|
|
|
|
|
|
|
|||||
|
140 |
|
|
|
|
|
|
|
|
|
|
|
|
|
120 |
|
|
|
|
|
|
|
|
|
|
|
|
|
100 |
|
|
|
|
|
|
|
|
|
|
|
|
|
80 |
|
|
|
|
|
|
|
|
|
|
|
|
|
60 |
|
|
|
|
|
|
|
|
|
|
|
|
assets |
40 |
|
|
|
|
|
|
|
|
|
|
|
|
20 |
|
|
|
|
|
|
|
|
|
|
|
|
|
Other |
0 |
|
|
|
|
|
|
|
|
|
|
|
|
|
|
|
|
|
|
|
|
|
|
|
|
|
|
|
'07 |
'08 |
'09 |
'10 |
'11 |
'12 |
'13 |
'14 |
'15 |
'16 |
'17 |
'18 |
'19 |
Metal prices
|
Index level, rebased to 100 in Jan 2007 |
|
|
|
|
|
|
||||||
1.800 |
200 |
|
|
|
|
|
|
|
|
|
|
|
|
1.600 |
175 |
|
|
|
|
|
|
|
|
|
|
|
|
|
|
|
|
|
|
|
|
|
|
|
|
|
|
1.400 |
150 |
|
|
|
|
|
|
|
|
|
|
|
|
|
|
|
|
|
|
|
|
|
|
|
|
|
|
1.200 |
|
|
|
|
|
|
|
|
|
|
|
Copper |
|
|
|
|
|
|
|
|
|
|
|
|
|
|
|
|
125 |
|
|
|
|
|
|
|
|
|
|
|
|
1.000 |
|
|
|
|
|
|
|
|
|
|
|
|
|
|
100 |
|
|
|
|
|
|
|
|
|
|
|
|
800 |
|
|
|
|
|
|
Aluminium |
|
|
|
|
||
|
75 |
|
|
|
|
|
|
|
|
|
|
|
|
600 |
|
|
|
|
|
|
|
|
|
|
|
|
|
|
50 |
|
|
|
|
|
|
|
|
|
|
|
Zinc |
400 |
|
|
|
|
|
|
|
|
|
|
|
|
|
|
|
|
|
|
|
|
|
|
|
|
|
|
|
200 |
25 |
|
|
|
|
|
|
|
|
|
|
Nickel |
|
|
|
|
|
|
|
|
|
|
|
|
|||
0 |
0 |
|
|
|
|
|
|
|
|
|
|
|
|
|
'07 |
'08 |
'09 |
'10 |
'11 |
'12 |
'13 |
'14 |
'15 |
'16 |
'17 |
'18 |
'19 |
Source: (Left) Baker Hughes, Bloomberg, J.P. Morgan Asset Management. (Right) Bloomberg, J.P. Morgan Asset Management. Past performance is not a reliable indicator of current and future results. Guide to the Markets - Europe. Data as of 30 June 2019.
82

vk.com/id446425943
Gold |
GTM – Europe | 83 |
Gold vs. real US 10-year Treasury yields
|
$ per Troy ounce (LHS), % inverted (RHS) |
|
|
|
||||
|
1.800 |
|
|
|
|
|
|
|
|
|
|
|
|
|
Real yields (inverted) |
||
|
1.600 |
|
|
|
|
|
|
|
|
1.400 |
|
|
|
|
|
|
|
assets |
1.200 |
|
|
|
|
|
|
|
|
|
|
|
|
|
|
|
|
Other |
|
Gold |
|
|
|
|
|
|
1.000 |
|
|
|
|
|
|
|
|
|
|
|
|
|
|
|
|
|
|
'12 |
'13 |
'14 |
'15 |
'16 |
'17 |
'18 |
'19 |
Gold price
|
$ per Troy ounce |
|
|
|
|
|
|
|
|
|
|
-1,0 |
2.500 |
|
|
|
|
|
|
|
|
|
|
-0,8 |
|
|
|
|
|
|
|
|
|
|
|
-0,6 |
2.000 |
|
|
|
|
|
|
|
|
|
|
|
|
|
|
|
|
|
|
|
|
|
|
-0,4 |
|
|
|
Inflation-adjusted gold price |
|
|
|
||||
-0,2 |
|
|
|
Gold price |
|
|
|
|
|
||
1.500 |
|
|
|
|
|
|
|
|
|
|
|
|
|
|
|
|
|
|
|
|
|
|
|
0,0 |
|
|
|
|
|
|
|
|
|
|
|
0,2 |
|
|
|
|
|
|
|
|
|
|
|
0,4 |
1.000 |
|
|
|
|
|
|
|
|
30 June 2019: |
|
|
|
|
|
|
|
|
|
|
|
$1.412 |
|
|
|
|
|
|
|
|
|
|
|
|
|
0,6 |
|
|
|
|
|
|
|
|
|
|
|
0,8 |
500 |
|
|
|
|
|
|
|
|
|
|
|
|
|
|
|
|
|
|
|
|
|
|
1,0 |
|
|
|
|
|
|
|
|
|
|
|
1,2 |
0 |
|
|
|
|
|
|
|
|
|
|
|
'78 |
'82 |
'86 |
'90 |
'94 |
'98 |
'02 |
'06 |
'10 |
'14 |
'18 |
Source: (All charts) Refinitiv Datastream, J.P. Morgan Asset Management. Real yield is the 10-year US Treasury inflation protected security yield. Inflation-adjusted gold price is the historic gold price in today’s money, converted using the US Consumer Price Index. The 2001 low is defined as April 2001, and the 2011 peak is defined as August 2011. Past performance is not a reliable indicator of current and future results. Guide to the Markets - Europe. Data as of 30 June 2019.
83
vk.com/id446425943
Other assets
Stock-bond correlation and downside protection |
GTM – Europe | 84 |
Rolling six-month stock and bond correlations
Of weekly total return on US equities (S&P 500) and US Treasuries (10-yr) 1,0
Stock and bond returns moving in the same direction
0,5
0,0
-0,5
-1,0
'92 |
'97 |
'02 |
'07 |
'12 |
'17 |
Hedge fund returns in different market environments
%, average total return in up and down months, 2001-present 4
2,9
2
1,2
0,9
0,5
0,3
0
-0,7
-1,1
-2
|
|
S&P 500 |
|
US bonds** |
|
-4 |
|
HFRI FW* |
|
HFRI FW* |
|
|
|
|
|||
|
-3,9 |
|
|
|
|
|
S&P 500 up S&P 500 down |
|
Bonds up |
Bonds down |
|
Source: (Left) Refinitiv Datastream, J.P. Morgan Asset Management. (Right) Barclays, Hedge Fund Research, Refinitiv Datastream, Standard & Poor’s, J.P. Morgan Asset Management. *HFRI FW is Hedge Fund Research Index Fund Weighted. **US bonds is the Bloomberg Barclays US Aggregate Bond Index. Downside protection refers to attempting to minimise the impact of any falls in the underlying investments. Past performance is not a reliable indicator of current and future results. Guide to the Markets - Europe. Data as of 30 June 2019.
84

vk.com/id446425943
Alternative investments |
GTM – Europe | 85 |
Global core infrastructure returns |
Macro hedge fund relative performance & volatility |
|
%, rolling 4-quarter returns from income and capital appreciation |
|
Index level (LHS); % change year on year (RHS) |
|
|
|
|
||||||||||||||||
|
20 |
|
|
|
|
|
|
|
|
|
70 |
|
|
|
|
|
|
|
|
|
|
|
35 |
|
|
|
|
|
|
|
|
|
|
|
|
VIX |
|
|
|
|
|
|
|
|
|
|
30 |
|
|
|
|
|
|
|
|
|
|
|
|
|
|
|
|
|
|
|
|
|
|
|
|
|
|
|
|
|
|
|
|
|
|
|
60 |
|
|
|
|
|
|
|
|
|
|
|
|
|
15 |
|
|
|
|
|
|
|
|
|
|
|
|
|
|
|
|
|
|
|
|
|
25 |
|
|
|
|
|
|
|
|
|
|
|
|
|
|
|
|
|
|
|
|
|
|
|
|
|
|
|
|
|
|
|
|
|
|
|
50 |
|
|
|
|
|
|
|
|
|
|
|
20 |
|
|
|
|
|
|
|
|
|
|
|
|
|
|
|
|
|
|
|
|
|
|
|
|
|
|
|
|
|
|
|
|
|
|
|
|
|
|
|
|
|
|
|
|
|
|
|
15 |
|
10 |
|
|
|
|
|
|
|
|
|
40 |
|
|
|
|
|
|
|
|
|
|
|
|
|
|
|
|
|
|
|
|
|
|
|
|
|
|
|
|
|
|
|
|
|
|
10 |
|
|
|
|
|
|
|
|
|
|
|
|
|
|
|
|
|
|
|
|
|
|
|
|
|
|
|
|
|
|
|
|
|
|
|
|
30 |
|
|
|
|
|
|
|
|
|
|
|
5 |
|
5 |
|
|
|
|
|
|
|
|
|
|
|
|
|
|
|
|
|
|
|
|
|
|
|
|
|
|
|
|
|
|
|
|
|
|
|
|
|
|
|
|
|
|
|
|
0 |
|
|
|
|
|
|
|
|
|
|
|
|
|
|
|
|
|
|
|
|
|
|
|
|
|
|
|
|
|
|
|
|
|
|
|
|
20 |
|
|
|
|
|
|
|
|
|
|
|
-5 |
assets |
|
|
|
|
|
|
|
|
|
|
|
|
|
|
|
|
|
|
|
|
|
|
|
0 |
|
|
|
|
|
|
|
|
|
|
|
|
|
|
|
|
|
|
|
|
|
-10 |
|
|
|
|
|
|
|
|
|
|
|
|
|
|
|
|
|
|
|
|
|
|
|
||
|
|
|
|
|
|
|
|
|
|
|
|
|
|
|
|
|
|
|
|
|
|
|
|
|
|
|
|
|
|
|
|
|
|
|
10 |
|
|
|
|
|
|
|
|
|
|
|
|
Other |
|
|
|
|
|
|
|
|
|
|
|
|
|
|
|
|
|
|
|
|
|
|
-15 |
|
|
|
|
|
|
|
|
|
|
|
|
Macro hedge fund relative performance to HFRI |
|||||||||||
|
|
|
|
|
|
|
|
|
|
|
|
|
|||||||||||
|
-5 |
|
|
|
|
|
|
|
|
|
0 |
|
|
|
|
|
|
|
|
|
|
|
-20 |
|
'09 |
'10 |
'11 |
'12 |
'13 |
'14 |
'15 |
'16 |
'17 |
'18 |
'94 |
'96 |
'98 |
'00 |
'02 |
'04 |
'06 |
'08 |
'10 |
'12 |
'14 |
'16 |
'18 |
Source: (Left) MSCI, J.P. Morgan Asset Management. Infrastructure returns represented by the “low risk” category of the MSCI Global Quarterly Infrastructure Asset Index. Data show rolling one-year returns from income and capital appreciation. The chart shows the full index history, beginning in the first quarter of 2009. (Right) CBOE, Hedge Fund Research Indices (HFRI), Refinitiv, J.P. Morgan Asset Management. Macro hedge fund relative performance is calculated relative to the HFRI fund weighted hedge fund index. VIX is the implied volatility of S&P 500 Index based on options pricing. Past performance is not a reliable indicator of current and future results. Guide to the Markets - Europe. Data as of 30 June 2019.
85
vk.com/id446425943
Other assets
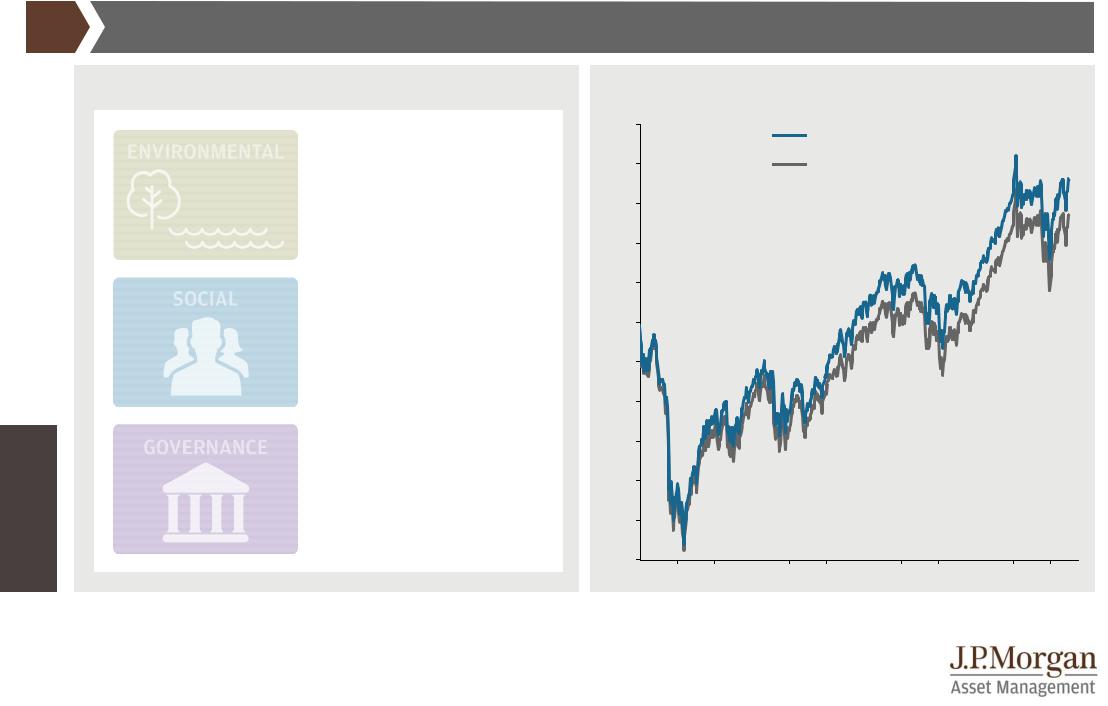
Sustainable investing |
GTM – Europe | 86 |
Environmental, social and governance considerations |
Global equities |
Carbon emissions
Water & waste
Biodiversity
Labour management Health & product safety Privacy & data security
Management & oversight Board composition Ownership & pay
Price index |
|
|
|
|
|
|
|
|
|
|
|
150 |
|
|
|
|
MSCI ACWI ESG Leaders |
|
|
||||
|
|
|
|
|
|
|
|||||
140 |
|
|
|
|
MSCI ACWI |
|
|
|
|
||
130 |
|
|
|
|
|
|
|
|
|
|
|
120 |
|
|
|
|
|
|
|
|
|
|
|
110 |
|
|
|
|
|
|
|
|
|
|
|
100 |
|
|
|
|
|
|
|
|
|
|
|
90 |
|
|
|
|
|
|
|
|
|
|
|
80 |
|
|
|
|
|
|
|
|
|
|
|
70 |
|
|
|
|
|
|
|
|
|
|
|
60 |
|
|
|
|
|
|
|
|
|
|
|
50 |
|
|
|
|
|
|
|
|
|
|
|
40 |
|
|
|
|
|
|
|
|
|
|
|
'08 |
'09 |
'10 |
'11 |
'12 |
'13 |
'14 |
'15 |
'16 |
'17 |
'18 |
'19 |
Source: MSCI, Refinitiv Datastream, J.P. Morgan Asset Management. Both MSCI ACWI and MSCI ACWI ESG Leaders are in USD, rebased to 100 at the inception of the ESG Leaders index. MSCI ACWI ESG Leaders is a capitalisation-weighted price index that provides exposure to companies with high Environmental, Social and Governance (ESG) rankings relative to their sector peers and excludes companies with involvement in alcohol, gambling, tobacco, nuclear power and weapons. ESG rankings are given to companies based on the MSCI framework. The MSCI ESG Leaders index aims to target the sector weights of the underlying indices to limit systematic risk introduced by the ESG selection process. Past performance is not a reliable indicator of current and future results. Guide to the Markets - Europe. Data as of 30 June 2019.
86

vk.com/id446425943
Other assets
Asset markets in coming years |
GTM – Europe | 87 |
Past and expected returns
%, annualised return
EM equity US private equity Eurozone large cap Japan equity EM local currency debt UK large cap
Global infrastructure
US core real estate
US high yield bonds hedged
US large cap
European high yield bonds
Diversified hedge funds hedged
Euro government bonds
World government bonds
Commodities
Euro cash
Return since 2009
Expected return in coming 10-15 years
-5 |
0 |
5 |
10 |
15 |
20 |
Source: 2019 Long-Term Capital Market Assumptions, November 2018, J.P. Morgan Multi-Asset Solutions, J.P. Morgan Asset Management. Returns are nominal and in euros. Past returns are calculated from the start of 2009 up to 3Q 2018, or the most recent available data. The projections in the chart above are based on J.P. Morgan Asset Management’s proprietary long-term capital market assumptions (10-15 years) for returns of major asset classes. The resulting projections include only the benchmark return associated with the portfolio and do not include alpha from the underlying product strategies within each asset class. The assumptions are presented for illustrative purposes only. Past performance is not a reliable indicator of current and future results. Guide to the Markets - Europe.
Data as of 30 June 2019.
87

vk.com/id446425943
Investing |
principles |
Life expectancy
Probability of reaching ages 80 and 90
% probability, persons aged 65, by gender and combined couple
100
92
80 |
76 |
67
60
40
24
20
GTM – Europe | 88
Men
Women
Couple – at least one lives to specified age
50
35
0
80 years |
90 years |
Source: ONS 2015-2017 Life Tables, J.P. Morgan Asset Management. Past performance is not a reliable indicator of current and future results.
Guide to the Markets - Europe. Data as of 30 June 2019.
88

vk.com/id446425943
Cash investments |
GTM – Europe | 89 |
Income generated by €100.000 in a three-month bank deposit |
Total return of $1 in real terms |
|
EUR (LHS); % change year on year (RHS) |
|
|
|
|
USD, log scale, total returns |
|
|
|
|||||||
|
5.000 |
|
2007: €4.650 |
|
|
|
|
|
5 |
10.000 |
|
Annualised real returns |
|
|||
|
|
|
|
|
|
|
|
|
|
|
|
|||||
|
|
Income |
|
|
|
|
|
|
|
|
|
|
1899–2018 |
2000–2018 |
Equities: $1.890 |
|
|
4.000 |
|
|
|
|
|
Inflation |
4 |
|
Equities |
6,5% |
|
3,6% |
|
||
|
|
|
|
|
|
|
|
|
|
|
|
|||||
|
|
|
|
|
|
|
|
|
1.000 |
Bonds |
|
|
|
|
||
|
|
|
|
|
|
|
|
|
|
|
2,1% |
|
4,3% |
|
||
|
|
|
|
|
|
|
|
|
|
|
|
Cash |
0,6% |
|
-0,6% |
|
|
3.000 |
|
|
|
|
|
|
|
|
3 |
|
|
|
|
|
|
|
|
|
|
|
|
|
|
June 2019: €0 |
100 |
|
|
|
|
|
||
|
|
|
|
|
|
|
|
|
|
|
|
|
|
|
|
|
|
2.000 |
|
|
|
|
|
|
|
|
2 |
|
|
|
|
|
Bonds: $12 |
|
|
|
|
|
|
|
|
|
|
|
|
|
|
|
|
|
|
|
|
|
|
|
|
|
|
|
|
10 |
|
|
|
|
|
|
1.000 |
|
|
|
|
|
|
|
|
1 |
|
|
|
|
|
Cash: $2 |
|
|
|
|
|
|
|
|
|
|
|
|
|
|
|
|
|
|
0 |
|
|
|
|
|
|
|
|
0 |
1 |
|
|
|
|
|
|
|
|
|
|
|
|
|
|
|
|
|
|
|
|
||
Investing principles |
-1.000 |
|
|
|
|
|
|
|
|
-1 |
0 |
|
|
|
|
|
'01 |
'03 |
'05 |
'07 |
'09 |
'11 |
'13 |
'15 |
'17 |
'19 |
1899 |
1919 |
1939 |
1959 |
1979 |
1999 |
|
Source: (Left) Bloomberg, Eurostat, J.P. Morgan Asset Management. Inflation is the percentage change year on year for the eurozone harmonised index of consumer |
|
|||||||||||||||
prices. (Right) Bloomberg, Bloomberg Barclays, FactSet, Shiller, Siegel, Standard & Poor’s, J.P. Morgan Asset Management. Pre 2010 returns: Shiller, Siegel; from |
|
|||||||||||||||
|
2010: Equities: S&P 500; Bonds: Bloomberg Barclays US Treasury 20+ year Total Return Index; Cash: Bloomberg Barclays US Treasury Bills Total Return Index. |
|
||||||||||||||
|
Past performance is not a reliable indicator of current and future results. Guide to the Markets - Europe. Data as of 30 June 2019. |
|
|
|
|
|||||||||||
89

vk.com/id446425943 |
|
|
|
|
|
|
|
|
|
|
|
|
|
|
|
|
|
||
|
The power of compounding |
|
|
|
|
|
|
|
|
GTM – Europe |
| |
90 |
|||||||
|
€5.000 invested annually with 5% growth per year |
|
|
€5. 000 investment with/without income reinvested |
|
|
|||||||||||||
|
EUR |
|
|
|
|
|
|
|
|
EUR, MSCI Europe returns |
|
|
|
|
|
|
|
||
|
700.000 |
|
|
|
|
|
|
|
|
80.000 |
|
|
|
|
|
|
|
€76.233 |
|
|
|
|
|
|
|
|
|
|
€639.199 |
|
|
|
|
|
|
|
|
|
|
|
600.000 |
Starting at age 25 |
|
|
|
|
|
|
|
With dividends reinvested |
|
|
|
|
|||||
|
|
Starting at age 35 |
|
|
|
|
|
|
|
Without dividends reinvested |
|
|
|
|
|||||
|
500.000 |
|
|
|
|
|
|
|
|
60.000 |
|
|
|
|
|
|
|
|
|
|
|
|
|
|
|
|
|
|
|
|
|
|
|
|
|
|
|
|
|
|
400.000 |
|
|
|
|
|
|
|
€353.803 |
|
|
|
|
|
|
|
|
|
|
|
|
|
|
|
|
|
|
|
|
|
|
|
|
|
|
|
|
|
|
|
|
|
|
|
|
|
|
|
|
40.000 |
|
|
|
|
|
|
|
|
|
|
300.000 |
|
|
|
|
|
|
|
|
|
|
|
|
|
|
|
|
€27.578 |
|
|
|
|
|
|
|
|
|
|
|
|
|
|
|
|
|
|
|
||
|
200.000 |
|
|
|
|
|
|
|
|
20.000 |
|
|
|
|
|
|
|
|
|
|
|
|
|
|
|
|
|
|
|
|
|
|
|
|
|
|
|
|
|
|
100.000 |
|
|
|
|
|
|
|
|
|
|
|
|
|
|
|
|
|
|
Investing principles |
0 |
|
|
|
|
|
|
|
|
0 |
|
|
|
|
|
|
|
|
|
25 |
30 |
35 |
40 |
45 |
50 |
55 |
60 |
65 |
'86 |
'90 |
'94 |
'98 |
'02 |
'06 |
'10 |
'14 |
|
'18 |
|
|
|
|
|
Age |
|
|
|
|
|
|
|
|
|
|
|
|
|
|
|
Source: (Left) J.P. Morgan Asset Management. For illustrative purposes only, assumes all income reinvested, actual investments may incur higher or lower growth |
|
|
|
|
|||||||||||||||
rates and charges. (Right) Bloomberg, MSCI, J.P. Morgan Asset Management. Based on MSCI Europe index and assumes no charges. Past performance is not a |
|
|
|
|
|||||||||||||||
|
reliable indicator of current and future results. Guide to the Markets - Europe. Data as of 30 June 2019. |
|
|
|
|
|
|
|
|
|
|||||||||
90