

J.P. Morgan - Guide to the Markets_watermark
.pdfvk.com/id446425943
World stock market returns |
GTM – Europe | 71 |
Equities
|
2008 |
2009 |
2010 |
2011 |
2012 |
2013 |
2014 |
2015 |
2016 |
2017 |
2018 |
|
YTD |
|
Q219 |
|
Ann. |
||||||||||
|
|
|
|
return |
|||||||||||||||||||||||
|
|
|
|
|
|
|
|
|
|
|
|
|
|
|
|
|
|
|
|
|
|
|
|
|
|
|
since ’08 |
EUR |
-23,0% |
|
73,5% |
|
35,4% |
|
5,5% |
|
20,8% |
|
27,2% |
|
29,5% |
|
24,4% |
|
16,6% |
|
24,8% |
|
0,4% |
|
19,0% |
|
3,4% |
|
10,7% |
|
TOPIX |
|
MSCI EM |
|
Small Cap |
|
US S&P 500 |
|
Asia ex-Jp |
|
Sm all Cap |
|
US S&P 500 |
|
TOPIX |
|
Sm all Cap |
|
Asia ex-Jp |
|
US S&P 500 |
|
US S&P 500 |
|
Europe |
|
US S&P 500 |
Local |
-40,6% |
|
62,8% |
|
24,4% |
|
2,1% |
|
19,7% |
|
35,8% |
|
13,7% |
|
12,1% |
|
14,5% |
|
35,9% |
|
-4,4% |
|
18,5% |
|
4,5% |
|
8,0% |
|
|
|
|
|
|
|
|
|
|
|
|
|
|
|
|
|
|
|
|
|
|
|
|
|
|
|
|
|
|
|
|
|
|
|
|
|
|
|
|
|
|
|
|||||||||||||
|
-33,7% |
|
67,2% |
|
28,3% |
|
3,5% |
|
18,1% |
|
26,7% |
|
19,7% |
|
12,9% |
|
15,3% |
|
21,0% |
|
-1,5% |
|
16,9% |
|
2,8% |
|
9,3% |
|
US S&P 500 |
|
Asia ex-Jp |
|
Asia ex-Jp |
|
HDY Equity |
|
Europe |
|
US S&P 500 |
|
Asia ex-Jp |
|
US S&P 500 |
|
US S&P 500 |
|
MSCI EM |
|
HDY Equity |
|
Europe |
|
US S&P 500 |
|
Sm all Cap |
|
-37,0% |
|
67,2% |
|
15,6% |
|
1,5% |
|
16,4% |
|
32,4% |
|
7,7% |
|
1,4% |
|
12,0% |
|
31,0% |
|
-3,9% |
|
16,7% |
|
4,3% |
|
7,3% |
|
|
|
|
|
|
|
|
|
|
|
|
|
|
|
|
|
|
|
|
|
|
|
|
|
|
|
|
|
|
|
|
|
|
|
|
|
|
|
|
|
|
|
|||||||||||||
|
-38,0% |
|
40,2% |
|
27,5% |
|
-5,7% |
|
16,8% |
|
21,5% |
|
16,5% |
|
11,5% |
|
14,9% |
|
12,4% |
|
-6,9% |
|
16,7% |
|
2,1% |
|
6,6% |
|
HDY Equity |
|
Small Cap |
|
MSCI EM |
|
Small Cap |
|
MSCI EM |
|
TOPIX |
|
Sm all Cap |
|
Sm all Cap |
|
MSCI EM |
|
Portfolio |
|
Portfolio |
|
Sm all Cap |
|
HDY Equity |
|
HDY Equity |
|
-34,4% |
|
40,8% |
|
14,4% |
|
-8,7% |
|
17,4% |
|
54,4% |
|
6,8% |
|
2,8% |
|
10,1% |
|
21,4% |
|
-9,1% |
|
15,9% |
|
3,2% |
|
5,8% |
|
|
|
|
|
|
|
|
|
|
|
|
|
|
|
|
|
|
|
|
|
|
|
|
|
|
|
|
|
|
|
|
|
|
|
|
|
|
|
|
|
|
|
|||||||||||||
|
-38,6% |
|
37,6% |
|
23,9% |
|
-5,8% |
|
16,3% |
|
20,5% |
|
16,2% |
|
8,8% |
|
14,3% |
|
11,2% |
|
-9,1% |
|
14,7% |
|
1,4% |
|
6,0% |
|
Small Cap |
|
Portfolio |
|
TOPIX |
|
Portfolio |
|
Sm all Cap |
|
Europe |
|
HDY Equity |
|
Europe |
|
HDY Equity |
|
TOPIX |
|
Sm all Cap |
|
Portfolio |
|
Portfolio |
|
Portfolio |
|
-40,4% |
|
35,8% |
|
1,0% |
|
-7,5% |
|
18,4% |
|
22,3% |
|
8,7% |
|
5,4% |
|
13,1% |
|
22,2% |
|
-12,2% |
|
14,0% |
|
2,4% |
|
4,8% |
|
|
|
|
|
|
|
|
|
|
|
|
|
|
|
|
|
|
|
|
|
|
|
|
|
|
|
|
|
|
|
|
|
|
|
|
|
|
|
|
|
|
|
|||||||||||||
|
-40,4% |
|
34,0% |
|
23,1% |
|
-7,5% |
|
15,6% |
|
15,3% |
|
15,3% |
|
8,3% |
|
10,1% |
|
10,9% |
|
-9,4% |
|
14,5% |
|
0,7% |
|
5,2% |
|
Portfolio |
|
HDY Equity |
|
US S&P 500 |
|
Europe |
|
Portfolio |
|
Portfolio |
|
Portfolio |
|
Portfolio |
|
Portfolio |
|
Europe |
|
TOPIX |
|
HDY Equity |
|
Sm all Cap |
|
TOPIX |
|
-40,1% |
|
30,2% |
|
15,1% |
|
-8,8% |
|
17,1% |
|
23,6% |
|
8,2% |
|
1,9% |
|
9,0% |
|
13,7% |
|
-16,0% |
|
13,7% |
|
1,7% |
|
2,4% |
|
|
|
|
|
|
|
|
|
|
|
|
|
|
|
|
|
|
|
|
|
|
|
|
|
|
|
|
|
|
|
|
|
|
|
|
|
|
|
|
|
|
|
|||||||||||||
|
-43,3% |
|
32,6% |
|
20,9% |
|
-9,6% |
|
14,2% |
|
13,9% |
|
11,8% |
|
6,3% |
|
8,9% |
|
8,2% |
|
-9,8% |
|
11,2% |
|
-0,7% |
|
5,1% |
|
Europe |
|
Europe |
|
Portfolio |
|
TOPIX |
|
US S&P 500 |
|
HDY Equity |
|
MSCI EM |
|
HDY Equity |
|
Asia ex-Jp |
|
Sm all Cap |
|
Asia ex-Jp |
|
Asia ex-Jp |
|
MSCI EM |
|
Asia ex-Jp |
|
-38,5% |
|
28,6% |
|
11,1% |
|
-17,0% |
|
16,0% |
|
20,5% |
|
5,6% |
|
0,3% |
|
6,4% |
|
19,1% |
|
-12,0% |
|
11,0% |
|
0,3% |
|
3,6% |
|
|
|
|
|
|
|
|
|
|
|
|
|
|
|
|
|
|
|
|
|
|
|
|
|
|
|
|
-49,8% |
|
22,5% |
|
16,2% |
|
-14,3% |
|
13,6% |
|
-1,1% |
|
10,1% |
|
1,5% |
|
6,6% |
|
7,0% |
|
-9,9% |
|
11,2% |
|
-1,1% |
|
3,0% |
Asia ex-Jp |
|
US S&P 500 |
|
HDY Equity |
|
Asia ex-Jp |
|
HDY Equity |
|
Asia ex-Jp |
|
TOPIX |
|
Asia ex-Jp |
|
TOPIX |
|
US S&P 500 |
|
MSCI EM |
|
MSCI EM |
|
TOPIX |
|
MSCI EM |
-47,7% |
|
26,5% |
|
8,0% |
|
-14,6% |
|
14,0% |
|
6,2% |
|
10,3% |
|
-5,3% |
|
0,3% |
|
21,8% |
|
-9,7% |
|
10,2% |
|
-2,4% |
|
3,4% |
|
|
|
|
|
|
|
|
|
|
|
|
|
|
|
|
|
|
|
|
|
|
|
|
|
|
|
|
|
|
|
|
|
|
|
|
|
|
|
|
|
|||||||||||||
-50,8% |
|
1,5% |
|
11,7% |
|
-15,4% |
|
5,9% |
|
-6,5% |
|
7,4% |
|
-4,9% |
|
3,2% |
|
5,3% |
|
-10,0% |
|
7,5% |
|
-2,0% |
|
2,9% |
MSCI EM |
|
TOPIX |
|
Europe |
|
MSCI EM |
|
TOPIX |
|
MSCI EM |
|
Europe |
|
MSCI EM |
|
Europe |
|
HDY Equity |
|
Europe |
|
TOPIX |
|
Asia ex-Jp |
|
Europe |
-45,7% |
|
7,6% |
|
7,5% |
|
-12,5% |
|
20,9% |
|
3,8% |
|
5,2% |
|
-5,4% |
|
7,9% |
|
14,7% |
|
-10,0% |
|
5,2% |
|
-0,6% |
|
3,1% |
|
|
|
|
|
|
|
|
|
|
|
|
|
|
|
|
|
|
|
|
|
|
|
|
|
|
|
Source: MSCI, Refinitiv Datastream, Standard & Poor’s, TOPIX, J.P. Morgan Asset Management. Annualised return covers the period 2008 to 2018. HDY Equity: MSCI AC World High Dividend Yield Index; Small Cap: MSCI The World Small Cap Index. Hypothetical portfolio (for illustrative purposes only and should not be taken as a recommendation): 30% Europe; 20% S&P 500; 15% EM; 10% Asia ex-Japan; 10% TOPIX; 10% HDY equity and 5% small cap. All indices are total return. Past performance is not a reliable indicator of current and future results. Guide to the Markets - Europe. Data as of 30 June 2019.
71

vk.com/id446425943
Fixed income
Fixed income yields and interest rate risk |
GTM – Europe | 72 |
Current and historical yields for selected indices
% yield, since 2008*
24 |
|
|
|
|
|
|
|
|
|
|
|
|
|
|
|
|
|
|
|
|
|
|
|
|
|
|
|
|
|
How to |
||
|
|
|
|
|
|
|
|
|
|
|
|
|
|
|
|
|
|
|
|
|
|
|
|
|
|
|
||||||
20 |
|
|
|
|
|
|
|
|
|
|
|
|
|
|
|
|
|
|
|
|
|
|
|
|
|
|
|
|
|
interpret this |
||
|
|
|
|
|
|
|
|
|
|
|
|
|
|
|
|
|
|
|
|
|
|
|
|
|
|
|
|
|
chart |
|||
16 |
|
|
|
|
|
|
|
|
|
|
|
|
|
|
|
|
|
|
|
|
|
|
|
|
|
|
|
|
|
|
Max |
|
|
|
|
|
|
|
|
|
|
|
|
|
|
|
|
|
|
|
|
|
|
|
|
|
|
|
|
|
|
|
|
|
|
12 |
|
|
|
|
|
|
|
|
|
|
|
|
|
|
|
|
|
|
|
|
|
|
|
|
|
|
|
|
|
|
Average |
|
|
|
|
|
|
|
|
|
|
|
|
|
|
|
|
|
|
|
|
|
|
|
|
|
|
|
|
|
|
|
|||
|
|
|
|
|
|
|
|
|
|
|
|
|
|
|
|
|
|
|
|
|
|
|
|
|
|
|
|
|
|
|||
8 |
|
|
|
|
|
|
|
|
|
|
|
|
|
|
|
|
|
|
|
|
|
|
|
|
|
|
|
|
|
|
Current |
|
|
|
|
|
|
|
|
|
|
|
|
|
|
|
|
|
|
|
|
|
|
|
|
|
|
|
|
||||||
|
|
|
|
|
|
|
|
|
|
|
|
|
|
|
|
|
|
|
|
|
|
|
|
|
|
|
||||||
4 |
|
|
|
|
|
|
|
|
|
|
|
|
|
|
|
|
|
|
|
|
|
|
|
|
|
|
|
|
|
|
Min |
|
|
|
|
|
|
|
|
|
|
|
|
|
|
|
|
|
|
|
|
|
|
|
|
|
|
|
|
|
|
|
|||
|
|
|
|
|
|
|
|
|
|
|
|
|
|
|
|
|
|
|
|
|
|
|
|
|
|
|
||||||
|
|
|
|
|
|
|
|
|
|
|
|
|
|
|
|
|
|
|
|
|
|
|
|
|
|
|
|
|
|
|
|
|
0 |
|
|
|
|
|
|
|
|
|
|
|
|
|
|
|
|
|
|
|
|
|
|
|
|
|
|
|
|
|
|
|
|
|
|
|
|
|
|
|
|
|
|
|
|
|
|
|
|
|
|
|
|
|
|
|
|
|
|
|
|
|
|
|
|
|
|
|
|
|
|
|
|
|
|
|
|
|
|
|
|
|
|
|
|
|
|
|
|
|
|
|
|
|
|
|
|
|
|
|
Euro |
|
Euro |
|
|
|
|
|
|
|
|
|
|
|
|
|
|
|
|
|
|
|
|
|
|
|
|
|
|
|||
-4 |
|
|
US Treasury: |
Euro inv. |
US inv. |
Euro high |
US high |
Global |
|
EMD |
EMD |
|||||||||||||||||||||
|
Gov.: |
Gov.: |
|
|||||||||||||||||||||||||||||
|
|
all years |
grade |
grade |
|
yield |
|
yield |
convertibles |
(USD Sov.) (Local Sov.) |
||||||||||||||||||||||
|
1-3 years |
10+ years |
|
|
||||||||||||||||||||||||||||
|
|
|
|
|
|
|
|
|
|
|
|
|
|
|
|
|
|
|
|
|
|
|
|
|
|
|
||||||
Illustration of the impact a 1% rise in local interest rates may have on selected indices
% change, assumes a parallel shift in the yield curve and spreads are maintained 4
0 |
|
|
|
|
|
|
|
|
|
|
|
|
|
|
|
|
|
|
|
|
|
|
|
|
|
|
|
-4 |
|
|
|
|
|
|
|
|
|
|
|
|
|
-8 |
|
|
|
|
|
|
|
|
|
|
|
|
|
-12 |
|
|
|
|
|
|
|
|
|
|
|
Price return |
|
|
|
|
|
|
|
|
|
|
|
|
|||
-16 |
|
|
|
|
|
|
|
|
|
|
|
Total return |
|
|
|
|
|
|
|
|
|
|
|
|
|||
Euro |
Euro |
US |
Euro inv. |
US inv. |
Euro high |
US high |
Global |
EMD |
|
EMD |
|||
-20 |
|
||||||||||||
Gov.: |
Gov.: |
Treasury: |
grade |
grade |
yield |
yield |
convertibles (USD Sov.) |
(Local Sov.) |
|||||
|
1-3 years |
10+ years |
|||||||||||
|
all years |
|
|
|
|
|
|
|
|
|
|
||
Source: (All charts) Refinitiv Datastream, J.P. Morgan Asset Management.
*Historical yield range is since Jan 2008, convertibles is since Dec 2008.
Fixed income sectors shown are Europe Gov. 1-3: Bloomberg Barclays Europe Government Agg. 1-3 Years; Europe Gov. 10+: Bloomberg Barclays Europe Government Agg. 10+ Years; US Treasury: Bloomberg Barclays US Agg. Treasury; Euro inv. grade: Bloomberg Barclays Euro Agg.
– Corporates; US inv. grade: Bloomberg Barclays US Corporate Investment Grade; Euro high yield: BofA/Merrill Lynch Euro Non-Financial High Yield Constrained; US high yield: BofA/Merrill Lynch US High Yield Constrained; Global convertibles: Bloomberg Barclays Credit/Rate Sensitive; EMD USD Sov.: J.P. Morgan EMBI Global; EMD Local Sov.: JPM GBI-EM Composite.
For illustrative purposes only. Change in bond price is calculated using both duration and convexity, with the exception of Convertibles, which is historical change. Past performance is not a reliable indicator of current and future results.
Guide to the Markets - Europe.
Data as of 30 June 2019.
72

vk.com/id446425943
Global government bond yields and inflation expectations |
GTM – Europe | 73 |
|
Nominal 10-year government bond yields |
10-year government bond breakeven inflation rates |
|
|
% yield |
|
|
|
|
|
|
|
|
|
|
% yield |
|
|
|
|
|
|
|
|
|
|
|
7 |
|
|
|
|
|
|
|
|
|
|
4,5 |
|
|
|
|
|
|
|
UK |
|
|
|
|
|
|
|
|
|
|
|
|
US |
|
|
|
|
|
|
|
|
|
|
|
|
|
6 |
|
|
|
|
|
|
|
|
UK |
|
4,0 |
|
|
|
|
|
|
|
US |
|
|
|
|
|
|
|
|
|
|
|
|
|
|
|
|
|
|
|
|
|
|
|
||
|
|
|
|
|
|
|
|
|
Germany |
|
|
|
|
|
|
|
|
Germany |
|
|||
|
|
|
|
|
|
|
|
|
|
|
|
|
|
|
|
|
|
|
||||
|
5 |
|
|
|
|
|
|
|
|
|
|
3,5 |
|
|
|
|
|
|
|
|
|
|
|
|
|
|
|
|
|
|
|
|
|
|
|
|
|
|
|
|
|
|
|
|
|
|
|
|
|
|
|
|
|
|
|
|
|
3,0 |
|
|
|
|
|
|
|
|
|
|
|
4 |
|
|
|
|
|
|
|
|
|
|
|
|
|
|
|
|
|
|
|
|
|
|
|
|
|
|
|
|
|
|
|
|
|
2,5 |
|
|
|
|
|
|
|
|
|
|
|
3 |
|
|
|
|
|
|
|
|
|
|
|
|
|
|
|
|
|
|
|
|
|
income |
|
|
|
|
|
|
|
|
|
|
|
2,0 |
|
|
|
|
|
|
|
|
|
|
2 |
|
|
|
|
|
|
|
|
|
|
1,5 |
|
|
|
|
|
|
|
|
|
|
|
|
|
|
|
|
|
|
|
|
|
|
|
|
|
|
|
|
|
|
|
|
|
|
Fixed |
1 |
|
|
|
|
|
|
|
|
|
|
1,0 |
|
|
|
|
|
|
|
|
|
|
|
|
|
|
|
|
|
|
|
|
|
|
|
|
|
|
|
|
|
|
|
|
|
|
0 |
|
|
|
|
|
|
|
|
|
|
0,5 |
|
|
|
|
|
|
|
|
|
|
|
|
|
|
|
|
|
|
|
|
|
|
|
|
|
|
|
|
|
|
|
|
|
|
-1 |
|
|
|
|
|
|
|
|
|
|
0,0 |
|
|
|
|
|
|
|
|
|
|
|
'98 |
'00 |
'02 |
'04 |
'06 |
'08 |
'10 |
'12 |
'14 |
'16 |
'18 |
'98 |
'00 |
'02 |
'04 |
'06 |
'08 |
'10 |
'12 |
'14 |
'16 |
'18 |
Source: (All charts) Bloomberg, J.P. Morgan Asset Management. Government bond breakeven inflation rates are the difference in yield between nominal and inflationprotected government bonds. Past performance is not a reliable indicator of current and future results. Guide to the Markets - Europe. Data as of 30 June 2019.
73

vk.com/id446425943
US yield curve |
GTM – Europe | 74 |
|
Yield curve |
|
|
|
|
|
|
Recession |
Yield curve inversion and recession |
|
||||
|
%, 10-year Treasury yield minus 2-year Treasury yield |
|
Number of months from |
|
|
|||||||||
|
3 |
|
|
|
|
|
|
|
|
|
|
Curve |
|
|
|
|
|
|
|
|
|
|
|
|
|
|
|
|
|
|
|
|
|
|
|
|
|
|
|
|
|
inversion |
|
|
|
|
|
|
|
|
|
|
|
|
|
|
to S&P 500 |
S&P 500 |
Curve |
|
|
|
|
|
|
|
|
|
|
|
Yield curve |
peak |
peak to |
inversion |
|
2 |
|
|
|
|
|
|
|
|
|
inversion |
before |
start of |
to |
|
|
|
|
|
|
|
|
|
|
date |
recession |
recession |
recession |
|
|
|
|
|
|
|
|
|
|
|
|
||||
|
|
|
|
|
|
|
|
|
|
|
Aug ’78 |
18 |
0 |
18 |
|
1 |
|
|
|
|
|
|
|
|
|
Sep ’80 |
3 |
8 |
11 |
|
|
|
|
|
|
|
|
|
|
|
||||
income |
|
|
|
|
|
|
|
|
|
|
Dec ’88 |
19 |
1 |
20 |
0 |
|
|
|
|
|
|
|
|
|
|
|
|
|
|
|
|
|
|
|
|
|
|
|
|
|
|
|
|
|
|
|
|
|
|
|
|
|
|
|
|
May ’98 |
22 |
12 |
34 |
Fixed |
-1 |
|
|
|
|
|
|
|
|
|
Dec ’05 |
22 |
3 |
25 |
|
|
|
|
|
|
|
|
|
|
|||||
|
|
|
|
|
|
|
|
|
|
|
|
|
|
|
|
|
|
|
|
|
|
|
|
|
|
Median |
19 |
3 |
20 |
|
-2 |
|
|
|
|
|
|
|
|
|
Average |
17 |
5 |
22 |
|
'78 |
'82 |
'86 |
'90 |
'94 |
'98 |
'02 |
'06 |
'10 |
'14 |
'18 |
|
|
|
Source: (All charts) Bloomberg, Federal Reserve, Refinitiv Datastream, J.P. Morgan Asset Management. Periods of “recession” are defined using US National Bureau of Economic Research (NBER) business cycle dates. Past performance is not a reliable indicator of current and future results. Guide to the Markets - Europe.
Data as of 30 June 2019.
74

vk.com/id446425943
US investment-grade bonds |
GTM – Europe | 75 |
US investment-grade spread |
US investment-grade leverage measures |
|
%, option-adjusted spread over local government bond yield |
|
|
x, leverage (LHS); x, interest coverage ratio (RHS) |
|
|
||||||||||||
|
7 |
|
|
|
|
|
|
|
|
|
2,6 |
|
|
|
|
|
|
18 |
|
6 |
|
|
|
|
|
|
|
|
|
2,4 |
|
|
|
|
|
|
|
|
|
|
|
|
|
|
|
|
|
|
|
|
|
|
|
|
16 |
|
|
|
|
|
|
|
|
|
|
|
|
|
|
|
|
|
|
|
|
|
|
|
|
|
|
|
|
|
|
|
2,2 |
|
|
|
|
|
|
|
|
5 |
|
|
|
|
|
|
|
|
|
|
|
|
|
|
|
|
|
|
|
|
|
|
|
|
|
|
|
|
2,0 |
|
|
|
|
|
|
14 |
|
4 |
|
|
|
|
|
|
|
|
|
1,8 |
|
|
|
|
|
|
|
|
|
|
|
|
|
|
|
|
|
|
|
|
|
|
|
|
|
|
|
|
|
|
|
|
|
|
|
|
|
|
|
|
|
|
|
|
12 |
income |
3 |
|
|
|
|
|
|
|
|
|
1,6 |
|
|
|
|
|
|
|
|
|
|
|
|
|
|
|
|
|
|
|
|
|
|
|
|
||
|
|
|
|
|
|
|
|
30 Jun 2019: |
1,4 |
|
|
|
|
|
|
10 |
||
Fixed |
2 |
|
|
|
|
|
|
|
|
|
|
|
|
|
|
|
||
|
|
|
|
|
|
|
|
1,2% |
|
|
|
|
|
|
|
|
||
|
|
|
|
|
|
|
|
|
|
|
|
|
|
|
|
|
||
|
|
|
|
|
|
|
|
|
|
1,2 |
|
|
|
|
Interest coverage |
|||
|
|
|
|
|
|
|
|
|
|
|
|
|
|
|
|
|||
|
1 |
|
|
|
|
|
|
|
|
|
|
|
|
|
|
|
|
8 |
|
|
|
|
|
|
|
|
|
|
1,0 |
|
|
|
|
|
|
|
|
|
|
|
|
|
|
|
|
|
|
|
|
|
|
|
|
|
|
|
|
0 |
|
|
|
|
|
|
|
|
|
0,8 |
|
|
|
|
|
|
6 |
|
'00 |
'02 |
'04 |
'06 |
'08 |
'10 |
'12 |
'14 |
'16 |
'18 |
'04 |
'06 |
'08 |
'10 |
'12 |
'14 |
'16 |
'18 |
Source: (Left) Bloomberg Barclays, Refinitiv Datastream, J.P. Morgan Asset Management. Index is Bloomberg Barclays US Corporate Investment Grade. (Right) J.P. Morgan Securities, J.P. Morgan Asset Management. Net leverage is net debt divided by earnings before interest, tax, depreciation and amortisation (EBITDA). Interest coverage ratio is EBITDA divided by interest expense. Past performance is not a reliable indicator of current and future results. Guide to the Markets - Europe.
Data as of 30 June 2019.
75
vk.com/id446425943
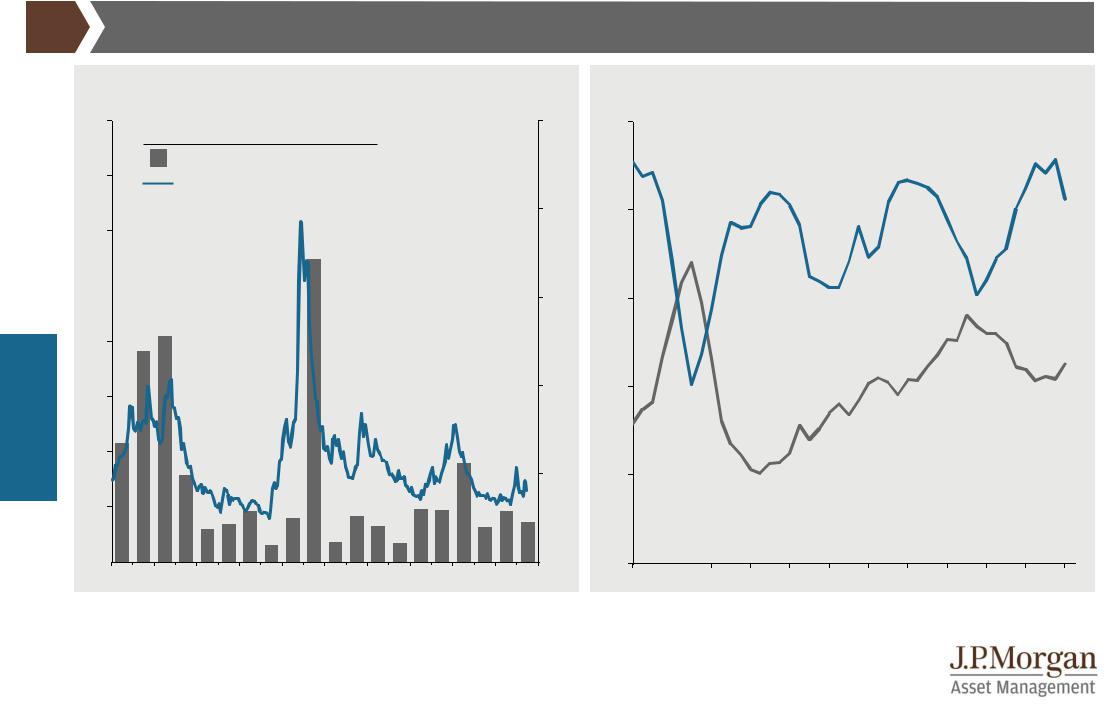
US high yield bonds |
GTM – Europe | 76 |
US high yield spread and defaults |
US high yield leverage measures |
|
%, default rate (LHS); %, option-adjusted spread (RHS) |
|
|
x, leverage and interest coverage ratio |
|
|
|
|
|
|
||||||||||||
|
16 |
|
|
|
|
Latest |
|
|
|
25 |
5,0 |
|
|
|
|
|
|
|
|
|
|
|
|
|
|
|
|
|
|
|
|
|
|
|
|
|
|
|
|
Interest coverage ratio |
|
||||
|
|
|
Default rate* (LHS) |
1,5% |
|
|
|
|
|
|
|
|
|
|
|
|
||||||
|
|
|
|
|
|
|
|
|
|
|
|
|
|
|
|
|
|
|
||||
|
14 |
|
Spread (RHS) |
|
4,1% |
|
|
|
|
|
|
|
|
|
|
|
|
|
|
|
|
|
|
|
|
|
|
|
|
|
|
|
|
|
|
|
|
|
|
|
|
|
|||
|
|
|
|
|
|
|
|
|
|
20 |
4,5 |
|
|
|
|
|
|
|
|
|
|
|
|
12 |
|
|
|
|
|
|
|
|
|
|
|
|
|
|
|
|
|
|
|
|
|
|
10 |
|
|
|
|
|
|
|
|
15 |
4,0 |
|
|
|
|
|
|
|
|
|
|
|
|
|
|
|
|
|
|
|
|
|
|
|
|
|
|
|
|
|
|
|
|
||
income |
8 |
|
|
|
|
|
|
|
|
|
|
|
|
|
|
|
|
|
|
|
|
|
6 |
|
|
|
|
|
|
|
|
10 |
3,5 |
|
|
|
|
|
|
|
Net leverage |
|
|||
|
|
|
|
|
|
|
|
|
|
|
|
|
|
|
|
|
||||||
|
|
|
|
|
|
|
|
|
|
|
|
|
|
|
|
|
|
|
||||
Fixed |
4 |
|
|
|
|
|
|
|
|
|
|
|
|
|
|
|
|
|
|
|
|
|
|
|
|
|
|
|
|
|
|
|
|
|
|
|
|
|
|
|
|
|
|
|
|
|
|
|
|
|
|
|
|
|
|
5 |
3,0 |
|
|
|
|
|
|
|
|
|
|
|
|
2 |
|
|
|
|
|
|
|
|
|
|
|
|
|
|
|
|
|
|
|
|
|
|
0 |
|
|
|
|
|
|
|
|
0 |
2,5 |
|
|
|
|
|
|
|
|
|
|
|
|
'00 |
'02 |
'04 |
'06 |
'08 |
'10 |
'12 |
'14 |
'16 |
'18 |
'08 |
'09 |
'10 |
'11 |
'12 |
'13 |
'14 |
'15 |
'16 |
'17 |
'18 |
'19 |
Source: (Left) BofA/Merrill Lynch, J.P. Morgan Securities Research, J.P. Morgan Asset Management. HY spread is using the BofA/Merrill Lynch US High Yield Constrained index. Default rates are defined as the par value percentage of the total market trading at or below 50% of par value and include any Chapter 11 filing, prepackaged filing or missed interest payments. *2019 default rate is for the last 12 months. (Right) J.P. Morgan Economic Research, J.P. Morgan Asset Management. Net leverage is net debt divided by earnings before interest, tax, depreciation and amortisation (EBITDA). Interest coverage ratio is EBITDA divided by interest expense. Past performance is not a reliable indicator of current and future results. Guide to the Markets - Europe. Data as of 30 June 2019.
76

vk.com/id446425943
Europe and UK investment-grade bonds |
GTM – Europe | 77 |
Euro and UK investment-grade spreads
|
%, option-adjusted spread over local government bond yield |
|
|
|||||||
|
7 |
|
|
|
|
|
|
|
|
|
|
6 |
|
|
|
|
|
|
|
|
|
|
5 |
|
|
|
|
|
|
|
|
|
|
4 |
|
|
|
|
|
|
|
|
|
income |
3 |
|
|
|
|
|
|
|
|
|
|
|
|
|
|
|
|
|
30 Jun 2019: |
||
|
|
|
|
|
|
|
|
|
1,5% |
|
Fixed |
2 |
|
|
|
|
|
|
|
|
|
|
|
|
|
|
|
|
|
|
||
|
|
|
|
|
|
|
|
|
|
|
|
1 |
|
|
|
|
|
|
|
|
|
|
|
|
|
|
|
|
|
|
30 Jun 2019: |
|
|
0 |
|
|
|
|
|
|
|
|
1,1% |
|
|
|
|
|
|
|
|
|
|
|
|
'00 |
'02 |
'04 |
'06 |
'08 |
'10 |
'12 |
'14 |
'16 |
'18 |
Euro investment-grade leverage measures
x, leverage (LHS); x, interest coverage ratio (RHS) |
|
|
|
||||||
4,0 |
Net leverage |
|
|
|
Interest coverage |
14 |
|||
|
|
|
|
|
|||||
|
|
|
|
|
|
|
|
|
13 |
3,5 |
|
|
|
|
|
|
|
|
|
|
|
|
|
|
|
|
|
|
12 |
3,0 |
|
|
|
|
|
|
|
|
11 |
|
|
|
|
|
|
|
|
|
|
2,5 |
|
|
|
|
|
|
|
|
10 |
|
|
|
|
|
|
|
|
|
|
|
|
|
|
|
|
|
|
|
9 |
2,0 |
|
|
|
|
|
|
|
|
|
|
|
|
|
|
|
|
|
|
8 |
1,5 |
|
|
|
|
|
|
|
|
7 |
'02 |
'04 |
'06 |
'08 |
'10 |
'12 |
'14 |
'16 |
'18 |
'20 |
Source: (Left) Bloomberg Barclays, Refinitiv Datastream, J.P. Morgan Asset Management. Indices are Euro inv. grade: Bloomberg Barclays Euro Agg. – Corporates; UK inv. grade: Bloomberg Barclays Sterling Agg. – Corporates. (Right) J.P. Morgan Securities, J.P. Morgan Asset Management. Net leverage is net debt divided by earnings before interest, tax, depreciation and amortisation (EBITDA). Interest coverage ratio is EBITDA divided by interest expense. Past performance is not a reliable indicator of current and future results. Guide to the Markets - Europe. Data as of 30 June 2019.
77

vk.com/id446425943
Europe high yield bonds |
GTM – Europe | 78 |
European high yield spread and defaults |
European high yield leverage measures |
|
%, default rate (LHS); %, option-adjusted spread (RHS) |
|
|
|
x, leverage and interest coverage ratio |
|
|
|
|
|
|
|
|
|||||||||||||
|
40 |
|
|
|
|
|
|
|
Latest |
25 |
6,5 |
|
|
|
|
|
|
|
|
|
|
|
|
|
|
|
|
20 |
|
34% |
|
|
|
|
|
|
|
|
|
|
|
|
|
|
|
Interest coverage ratio |
|||||||
|
|
|
|
|
Default rate* (LHS) |
1,4% |
|
|
|
|
|
|
|
|
|
|
|
|||||||||
|
18 |
|
|
|
|
|
|
|
|
|
|
|
|
|
|
|
|
|
|
|
|
|||||
|
|
|
|
|
Spread (RHS) |
|
3,7% |
|
6,0 |
|
|
|
|
|
|
|
|
|
|
|
|
|
|
|||
|
|
|
|
|
|
|
|
|
|
|
|
|
|
|
|
|
|
|
|
|
|
|||||
|
|
|
|
|
|
|
|
|
|
|
|
|
|
|
|
|
|
|
|
|
|
|
|
|
|
|
|
16 |
|
|
|
|
|
|
|
|
|
20 |
|
|
|
|
|
|
|
|
|
|
|
|
|
|
|
|
14 |
|
|
|
|
|
|
|
|
|
|
5,5 |
|
|
|
|
|
|
|
|
|
|
|
|
|
|
|
|
|
|
|
|
|
|
|
|
|
|
|
|
|
|
|
|
|
|
|
|
|
|
|
|
|
|
12 |
|
|
|
|
|
|
|
|
|
15 |
5,0 |
|
|
|
|
|
|
|
|
|
|
|
|
|
|
|
|
|
|
|
|
|
|
|
|
|
|
|
|
|
|
|
|
|
|
|
|
|
|
|
|
|
income |
10 |
|
|
|
|
|
|
|
|
|
|
|
|
|
|
|
|
|
|
|
|
|
|
|
|
|
8 |
|
|
|
|
|
|
|
|
|
10 |
4,5 |
|
|
|
|
|
|
|
|
|
|
|
|
|
|
|
|
|
|
|
|
|
|
|
|
|
|
|
|
|
|
|
|
|
|
|
|
|
|
|
|||
|
|
|
|
|
|
|
|
|
|
|
|
|
|
|
|
|
|
|
|
|
|
|
|
|
||
Fixed |
6 |
|
|
|
|
|
|
|
|
|
|
4,0 |
|
|
|
|
|
|
|
|
|
|
|
|
|
|
|
|
|
|
|
|
|
|
|
|
|
|
|
|
|
|
|
|
|
|
|
|
|
|
|
||
|
|
|
|
|
|
|
|
|
|
|
|
|
|
|
|
|
|
|
|
|
|
|
|
|
|
|
|
4 |
|
|
|
|
|
|
|
|
|
5 |
|
|
|
|
|
|
|
|
|
|
|
|
|
|
|
|
2 |
|
|
|
|
|
|
|
|
|
|
3,5 |
|
|
|
|
|
|
|
|
|
|
|
|
|
|
|
|
|
|
|
|
|
|
|
|
|
|
|
|
|
|
|
|
|
|
|
|
|
Net leverage |
|||
|
|
|
|
|
|
|
|
|
|
|
|
|
|
|
|
|
|
|
|
|
|
|
|
|||
|
0 |
|
|
|
|
|
|
|
|
|
0 |
3,0 |
|
|
|
|
|
|
|
|
|
|
|
|
|
|
|
'00 |
'02 |
'04 |
'06 |
'08 |
'10 |
'12 |
'14 |
'16 |
'18 |
|
'05 |
'06 |
'07 |
'08 |
'09 |
'10 |
'11 |
'12 |
'13 |
'14 |
'15 |
'16 |
'17 |
'18 |
'19 |
Source: (Left) BofA/Merrill Lynch, Refinitiv Datastream, J.P. Morgan Asset Management. Spread to worst is BofA/Merrill Lynch Euro Non-Financial High Yield Constrained. Default rates are reported by JPMAM GFICC Quantitative Research Group. Defaults are defined as a bond rated as Ca or lower. The calculation universe is based on par value percentage of the BofA ML Global High Yield Index (HW00) that is covered by Moody’s and filtered for EUR Developed Markets ExFinancial. *2019 default rate is for the last 12 months. (Right) J.P. Morgan Securities Research, J.P. Morgan Asset Management. Net leverage is net debt divided by earnings before interest, tax, depreciation and amortisation (EBITDA). Interest coverage ratio is EBITDA divided by interest expense. Past performance is not a reliable indicator of current and future results. Guide to the Markets - Europe. Data as of 30 June 2019.
78

vk.com/id446425943
Fixed income
Emerging markets bonds |
GTM – Europe | 79 |
Real 10-year government bond yields |
Corporate and sovereign EMD spreads |
% yield, local currency
5
Developed markets
Emerging markets
4
3
2
1
0 
-1
-2
%, spread over 10-year US Treasury
10 |
|
|
|
9 |
|
Average |
Latest |
|
|
since 2008 |
|
|
EM sovereigns local |
4,2% |
4,4% |
8 |
EM sovereigns USD |
3,6% |
3,8% |
|
EM corporates USD |
3,6% |
3,2% |
7 |
|
|
|
6 |
|
|
|
5 |
|
|
|
4 |
|
|
|
3 |
|
|
|
2
'08 |
'09 |
'10 |
'11 |
'12 |
'13 |
'14 |
'15 |
'16 |
'17 |
'18 |
'19 |
Source: (Left) Bloomberg, J.P. Morgan Asset Management. Real yield is calculated by using nominal yield less current CPI for the respective countries.
(Right) J.P. Morgan DataQuery, J.P. Morgan Asset Management. EM sovereign local currency is the J.P. Morgan GBI-EM; EM sovereigns USD is the J.P. Morgan EMBIG; EM corporate USD is the J.P. Morgan CEMBI. Past performance is not a reliable indicator of current and future results. Guide to the Markets - Europe. Data as of 30 June 2019.
79

vk.com/id446425943
Fixed income
Fixed income focus: Negative and low-yielding government bonds |
GTM – Europe | 80 |
Developed market government bond yields
% of BofA/Merrill Lynch Global Government Bond Index 80
70 |
|
of government bonds below 1% |
of government bonds below 0%
60
50
40
30
20
10
0 |
|
|
|
|
|
|
|
|
|
|
Jan ’14 |
Jul ’14 |
Jan ’15 |
Jul ’15 |
Jan ’16 |
Jul ’16 |
Jan ’17 |
Jul ’17 |
Jan ’18 |
Jul ’18 |
Jan ’19 |
Source: Bloomberg, BofA/Merrill Lynch, J.P. Morgan Asset Management. Index shown is the BofA/ML Global Government Bond index. Past performance is not a reliable indicator of current and future results. Guide to the Markets - Europe. Data as of 30 June 2019.
80