

J.P. Morgan - Guide to the Markets_watermark
.pdfvk.com/id446425943
US focus: Trade and tariffs |
GTM – Europe | 21 |
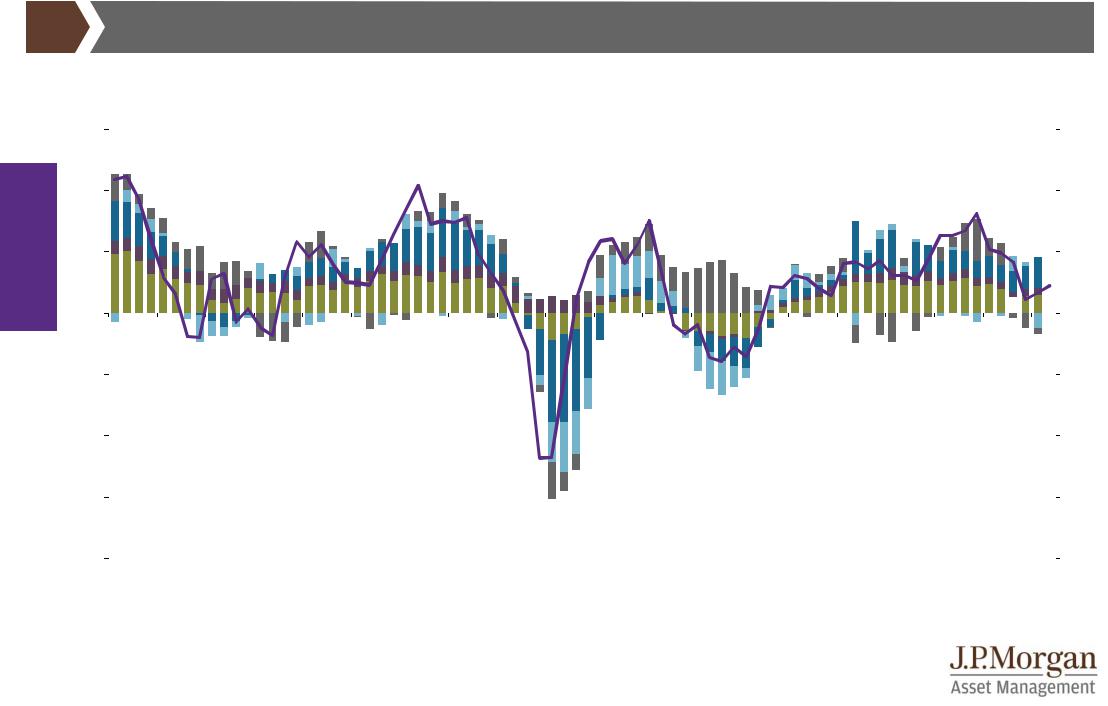
US effective import tariff rate |
Tariffs on US imports from China |
|
%, effective tariff rate (tariffs collected as % of all imported goods) |
USD billions |
|
|
|||||
|
22 |
|
|
|
|
|
160 |
|
|
|
|
|
|
|
|
|
Capital goods |
Consumption goods |
Intermediate goods |
|
20 |
|
|
|
|
|
140 |
|
|
economy |
|
|
|
|
|
|
|
|
|
18 |
|
|
|
|
|
|
|
|
|
16 |
|
|
|
|
|
120 |
|
|
|
|
|
|
|
|
|
|
|
||
|
|
|
|
|
|
|
|
|
|
Global |
14 |
|
|
|
|
|
100 |
|
|
|
|
|
|
|
|
|
|
||
|
|
|
|
|
|
|
|
|
|
|
12 |
|
|
|
|
|
|
|
|
|
|
|
|
|
Proposed: 25% on global autos |
80 |
|
|
|
|
10 |
|
|
|
|
and auto part imports |
|
|
|
|
8 |
|
|
|
|
Proposed: 25% on |
60 |
|
|
|
|
|
|
|
|
|
|
||
|
|
|
|
|
|
|
|
|
|
|
|
|
|
|
|
remaining China imports |
|
|
|
|
6 |
|
|
|
|
|
40 |
|
|
|
|
|
|
|
|
|
|
|
|
|
4 |
|
|
|
|
Currently effective |
|
|
|
|
|
|
|
|
|
|
|
|
|
|
2 |
|
|
|
|
|
20 |
|
|
|
|
|
|
|
|
|
|
|
|
|
0 |
|
|
|
|
|
0 |
|
|
|
1910 |
1920 |
1930 1940 |
1950 |
1960 1970 |
1980 1990 2000 2010 |
In effect |
|
Proposed |
Source: (Left) Esteban Ortiz-Ospina and Max Roser "International Trade", US Census Bureau, US International Trade Commission, J.P. Morgan Asset Management. Currently effective and proposed data are JPMAM calculations. Currently effective tariffs includes tariffs on washing machines, solar panels, steel and aluminium, as well as tariffs implemented on approximately USD 250 billion of China imports. Remaining China imports and global autos (including auto parts) are measures proposed on approximately USD 290 billion worth of goods for each. (Right) United Nations, US International Trade Commission, US Trade Representative, J.P. Morgan Asset Management. Analysis classifies each individual product that the US imports from China to the HTS-8 level that either appears on the 2018 & 2019 tariff lists published in the US Federal Register or has been threatened with higher tariffs into its appropriate System of National Accounts group and aggregates these categories by value of
21 imports from 2017. Past performance is not a reliable indicator of current and future results. Guide to the Markets - Europe. Data as of 30 June 2019.
vk.com/id446425943
Global economy
|
|
|
Eurozone GDP |
|
|
|
|
|
|
|
|
|
|
|
|
|
|
|
|
GTM – Europe |
| 22 |
|||||||
|
|
|
|
|
|
|
|
|
|
|
|
|
|
|
|
|
|
|
|
|||||||||
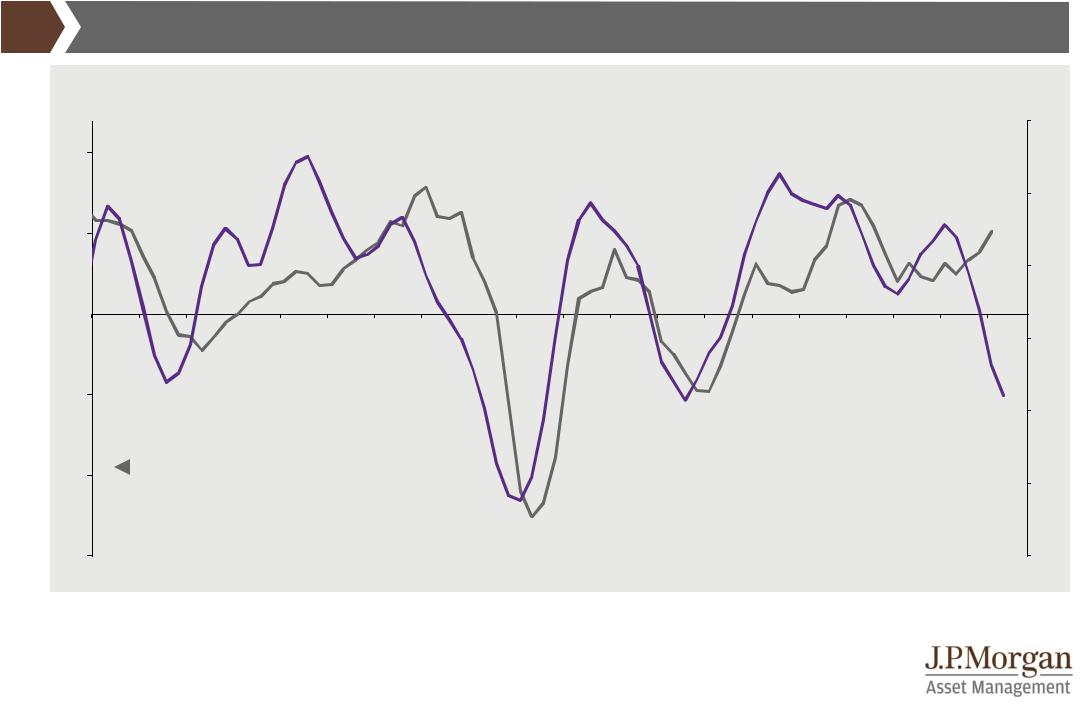
Contribution to eurozone real GDP growth and composite PMI |
|
|
|
|
|
|
|
|
|
|
|
|
|
|
|
|||||||||||||
% change year on year (LHS); index level (RHS) |
|
|
|
|
|
|
|
|
|
|
|
|
|
|
|
|
|
|
|
|||||||||
6 |
|
|
|
|
|
|
|
|
|
|
|
|
|
|
|
|
|
|
|
|
|
|
|
|
|
|
|
65 |
|
|
|
|
|
|
|
|
|
|
|
|
|
|
|
|
|
|
|
|
|
|
|
|
|
||||
4 |
|
|
|
|
|
|
|
|
|
|
|
|
|
|
|
|
|
|
|
|
|
|
|
|
|
|
|
60 |
2 |
|
|
|
|
|
|
|
|
|
|
|
|
|
|
|
|
|
|
|
|
|
|
|
|
|
|
|
55 |
0 |
|
|
|
|
|
|
|
|
|
|
|
|
|
|
|
|
|
|
|
|
|
|
|
|
|
|
|
50 |
|
|
|
|
|
|
|
|
|
|
|
|
|
|
|
|
|
|
|
|
|
|
|
|
|
|
|
||
|
|
|
|
|
|
|
|
|
|
|
|
|
|
|
|
|
|
|
|
|
|
|
|
|
|
|
||
-2 |
|
|
|
|
|
|
|
|
|
|
|
|
|
|
|
|
|
|
|
|
|
|
|
|
|
|
|
45 |
|
|
|
|
|
|
|
|
|
Net exports |
|
|
|
|
|
|
|
|
|
|
|
|
|
|
|
|
|
|
|
|
|
|
|
|
|
|
|
|
Change in inventories |
|
|
|
|
|
|
|
|
|
|
|
|
|
|
|
|
|
||
|
|
|
|
|
|
|
|
|
|
|
|
|
|
|
|
|
|
|
|
|
|
|
|
|
|
|||
-4 |
|
|
|
|
|
|
|
|
Investment |
|
|
|
|
|
|
|
|
|
|
|
|
|
|
|
|
|
40 |
|
|
|
|
|
|
|
|
|
|
|
|
|
|
|
|
|
|
|
|
|
|
||||||||
|
|
|
|
|
|
|
|
|
|
|
|
|
|
|
|
|
|
|
|
|
|
|
|
|
|
|
||
|
|
|
|
|
|
|
|
|
Government |
|
|
|
|
|
|
|
|
|
|
|
Average |
1Q19 |
|
|
|
|||
|
|
|
|
|
|
|
|
|
|
|
|
|
|
|
|
|
|
|
|
|
|
|
||||||
|
|
|
|
|
|
|
|
|
|
|
|
|
|
|
|
|
|
|
|
|
|
|
|
|
||||
-6 |
|
|
|
|
|
|
|
|
Consumption |
|
|
|
|
|
|
|
|
|
|
since 2000 |
|
|
35 |
|||||
|
|
|
|
|
|
|
|
|
|
|
|
|
|
|
|
|
|
|
|
|
|
|
||||||
|
|
|
|
|
|
|
|
Composite PMI (RHS) |
|
|
|
|
|
|
|
|
|
|
1,4% |
1,2% |
|
|
||||||
-8 |
|
|
|
|
|
|
|
|
|
|
|
|
|
|
|
|
|
|
|
|
30 |
|||||||
|
|
|
|
|
|
|
|
|
|
|
|
|
|
|
|
|
|
|
|
|||||||||
|
|
|
|
|
|
|
|
|
|
|
|
|
|
|
|
|
|
|
|
|
|
|
|
|
|
|
||
|
|
|
|
|
|
|
|
|
|
|
|
|
|
|
|
|
|
|
|
|
|
|
|
|
||||
'00 |
'01 |
'02 |
'03 |
'04 |
'05 |
'06 |
'07 |
'08 |
'09 |
'10 |
'11 |
'12 |
'13 |
'14 |
'15 |
'16 |
'17 |
'18 |
|
|
'19 |
|
|
|||||
|
|
|
|
|
|
|
|
|
|
|
|
|
|
|
|
|
|
|
|
|
|
|
|
|
|
|
|
|
Source: Eurostat, Markit, Refinitiv Datastream, J.P. Morgan Asset Management. PMI is Purchasing Managers’ Index where a score of 50 indicates that economic activity is neither expanding nor contracting, above 50 indicates expansion. PMI data is shown with quarterly frequency. Past performance is not a reliable indicator of current and future results. Guide to the Markets - Europe. Data as of 30 June 2019.
22
vk.com/id446425943
Eurozone corporates
Eurozone future capex intentions and business investment
% change year on year (LHS); index level, four-quarter moving average (RHS)
10
economyGlobal |
5 |
|
|
|
0 |
|
|
-5
-10 |
Business investment |
|
GTM – Europe | 23
60
Future capex intentions 
40
20
0
-20
-40
-15 |
|
|
|
|
|
|
|
|
|
|
|
|
|
|
|
|
|
|
-60 |
'00 |
'01 |
'02 |
'03 |
'04 |
'05 |
'06 |
'07 |
'08 |
'09 |
'10 |
'11 |
'12 |
'13 |
'14 |
'15 |
'16 |
'17 |
'18 |
'19 |
Source: Eurostat, IFO, Refinitiv Datastream, J.P. Morgan Asset Management. Past performance is not a reliable indicator of current and future results.
Guide to the Markets - Europe. Data as of 30 June 2019.
23

vk.com/id446425943
Global economy
Eurozone consumer |
GTM – Europe | 24 |
Eurozone consumer confidence |
Eurozone house prices relative to income |
Index level |
|
|
|
Recession |
|
|
|
|
Index level |
|
|
|
|
|
|
|
|
|
|
0 |
|
|
|
|
|
|
|
250 |
|
|
|
|
|
|
|
|
|
||
|
|
|
|
|
|
|
|
|
|
|
|
|
|
|
|
|
|
||
|
|
|
|
|
|
|
|
|
|
|
|
Spain |
|
|
|
|
|
|
|
|
|
|
|
|
|
|
|
|
|
|
|
France |
|
|
|
|
|
|
|
-5 |
|
|
|
|
|
|
|
|
|
200 |
|
Italy |
|
|
|
|
|
|
|
|
|
|
|
|
|
|
|
|
|
|
|
Germany |
|
|
|
|
|
|
|
-10 |
|
|
|
|
|
|
|
|
|
150 |
|
|
|
|
|
|
|
|
|
-15 |
|
|
|
|
|
|
|
|
|
100 |
|
|
|
|
|
|
|
|
|
-20 |
|
|
|
|
|
|
|
|
|
50 |
|
|
|
|
|
|
|
|
|
-25 |
|
|
|
|
|
|
|
|
|
0 |
|
|
|
|
|
|
|
|
|
'00 |
'02 |
'04 |
'06 |
'08 |
'10 |
'12 |
'14 |
'16 |
'18 |
'80 |
'84 |
'88 |
'92 |
'96 |
'00 |
'04 |
'08 |
'12 |
'16 |
Source: (Left) European Commission, Refinitiv Datastream, J.P. Morgan Asset Management. (Right) OECD, Refinitiv Datastream, J.P. Morgan Asset Management. Light grey columns indicate recession in the eurozone. Pre-2000, recessions are determined by a recession occurring in either Germany or the EU-15.
Past performance is not a reliable indicator of current and future results. Guide to the Markets - Europe. Data as of 30 June 2019.
24

vk.com/id446425943
Eurozone labour market |
GTM – Europe | 25 |
Eurozone unemployment rate and wage growth
%, wage growth is year on year
|
13 |
Unemployment |
|
|
|
|
|
|
|
|
|
|
|
|
|
|
|
Wage growth |
5,0 |
||||
|
|
|
|
|
|
|
|
|
|
|
|
|
|
|
|
|
|
||||||
economy |
12 |
|
|
|
|
|
|
|
|
|
|
|
|
|
|
|
|
|
|
|
|
|
4,5 |
11 |
|
|
|
|
|
|
|
|
|
|
|
|
|
|
|
|
|
|
|
|
|
4,0 |
|
|
|
|
|
|
|
|
|
|
|
|
|
|
|
|
|
|
|
|
|
|
|
|
|
Global |
10 |
|
|
|
|
|
|
|
|
|
|
|
|
|
|
|
|
|
|
|
|
|
3,5 |
9 |
|
|
|
|
|
|
|
|
|
|
|
|
|
|
|
|
|
|
|
|
|
3,0 |
|
|
|
|
|
|
|
|
|
|
|
|
|
|
|
|
|
|
|
|
|
May 2019: |
|||
|
|
|
|
|
|
|
|
|
|
|
|
|
|
|
|
|
|
|
|
|
|
||
|
|
|
|
|
|
|
|
|
|
|
|
|
|
|
|
|
|
|
|
|
|
7,5% |
|
|
8 |
|
|
|
|
|
|
|
|
|
|
|
|
|
|
|
|
|
|
|
|
|
2,5 |
|
7 |
|
|
|
|
|
|
|
|
|
|
|
|
|
|
|
|
|
|
|
|
1Q19: |
2,0 |
|
|
|
|
|
|
|
|
|
|
|
|
|
|
|
|
|
|
|
|
|
|
|
|
|
|
|
|
|
|
|
|
|
|
|
|
|
|
|
|
|
|
|
|
|
|
2,2% |
|
|
6 |
|
|
|
|
|
|
|
|
|
|
|
|
|
|
|
|
|
|
|
|
|
1,5 |
|
5 |
|
|
|
|
|
|
|
|
|
|
|
|
|
|
|
|
|
|
|
|
|
1,0 |
|
4 |
|
|
|
|
|
|
|
|
|
|
|
|
|
|
|
|
|
|
|
|
|
0,5 |
|
'98 |
'99 |
'00 |
'01 |
'02 |
'03 |
'04 |
'05 |
'06 |
'07 |
'08 |
'09 |
'10 |
'11 |
'12 |
'13 |
'14 |
'15 |
'16 |
'17 |
'18 |
'19 |
|
Source: ECB, Refinitiv Datastream, J.P. Morgan Asset Management. Wage growth is compensation per employee. Past performance is not a reliable indicator of current and future results. Guide to the Markets - Europe. Data as of 30 June 2019.
25

vk.com/id446425943
Eurozone unemployment |
GTM – Europe | 26 |
Germany, France, Italy and Spain unemployment rates
|
% |
|
|
|
|
|
|
|
|
|
|
|
|
|
|
|
|
|
|
|
|
28 |
|
|
|
|
|
|
|
|
|
|
|
|
|
|
|
|
|
|
|
economy |
24 |
|
|
|
|
|
|
|
|
|
|
|
|
|
|
|
|
|
|
|
20 |
|
|
|
|
|
|
|
|
|
|
|
|
|
|
|
|
|
|
|
|
Global |
16 |
|
|
|
|
|
|
|
|
|
|
|
|
|
|
|
|
|
|
Spain |
|
12 |
|
|
|
|
|
|
|
|
|
|
|
|
|
|
|
|
|
|
Italy |
|
|
|
|
|
|
|
|
|
|
|
|
|
|
|
|
|
|
|
|
|
|
8 |
|
|
|
|
|
|
|
|
|
|
|
|
|
|
|
|
|
|
France |
|
4 |
|
|
|
|
|
|
|
|
|
|
|
|
|
|
|
|
|
|
|
|
|
|
|
|
|
|
|
|
|
|
|
|
|
|
|
|
|
|
|
Germany |
|
0 |
|
|
|
|
|
|
|
|
|
|
|
|
|
|
|
|
|
|
|
|
'00 |
'01 |
'02 |
'03 |
'04 |
'05 |
'06 |
'07 |
'08 |
'09 |
'10 |
'11 |
'12 |
'13 |
'14 |
'15 |
'16 |
'17 |
'18 |
'19 |
Source: Eurostat, Refinitiv Datastream, J.P. Morgan Asset Management. Past performance is not a reliable indicator of current and future results.
Guide to the Markets - Europe. Data as of 30 June 2019.
26

vk.com/id446425943
Eurozone inflation |
GTM – Europe | 27 |
Eurozone headline and core inflation
|
% change year on year |
|
|
|
Average |
June (flash) |
||||
|
5 |
|
|
|
|
|
since 2000 |
|
2019 |
|
|
|
|
|
|
Headline CPI |
1,7% |
|
|
1,2% |
|
economy |
|
|
|
|
Core CPI |
1,4% |
|
|
1,1% |
|
4 |
|
|
|
|
|
|
|
|
|
|
|
|
|
|
|
|
|
Headline inflation |
|||
|
|
|
|
|
|
|
|
target |
||
Global |
3 |
|
|
|
|
|
|
|
||
|
|
|
|
|
|
|
|
|
||
|
|
|
|
|
|
|
|
|
|
|
|
2 |
|
|
|
|
|
|
|
|
|
|
1 |
|
|
|
|
|
|
|
|
|
|
0 |
|
|
|
|
|
|
|
|
|
|
-1 |
|
|
|
|
|
|
|
|
|
|
'00 |
'02 |
'04 |
'06 |
'08 |
'10 |
'12 |
'14 |
'16 |
'18 |
Eurozone core goods and services inflation
% change year on year |
|
|
|
Average |
|
June (flash) |
|||
3,5 |
|
|
|
|
|
since 2000 |
|
2019 |
|
|
|
|
Services CPI |
|
1,9% |
|
|
1,6% |
|
3,0 |
|
|
Core goods CPI |
0,6% |
|
|
0,2% |
||
|
|
|
|
|
|
|
|
|
|
2,5 |
|
|
|
|
|
|
|
|
|
2,0 |
|
|
|
|
|
|
|
|
|
1,5 |
|
|
|
|
|
|
|
|
|
1,0 |
|
|
|
|
|
|
|
|
|
0,5 |
|
|
|
|
|
|
|
|
|
0,0 |
|
|
|
|
|
|
|
|
|
-0,5 |
|
|
|
|
|
|
|
|
|
'00 |
'02 |
'04 |
'06 |
'08 |
'10 |
'12 |
'14 |
'16 |
'18 |
Source: (All charts) Eurostat, Refinitiv Datastream, J.P. Morgan Asset Management. CPI is the Consumer Price Index. Core CPI is defined as CPI less energy, food, alcohol and tobacco. Core goods CPI is defined as goods CPI less energy, food, alcohol and tobacco. Past performance is not a reliable indicator of current and future results. Guide to the Markets - Europe. Data as of 30 June 2019.
27
vk.com/id446425943
Global economy
European Central Bank policy rate |
GTM – Europe | 28 |
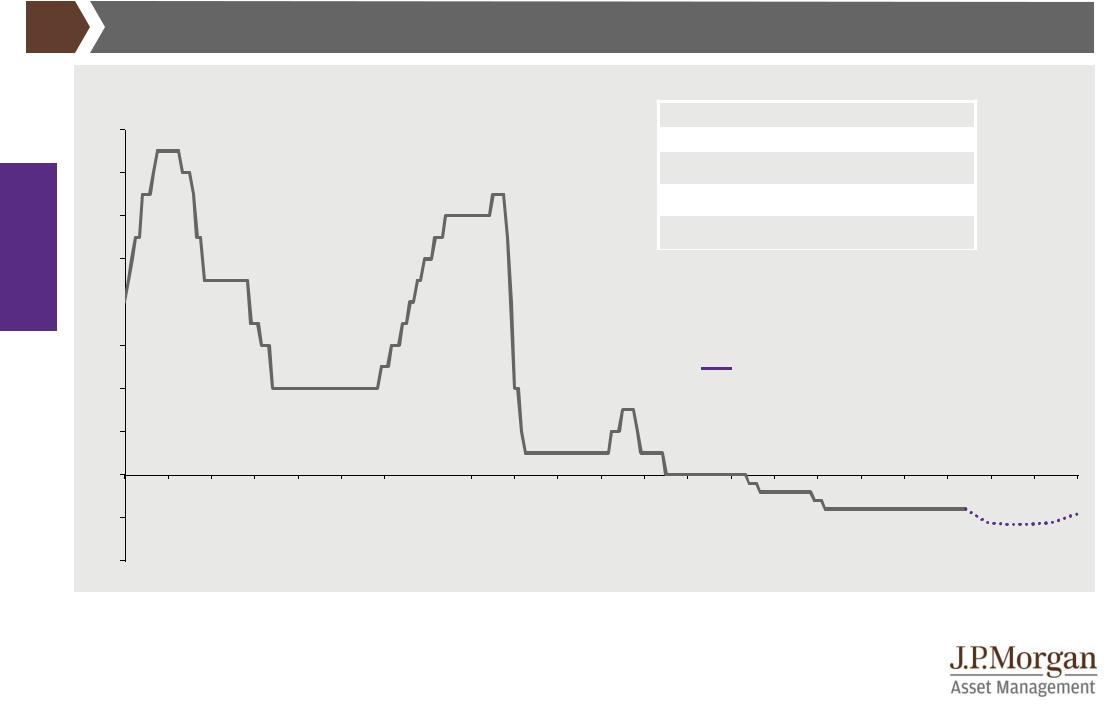
European Central Bank policy rate expectations
% deposit rate, market expectations
ECB staff June 2019 forecasts* (%)
4,0
2019 2020 2021
3,5 |
|
1,2 |
1,4 |
1,4 |
|
|
|
|
|
|
|
7,7 7,5 7,3
3,0
1,3 1,4 1,6
2,5
2,0
1,5 |
|
rate |
|
on 30 June 2019 (mean)
1,0
0,5
0,0
-0,5
-1,0
'00 |
'01 |
'02 |
'03 |
'04 |
'05 |
'06 |
'07 |
'08 |
'09 |
'10 |
'11 |
'12 |
'13 |
'14 |
'15 |
'16 |
'17 |
'18 |
'19 |
'20 |
'21 |
'22 |
Source: Bloomberg, European Central Bank, J.P. Morgan Asset Management. *Forecasts are made by ECB staff. HICP is the Harmonised Index of Consumer Prices. Market expectations are calculated using OIS forwards. Past performance is not a reliable indicator of current and future results. Guide to the Markets - Europe.
Data as of 30 June 2019.
28

vk.com/id446425943
Eurozone debt |
GTM – Europe | 29 |
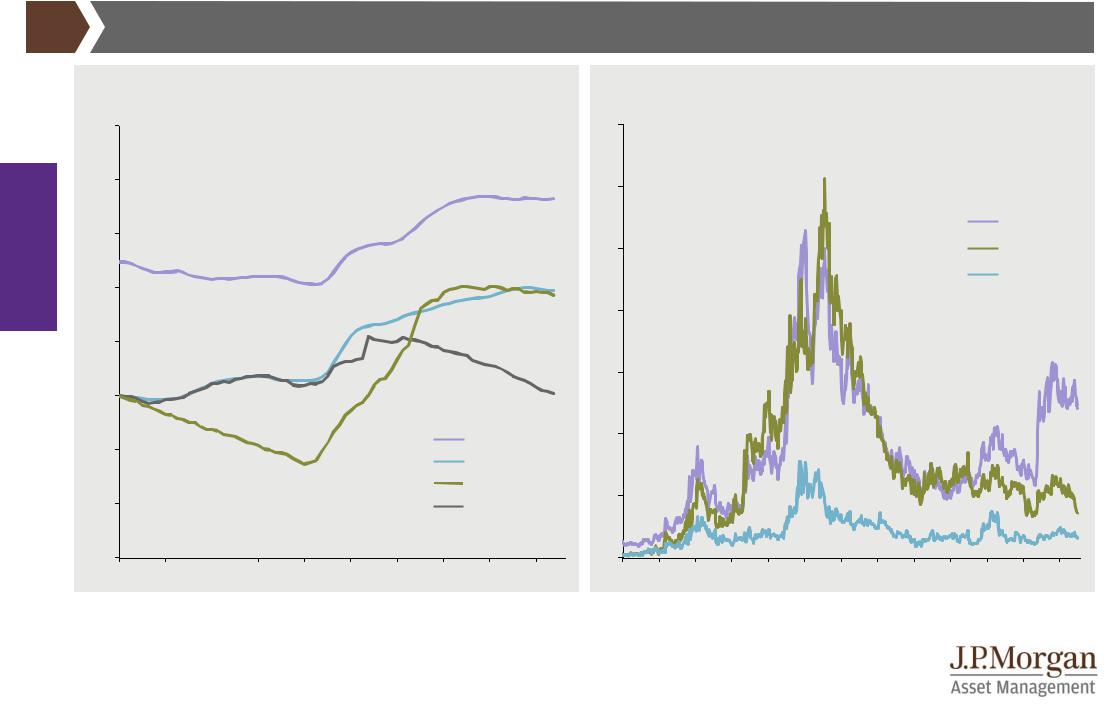
Eurozone debt to GDP ratios |
Eurozone debt service ratios |
|
% of nominal GDP |
|
|
|
|
|
|
|
|
% of disposable income |
|
|
|
|
|
|
|
|||
|
120 |
|
|
|
|
|
|
|
|
|
7,5 |
|
|
|
|
|
|
|
|
41 |
|
|
|
|
|
|
|
Non-financial corporates |
|
Households |
|
|
Non-financial corporates |
||||||||
economy |
110 |
|
|
|
|
|
|
|
|
|
|
|
|
|
|
|
|
|
|
40 |
|
|
|
|
|
|
|
|
|
|
|
|
|
|
|
|
|
|
|
||
|
|
|
|
|
|
|
|
|
|
7,0 |
|
|
|
|
|
|
|
|
39 |
|
|
|
|
|
|
|
|
|
|
|
|
|
|
|
|
|
|
|
|
||
|
100 |
|
|
|
|
|
|
|
|
|
|
|
|
|
|
|
|
|
|
|
|
|
|
|
|
|
|
|
|
|
|
|
|
|
|
|
|
|
|
|
|
Global |
|
|
|
|
|
|
|
Government |
|
|
|
|
|
|
|
|
|
38 |
||
|
|
|
|
|
|
|
|
|
|
|
|
|
|
|
|
|
|
|
||
|
|
|
|
|
|
|
|
|
|
|
|
|
|
|
|
|
|
|
|
|
|
90 |
|
|
|
|
|
|
|
|
|
6,5 |
|
|
|
|
|
|
|
|
|
|
|
|
|
|
|
|
|
|
|
|
|
|
|
|
|
|
|
|
|
|
|
|
|
|
|
|
|
|
|
|
|
|
|
|
|
|
|
|
|
|
37 |
|
80 |
|
|
|
|
|
|
|
|
|
|
|
|
|
|
|
|
|
|
|
|
|
|
|
|
|
|
|
|
|
|
|
|
|
|
|
|
|
|
|
36 |
|
70 |
|
|
|
|
|
|
|
|
|
6,0 |
|
|
|
|
|
|
|
|
|
|
|
|
|
|
|
|
|
|
|
|
|
|
|
|
|
|
|
|
|
|
|
|
|
|
|
|
|
|
|
|
|
|
|
|
|
|
|
|
|
|
35 |
|
60 |
|
|
|
|
|
|
|
|
|
|
|
|
|
|
|
|
|
|
34 |
|
|
|
|
|
|
|
|
|
Households |
5,5 |
|
|
|
|
|
|
|
|
||
|
|
|
|
|
|
|
|
|
|
|
|
|
|
|
|
|
|
|||
|
|
|
|
|
|
|
|
|
|
|
|
|
|
|
|
|
|
|
||
|
50 |
|
|
|
|
|
|
|
|
|
|
|
|
|
|
|
|
|
|
33 |
|
|
|
|
|
|
|
|
|
|
|
|
|
|
|
|
|
|
|
|
|
|
40 |
|
|
|
|
|
|
|
|
|
5,0 |
|
|
|
|
|
|
|
|
32 |
|
'00 |
'02 |
'04 |
'06 |
'08 |
'10 |
'12 |
'14 |
'16 |
'18 |
'00 |
'02 |
'04 |
'06 |
'08 |
'10 |
'12 |
'14 |
'16 |
'18 |
Source: (All charts) Bank for International Settlements, Refinitiv Datastream, J.P. Morgan Asset Management. Debt refers to gross debt. Debt service ratios are a GDP-weighted average of France, Germany, Italy and Spain. For the household sector, gross disposable income is the amount of money that all of the individuals in the household sector have available for spending or saving after income distribution measures (for example, taxes, social contributions and benefits) have taken effect. For the non-financial corporate sector, gross disposable income is essentially akin to gross operating surplus before dividends or interest is paid. Past performance is not a reliable indicator of current and future results. Guide to the Markets - Europe. Data as of 30 June 2019.
29
vk.com/id446425943
Eurozone government debt and bond spreads |
GTM – Europe | 30 |
France, Germany, Italy and Spain government debt to GDP
|
% of nominal GDP |
|
|
|
|
|
|
|
|
|
|
160 |
|
|
|
|
|
|
|
|
|
economy |
140 |
|
|
|
|
|
|
|
|
|
120 |
|
|
|
|
|
|
|
|
|
|
|
|
|
|
|
|
|
|
|
|
|
Global |
100 |
|
|
|
|
|
|
|
|
|
|
|
|
|
|
|
|
|
|
|
|
|
80 |
|
|
|
|
|
|
|
|
|
|
60 |
|
|
|
|
|
|
|
|
|
|
40 |
|
|
|
|
|
|
|
|
|
|
|
|
|
|
|
|
|
|
Spain |
|
|
20 |
|
|
|
|
|
|
|
Germany |
|
|
0 |
|
|
|
|
|
|
|
|
|
|
'00 |
'02 |
'04 |
'06 |
'08 |
'10 |
'12 |
'14 |
'16 |
'18 |
European 10-year government bond spreads over Germany
% spread |
|
|
|
|
|
|
|
|
|
|
|
|
7 |
|
|
|
|
|
|
|
|
|
|
|
|
6 |
|
|
|
|
|
|
|
|
|
|
|
|
|
|
|
|
|
|
|
|
|
|
|
Italy |
|
5 |
|
|
|
|
|
|
|
|
|
|
Spain |
|
|
|
|
|
|
|
|
|
|
|
|
France |
|
4 |
|
|
|
|
|
|
|
|
|
|
|
|
3 |
|
|
|
|
|
|
|
|
|
|
|
|
2 |
|
|
|
|
|
|
|
|
|
|
|
|
1 |
|
|
|
|
|
|
|
|
|
|
|
|
0 |
|
|
|
|
|
|
|
|
|
|
|
|
'07 |
'08 |
'09 |
'10 |
'11 |
'12 |
'13 |
'14 |
'15 |
'16 |
'17 |
'18 |
'19 |
Source: (Left) Bank for International Settlements, Refinitiv Datastream, J.P. Morgan Asset Management. Italy and France data are four-quarter moving averages. Debt refers to gross debt. (Right) Refinitiv Datastream, J.P. Morgan Asset Management. Past performance is not a reliable indicator of current and future results.
Guide to the Markets - Europe. Data as of 30 June 2019.
30