

brechignac_f_desmet_g_eds_equidosimetry_ecological_standardi
.pdf178
because it is familiar to the authors and effectively incorporates the general principles defined above.
3.1. U.S. DEPARTMENT OF ENERGY GRADED APPROACH1
The Graded Approach was not originally designed as an ecological risk assessment approach, but as a means for DOE facilities to demonstrate compliance with proposed limits for environmental protection. However, it was based on the U.S. Environmental Protection Agency’s (EPA) Framework for Ecological Risk Assessment [6] and can be easily integrated into an ecological risk assessment methodology.
The radiation dose standard incorporated into the Approach are derived from an IAEA Technical Report [8] which examined the relevant radioecological literature and found no evidence of population harm when maximally exposed individuals received dose rates of:
ξ Terrestrial animals: < 1 mGy d-1 ξ Terrestrial plants: < 10 mGy d-1 ξ Aquatic Organisms: < 10 mGy d-1
Other standards are possible. Currently the European Union is conducting the Framework for Assessment of Environmental Impact (FASSET) initiative [4] which will likely result in standards different from those on which the Graded Approach is currently based. If other dose standards are found to be more appropriate, the Graded Approach has the flexibility to adjust the default standards.
In the Graded Approach, the dose limits are used to derive Biota Concentration Guides (BCG). These are defined as the soil, sediment, or water concentration of a single radionuclide that would give a limiting dose under the model assumptions. BCGs make it possible to directly use measured concentrations to assess risks to the environment.
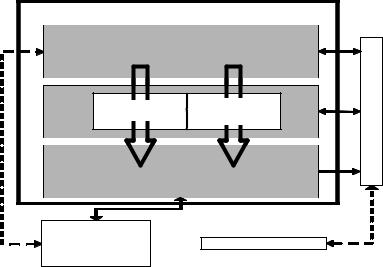
Application of the Graded Approach occurs in three major steps which are further subdivided into six minor steps (Fig. 1).
1Data Assembly
2General Screening
3Analysis
Site Specific
Screening
Site Specific
Analysis
Site Specific
Biota Dose
Assessment
Fig. 1. Schematic of the U.S. Department of Energy's Graded Approach for Assessing Doses to Biota.
179
3.1.1. Data assembly
This step incorporates all the activities preliminary to the analysis. The conceptual model is developed and evaluated, and the area of the assessment is defined. Radionuclide concentration data are assembled and evaluated. The degree to which the data represent the pathways of concern, as determined by the conceptual model, is of particular interest.
3.1.2. General screening
This is the initial screening step. The highest available substrate (e.g., soil, sediment, or water) contamination found within the area of assessment is divided by the BCG derived using reference organisms and default parameters to create a Hazard Quotient. These BCGs are tabulated in the Graded Approach documentation [3] and are defaults in the software. If the Hazard Quotient is less than 1.0, risk to the populations inhabiting the assessment area is negligible, the results are documented, and the assessment stops. If the Hazard Quotient is equal to or greater than 1.0, the assessment continues with Site Specific Screening.
If more than one radionuclide or more than one environmental substrate is to be assessed, Hazard Quotients are combined using a Sum of Fractions approach. A Hazard Index is calculated as:
§ |
Ci |
· |
|
¨ |
¸ |
||
|
|||
HI R ¦¨ |
|
¸ |
|
ij © |
BCGi ¹ j |
||
where:
Ci = Concentration of radionuclide i in medium j
BCGi = Biota concentration guide for radionuclide i in medium j
The Hazard Index as written above does not account for Relative Biological Effectiveness of different radiations. This is handled in the Graded Approach by using a Quality Factor in calculation of the BCG.
3.1.3. Site-specific screening: step 1
In this step, the same BCG used in the General Screening step divides an “average” substrate contamination in a refined analysis area. As before, if the Hazard Index is less than 1.0, the results are documented and the analysis ends. If the Hazard Index exceeds 1.0, screening continues.
3.1.4. Site-specific screening: step 2
Here, the same average concentration used in the previous step is divided by a new BCG, derived using parameters from organisms actually found on the site and uptake parameters measured on the site. Analysis either ends or continues as before.
3.1.5. Site-specific analysis
This step uses the same concentration and BCG from the previous step, but corrections are made for the relative sizes of the contaminated area and the
180
organism’s home range or the residence time of the organism in the contaminated area. Analysis either ends or continues as in previous steps.
3.1.6. Site-specific biota dose assessment
This is the final step in the assessment and is only reached if all the previous screening steps have failed. In this case, it is necessary to complete a comprehensive dose assessment for the organisms of interest from first principles. It will be necessary to assemble an interdisciplinary team to review the requirements and assumptions of the assessment, and either use available tissue concentration data or collect new data. If this step results in a determination that risks are unacceptable, mitigation should be recommended. Of course, at any time during the previous steps, risk managers may choose to opt out of the process and mitigate the risk based on the available results.
4. Assessing ecological risks from toxic chemicals
The methodologies used for assessing risks from chemical toxins to the environment are very similar to those described above, and will not be described in as great a detail. Ecological risk assessment for chemical toxins incorporates the general principles of working from a conceptual model, evaluating the correct pathways, using a graded, iterative, approach, and comparing to a standard. The EPA described the framework for this kind of assessment [6] used throughout the United States of America.
4.1. ECOLOGICAL RISK ASSSMENT AT THE IDAHO NATIONAL ENGINEERING AND ENVIRONMENTAL LABORATORY (INEEL)
The EPA framework (Fig. 2) was used to develop the screening-level ecological risk assessment approach used at the INEEL [9,10,11]. In this approach, the standards for comparison include such things as Lowest Observed Adverse Effect Levels (LOAEL), No Observed Adverse Effect Levels (NOAEL), and water quality criterion drawn from many literature sources. Using these standards, an Ecologically Based Screening Level (EBSL) is defined for each chemical toxin in each medium of interest. The EBSL is defined as the soil, sediment, or water concentration that would give a limiting dose of a specific chemical toxin under the model assumption. Like BCGs, the EBSLs make it possible to screen with measured or modelled substrate concentrations rather than conducting an extensive sampling program.
Similar to the Graded Approach, a Hazard Index derived using the Sum of Fractions is used to combine the risks from different chemicals in different media.
§ |
Ci |
· |
|
¨ |
¸ |
||
|
|||
HIC ¦¨ |
|
¸ |
|
ij © |
EBSLi ¹ j |
||
where:
Ci = Concentration of radionuclide i in medium j
EBSLi = Ecologically based Screening Level for chemical i in medium j.
The use of the Hazard Index is complicated by possible antagonism or synergy between chemicals. This is commonly dealt with by adjusting the
181
acceptable hazard index downward to some value below 1.0. This adjustment has little scientific basis, but it is a pragmatic approach which is intended to ensure protection.
|
Ecological Risk Assessment |
|
|
Problem Formulation |
|
Data |
|
|
|
|
|
A |
|
|
Acquisition; |
N |
|
|
Verification |
S |
|
Characterization |
|
A |
Characterization |
|
|
L |
Of |
Of |
|
Y |
Exposure |
Ecological |
|
S |
Effects |
|
|
I |
|
|
|
|
|
|
Monitoring and |
Risk Characterization |
|
|
|
Discussion
between
Risk Assessor  Risk Management
And
Risk Manager
Fig. 2. Schematic of the U.S. Environmental Protection Agency's
Framework for Ecological Risk Assessment.
5. Assessing ecological risks from physical hazards
This is a relatively unexplored area in ecological risk assessment. There are no generally accepted measurement endpoints. Possible endpoints might include unacceptable population size changes, levels of habitat destruction, degree of habitat fragmentation, or changes in net primary production, among others. However, although difficult, this is not an insoluble problem. Selection of endpoints can, and should, be negotiated among stakeholders.
In addition, there are no generally accepted standards to which one should compare, i.e., no answer to the question, “How much change is too much change?” This question might be addressed in a number of ways, including negotiating among the stakeholders. However, if one is willing to assume environmental parameters vary about a long-term average, one might establish an acceptable deviation from that mean as, for example, within two standard deviations of the mean. One could then calculate a Hazard Quotient as the actual deviation from the mean, divided by the acceptable deviation from the mean.
Then, one might combine risks from physical hazards using the Sum of Fractions approach to develop a Hazard Index, as for ionizing radiation and chemical toxins.
182
♣ |
M i X i ∙ |
|
HI P ¦♦ |
|
÷ |
♦ |
|
÷ |
i ♥ |
M i 2SDi ≠ |
|
where:
Xi = Value of population or habitat parameter i
Mi = Long-term mean of population or habitat parameter I SDi = Standard deviation of Mi
The primary limitation of this approach is that it does not explicitly account for possible synergy or compensatory mechanisms between the various physical hazards. In addition, because there is no necessary relationship between the hazards one must ask if it is at all meaningful to combine them. This assessment approach requires further study.
6. Combining the assessments across hazard types
While these three hazard types can be successfully analysed individually using an ecological risk assessment framework, this does not allow consideration of the interactions between them. Therefore, it is useful to consider the question of whether the three types of stressors can be evaluated in a common framework to determine their combined risk to the environment.
The number of potential interactions makes this a very large, but, with the appropriate research, not insoluble problem. Hazard indices may provide the common currency necessary to combine the various risks. The difficulty will be in selecting the appropriate method of combination that accounts for the possible synergies and antagonisms between them. This paper makes no pretention of presenting the best and final solution. However, it does offer some possible approaches to the problem. These include multiple regression analysis, principle components analysis, and a Monte Carlo approach.
6.1. MULTIPLE REGRESSION
In this approach, hazard indices for the three hazard types, and all of their possible combinations, are multiplied by coefficients, which represent the relative importance of the individual indices or their combinations, and the results are summed.
HIT aHI R bHIC cHI P dHI R HIC eHI R HI P fHIC HI P gHI R HIC HI P
HIT = Combined Hazard Index
HIR = Radiation Hazard Index
HIC = Chemical Hazard Index
HIP = Physical Hazard Index a, b, c, d, e, f, g = coefficients
Of course, the principle difficulty is finding the correct values of the coefficients. It may be, the only possible solution to this is a full factor experiment, subjecting test populations to all possible combinations of stressors and measuring the results. This experiment may obviate the need for the risk assessment. One solution to this problem might be a Monte Carlo approach.
183
6.2. A MONTE CARLO APPROACH
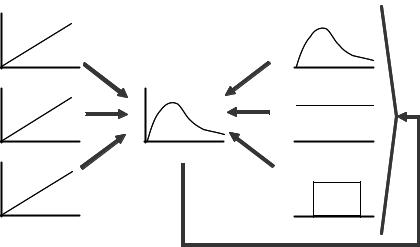
The application of Monte Carlo procedures may prove useful in using what is known about the coefficients for the regression to determine a distribution for the Combined Hazard Index (Figure3). Also, in this procedure, a simple weighted sum model might be used, where each hazard index is weighted by a coefficient representing their relative contribution, and their results are summed. The hazard indices, as simple linear functions of dose, are non-stochastic parameters in the model. The problem is finding the value of the regression coefficients. In the Monte Carlo approach a set of coefficients is selected randomly from distributions reflecting what is known about them. If one has no knowledge about the potential value of the coefficient, a simple uniform distribution might be selected. On the other hand, if one has fairly complete knowledge about the coefficient, one may be able to specify a more structured distribution for the coefficient.
In any case, these coefficients, randomly selected from assigned distributions, are used to derive a result from the weighted sum model. The result is saved and another set of coefficients is randomly selected. A result from the weighted sum model is again saved and the process is repeated. This goes on until enough results are obtained to sufficiently specify a resulting distribution. This distribution describes the possible values of the combined hazard index, given the uncertainty about the coefficients, and its parameters may be used to determine the presence or absence of risk. If the mean, the upper 95% confidence limit, or some other agreed upon parameter is less than one, there is no evidence of risk.
HIR |
|
HI =Į |
R |
HI +Į HI +Į HI |
P |
|||
|
|
T |
R |
C |
C |
P |
||
|
DR |
Frequency |
|
|
|
|
|
|
HIC |
|
|
|
|
|
|
|
|
|
|
|
|
|
|
|
|
|
|
DC |
|
|
|
HIT |
|
|
|
HIP |
|
|
|
|
|
|
|
|
|
DP |
|
|
|
|
|
|
|
Frequency Frequency Frequency
ĮR(DC,DP)
ĮC(DR,DP)
ĮP(DR,DC)
Fig. 3. Schematic of a Monte Carlo approach to determining the distribution of a combined Hazard Index. See the text for details.
184
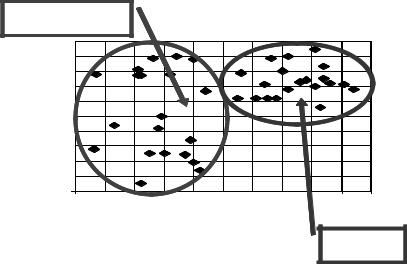
6.3. PRINCIPAL COMPONENTS ANALYSIS
Principal components analysis is a method to reduce large data sets to a few linear combinations of the data which explain the bulk of the variance. All relevant ecosystem metrics and effects data from a stressed, test area and a similar, non-stressed, reference area may be combined in a single principal components analysis (PCA). The results may then be plotted in the component space (Fig. 4). If the reference
area and the test area fall into separate groups, there may be a risk associated with the test area. If not, there is no reason to believe the test area is responding any differently than the reference and no risk is present. As data from various sites are accumulated, it may be possible to rank new sites relative to already assessed sites.
7. Conclusion
It is possible to effectively and efficiently analyze risks to the environment from ionizing radiation, chemical toxins, and physical hazards as individual stressors. However, our ability to effectively manage ecological risk would be greatly enhanced by the ability to analyze these risks in a single framework and it remains to be seen whether this is possible. In this paper, we have attempted to outline some possible approaches to this problem in the hope of stimulating further discussion and research along these lines.
Reference |
|
|
|
|
|
|
|
|
|
||
|
Area |
|
|
|
|
|
|
|
|
|
|
|
1 |
|
|
|
|
|
|
|
|
|
|
|
0.9 |
|
|
|
|
|
|
|
|
|
|
|
0.8 |
|
|
|
|
|
|
|
|
|
|
|
0.7 |
|
|
|
|
|
|
|
|
|
|
PC2 |
0.6 |
|
|
|
|
|
|
|
|
|
|
0.5 |
|
|
|
|
|
|
|
|
|
|
|
0.4 |
|
|
|
|
|
|
|
|
|
|
|
|
|
|
|
|
|
|
|
|
|
|
|
|
0.3 |
|
|
|
|
|
|
|
|
|
|
|
0.2 |
|
|
|
|
|
|
|
|
|
|
|
0.1 |
|
|
|
|
|
|
|
|
|
|
|
0 |
|
|
|
|
|
|
|
|
|
|
|
0 |
0.1 |
0.2 |
0.3 |
0.4 |
0.5 |
0.6 |
0.7 |
0.8 |
0.9 |
1 |
|
|
|
|
|
|
PC1 |
|
|
|
|
|
|
|
|
|
|
|
|
|
|
|
Test |
|
|
|
|
|
|
|
|
|
|
|
Area |
|
Fig. 4. Hypothetical Principal Components Analysis results to illustrate a result with a difference between the test area and the reference area.
8. References
1.International Atomic Energy Agency, Ethical Considerations in Protecting the Environment from the
Effects of Ionizing Radiation: A Report for Discussion, IAEA-TECDOC-1270, IAEA, Vienna (2002).
185
2.International Commission on Radiological Protection, 1990 Recommendations of the International Commission on Radiological Protection, ICRP Publication 60, Pergamon Press, Oxford and New York (1991).
3.United States Department of Energy, A Graded Approach for Evaluating Radiation Doses to Aquatic and Terrestrial Biota, Interim Technical Standard DOE-STD-XXXX-00, U.S. Department of Energy, Washington, DC (2000).
4.FASSET, http:/www.fasset.org
5.Summary Report of the IAEA Specialists Meeting on Environmental Protection from the Effects of Ionizing Radiation: International Perspectives, 26-29 November 2001.
6.United States Environmental Protection Agency, Framework for Ecological Risk Assessment, EPA/630/R-92/001, U.S. Environmental Protection Agency, Washington, DC (1992)
7.Suter, G.W., Ecological Risk Assessment, Lewis Publishers, Chelsea, MI (1993).
8.International Atomic Energy Agency, Effects of Ionizing Radiation on Plants and Animals at Levels Implied by Current Radiation Protection Standards, Technical Report Series 332, IAEA, Vienna (1992).
9.VanHorn, R.L., N.L. Hampton and R.C. Morris, Guidance manual for conducting screening level ecological risk assessments at the INEL. INEL-95/0190, Lockheed Idaho Technologies Company, Idaho Falls, ID (1995).
10.VanHorn, R.L., N.L. Hampton and R.C. Morris, Methodology for conducting screening-level ecological risk assessments for hazardous waste sites, Part I: Overview. International Journal of Environment and Pollution 9:26-46 (1998).
11.Hampton, N.L., R.C. Morris and R.L. VanHorn, Methodology for conducting screening-level ecological risk assessments for hazardous waste sites, Part II: Grouping ecological components, International Journal of Environment and Pollution 9:47-61 (1998).
COMPARING RISKS FROM EXPOSURE TO RADIONUCLIDES AND OTHER CARCINOGENS AT ARCTIC COAL MINES
G. SHAW, K. VICAT, P. DELARD, S. CLENNEL-JONES
Department of Environmental Science and Technology, Imperial College, Ascot Berkshire, SL5 7PY,
UNITED KINGDOM
I. FREARSON
Arctic Research Group, 29 Station Road, Borrowash, Derby, DE72 3LG, UNITED KINGDOM
1. Introduction
The risks posed to humans and ecosystems by environmental pollutants have traditionally been assessed on a substance-by-substance basis. However, it is increasingly recognized that the combined effects of pollutants on organisms and the environment should be evaluated where this is possible. Most locations on the surface of the Earth have received substantial inputs of pollutants and contaminants over recent decades, including artificially enriched heavy metals, organic xenobiotic compounds and radionuclides. The Arctic regions have been the focus of recent concern since they have become contaminated with a complex mixture of pollutants but are still regarded as being relatively unpolluted compared with lower latitude environments [1]. Thus, Arctic ecosystems offer an ideal opportunity for the development of methods for making comparative risk assessments for multiple exposures to contaminants of both human and non-human biota.
Arctic ecosystems receive pollutants from both distant and local sources [2]. Locally, the coal, oil and gas industries can enrich the arctic environment with radionuclides of the uranium and thorium decay series as well as carcinogenic contaminants such as arsenic and polycyclic aromatic hydrocarbons (PAH). On the island of Spitsbergen, in the Svalbard archipelago, coal has been mined since the beginning of the 20th century at several sites, notably Longyearbyen, Ny Ålesund, Sveagruva, Barentsburg and Pyramiden. This has lead to considerable despoilment of the terrestrial environment close to coal mines with coal wastes, comprising coal fragments and the host rock from which the coal was obtained, lying on the ground surface often over large areas [3]. These wastes have even used as in-filling materials for the construction of roads [4]. Any contaminating substances within these wastes are thus introduced into the surface environment and pose a potential hazard to plants, foraging animals and humans. An interesting development is the opening up of the town of Longyearbyen to tourism over the last decade, thereby increasing the potential for human exposure to waste materials from former coal mining activities.
This paper is intended to explore and compare the methodologies by which exposures of humans to both radioactive and non-radioactive contaminants in coal wastes can be assessed. It first attempts to quantify the significance of enhanced in situ radiation dose from coal wastes on Spitsbergen. It then attempts to show how the relative exposures and risks from both radioactive and non-radioactive carcinogens can be quantified and compared.
187
F. Brechignac and G. Desmet (eds.), Equidosimetry, 187–196.
© 2005 Springer. Printed in the Netherlands.

188
2. Radioactive and non-radioactive contaminants associated with coal mining on Spitsbergen
Table 1 shows results of an analysis of coal sampled from Sveagruva in 1990 and indicates that, as well as having a high potential for soil acidification due to a 4% sulphur content, it also contains relatively high concentrations of potentially toxic elements such as arsenic and chromium. Arsenic is a known carcinogen and exposure to this element via environmental pathways is of particular concern.
Table 1. Contaminants in coal sampled in 1990 from Sveagruva, Spitsbergen (units are mg kg-1 dry weight).
S |
K2O |
As |
Cr |
Pb |
Cd |
39000 |
100 |
19 |
10 |
<2.0 |
<0.2 |
In addition to potentially toxic elements, coal is known to contain naturally occurring radionuclides of the uranium and thorium decay series, as well as potassium40. Table 2 indicates that these can become significantly enriched following combustion.
Table 2. Radioactive constituents of coal and in fly ash following coal combustion [5] (units are Bq kg-1 dry weight).
|
40K |
238U |
226Ra |
210Pb |
210Po |
Coal |
50 |
20 |
20 |
20 |
20 |
Fly Ash |
265 |
200 |
240 |
930 |
1700 |
Monitoring studies over recent years have also shown that arctic areas with active hydrocarbon extraction industries can become significantly contaminated with polycyclic aromatic hydrocarbons (PAH). Measured concentrations of PAH in surface sediments in and around Spitsbergen range from 0.1 to 50 mg kg-1 [2] and derive, at least in part, from coal mining activities on the island. These substances have very long environmental half-lives and include certain individual compounds (such as benzo-a- pyrene, anthracene and phenanthrene) which are known to be potent carcinogens.
3. Measured and calculated kerma rates at two coal mines in Spitsbergen
An in situ spatial survey of kerma rate (µGy y-1) was carried out in July 1999 at the former coal mine site in Ny Ålesund, situated in north-western Spitsbergen in the Kongsfjorden region. In situ measurements were taken at 1m above the ground surface using a Mini Instruments Environmental Radiation Meter Type 6-80 coupled to a Type MC-71 Geiger-Muller tube which has a response range of 0.05 to 75 µGy h-1. Two areas were surveyed. The first was the area immediately adjacent to Ny Ålesund over which the remains of former coal mining activities are clearly visible (including significant quantities of coal wastes). The