

brechignac_f_desmet_g_eds_equidosimetry_ecological_standardi
.pdf211
|
enhancementratio |
3,0 |
|
|
|
A |
|
|
B |
|
Synergistic |
2,5 |
|
|
|
|
|
4 |
|||
|
|
|
|
|
|
|
|
|||
2,0 |
|
|
|
|
|
|
|
3 |
||
|
|
|
|
|
|
|
|
|||
1,5 |
|
|
|
|
|
|
|
2 |
||
1,0 |
38 |
40 |
42 |
44 |
38 |
40 |
42 |
1 |
||
|
|
36 |
44 |
|||||||
|
|
|
Tem perature, î Ñ |
Tem perature, oC |
||||||
Fig. 3. The dependence of the synergistic enhancement ratio upon the exposure temperature for mammalian cells simultaneously exposed to heat and chemicals: cisdiamminedichloroplatinum (A), tri(1-aziridinyl)phosphine sulphide (B).
|
enhancement ratio |
2,4 |
|
|
|
|
|
|
|
|
|
|
|
2 |
|
|
|
Synergistic |
2,0 |
|
1 |
|
|
|
|
|
1,6 |
|
|
|
|
|
|
||
1,2 |
|
|
|
|
|
|
||
|
|
|
|
|
|
|
||
|
|
30 |
35 |
40 |
45 |
50 |
55 |
|
|
|
|
|
Temperature, o |
Ñ |
|
||
Fig. 4. The dependence of the synergistic enhancement ratio upon the exposure temperature for diploid Endomyces magnusii (curve 1) and diploid Saccharomyces ellipsoideus (curve 2) yeast cells. Error bars show inter-experimental standard errors.
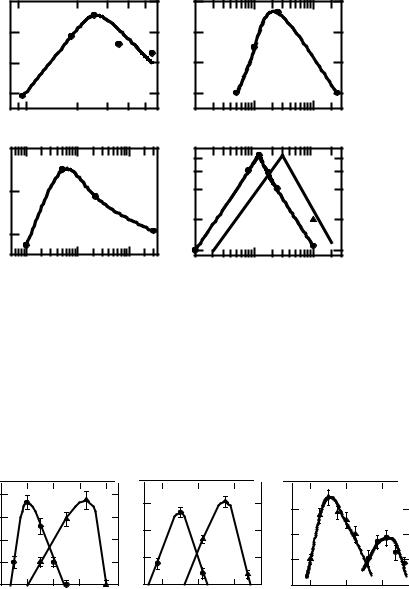
On the basis of the results presented the following conclusion should also be valid: for any constant ambient temperature (or concentration of chemical agent) there should be an optimal intensity of ionizing or UV light radiation resulting in the greatest synergy. Some selected experimental results confirming this prediction are presented in Fig. 5. The data on the simultaneous thermoradiation inactivation of Bacillus subtilis spores [12,13] were used to estimate the dependence of the synergistic enhancement ratio on the dose rate for 95θC exposure temperature. The results are depicted in Fig. 5A. One can see that for a constant temperature, at which the irradiation occurs,
212
synergy can be obtained within a certain dose rate range. Inside this range an optimal dose rate of ionizing radiation may be indicated, which maximizes the synergy. Very similar result was obtained for inactivation of diploid yeast cells exposed to electron beam from a 25 MeV pulsed linear accelerator at 51θC (Fig. 5B).
Fig. 5C demonstrates the relationship between the synergistic enhancement ratio and the dose rate of ionizing radiation for a combined effect of lead nitrate and chronic irradiation of Arabidopsis thaliana seeds. This relationship was calculated using the experimental results obtained by others [14]. The seeds were selected in wild populations growing for five years in places with different levels of radioactive pollution inside the 30 km zone around the Chernobyl nuclear power station and then treated with lead nitrate (3.39 g/l). The frequency of mutant embryos and the proportion of lethal embryos were estimated. For this case, the synergistic enhancement ratio was defined as the ratio between the increment of the mutant or lethal embryos after the combined action and the sum of these increments after separate action of each agent. As it can be seen from Fig.5C, the synergistic effect has a pronounced maximum at a certain dose rate of ionizing radiation.
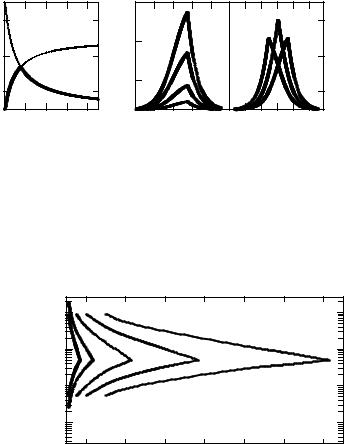
Figure 5D shows the relationship between the synergistic enhancement ratio and power flux density after simultaneous action of microwave exposure and high environment temperatures (30θC, curve 1, and 38θC, curve 2) on rabbit heating [15]. Here again, the synergistic effect has a pronounced maximum at a certain intensity of microwave radiation. The only experimental point obtained for rabbits exposed at 100 mW/cm2 and 38θC, shows that the synergistic enhancement ratio was increased for this power flux density. It turned out that further investigation of the synergy for lower intensities of microwaves delivered at 38θC was embarrassed because animals did not sustain this high environmental temperature for a long time. Nevertheless, this data show that the relationship between the synergy and the power flux density may be shifted to higher intensities with an increase in ambient temperature. Then it can be expected that as the exposure temperature is reduced, the optimal dose rate decreases and vice versa. The universality of this important conclusion is supported by our extensive data with diploid yeast cells exposed by heat combined with ionizing radiation (Fig. 6A), 254 nm UV light (Fig. 6B) and 44 kHz ultrasound (Fig. 6C). One can see that the synergistic interaction may increase, decrease or stay unchanged with the decrease in the intensity of any physical factor combined with heat. Nevertheless, the equi-effective values of the synergistic interaction and the whole temperature range, within which the synergy can be occurred, are shifted to lower temperature.
To demonstrate a potential significance of synergistic interaction at low intensity of agents applied, Fig. 7 illustrates the correlation between the intensity of physical factor or the concentration of chemical compound and the exposure.
213
Synergisnic enhancement ratio
2,4 |
|
|
|
1,6 |
A |
|
|
|
1,4 |
2,2 |
|
|
|
|
2,0 |
|
|
|
1,2 |
1,8 |
|
|
|
1,0 |
0,91 |
2 |
3 |
4 |
5 |
Dose rate, Gy/min
|
B |
|
1 |
10 |
100 |
Dose rate, Gy/min
3 |
|
|
10 |
|
|
|
C |
|
|
68 |
D |
1 |
2 |
2 |
|
|
4 |
|
|
|
|
|
|
2 |
|
|
|
1 |
|
|
|
|
|
|
|
|
|
1 |
|
|
|
1 |
10 |
100 |
1 |
|
10 |
100 |
|
Dose rate, ΠGy/h |
|
Power flux density, mW/cm2 |
|||
Fig. 5. The dependencies of the synergistic enhancement ratio upon the intensity of physical factors. The role of dose rate for inactivation of bacterial spores Bacillus subtilis (A), diploid Saccharomyces cerevisiae yeast cells (B) exposed to ionizing radiation at 95 and 51θC, respectively. C - the relationship between the synergistic enhancement ratio and the dose rate of ionizing radiation for a combined effect of lead nitrate and chronic irradiation of Arabidopsis thaliana seeds. D - the relationship between the synergistic enhancement ratio and power flux density after simultaneous action of microwave exposure and high environment temperatures (30θC, curve 1, and 38θC, curve 2) on rabbit heating.
|
enhancement ratio |
1,8 |
A |
1 |
2 |
1,6 |
Synergisnic |
|
|
||||
|
|
|
||||
1,6 |
|
|
|
|
||
1,4 |
|
|
|
1,4 |
||
|
|
|
|
|||
1,2 |
|
|
|
1,2 |
||
|
|
|
|
|||
|
|
|
|
1,0 |
||
|
|
1,0 |
|
|
|
|
|
|
46 |
48 |
50 |
52 |
54 |
|
|
|
Tem perature, oÑ |
|||
B |
|
3,0 |
|
2 |
|
|
|
|
1 |
|
2,5 |
|
|
2,0 |
|
|
1,5 |
48 |
52 |
1,0 |
56 |
||
Tem perature, oÑ |
||
C |
1 |
|
|
|
|
|
|
2 |
44 |
48 |
52 |
Tem perature, oC |
||
Fig. 6. The dependencies of the synergistic enhancement ratio (k) upon exposure temperature and intensity of physical factors for inactivation of Saccharomyces cerevisiae diploid yeast cells (strain XS800). Heat was applied simultaneously with: A - 25 MeV electron radiation at 5 (curve 1) and 25 Gy/min (curve 2); B - 254 nm UV light at 0.15 (curve 1) and 1.5 W/m2 (curve 2); C – 20 kHz ultrasound at 0.05 (curve 1) and 0.2 W/cm2 (curve 2). Error bars show inter-experimental standard errors.

214
Temperature, oC
108 |
|
|
|
|
|
|
|
|
|
|
|
|
|
|
|
|
|
|
|
|
|
|
|
|
|
|
|
|
|
|
|
102 |
|
A |
|
|
|
|
|
|
|
|
|
66 |
|
|
B |
|
|
|
|
|
|
|
|
|
|
|
|
|
|
||
|
|
|
|
|
|
|
|
|
|
|
|
|
|
|
|
|
|
|
|
|
|
|
|
|
|
|
|
||||
|
|
|
|
|
|
|
|
|
|
|
|
|
|
|
|
|
|
|
|
|
|
|
|
|
|
|
|
|
|
|
|
96 |
|
|
|
|
|
|
|
|
|
|
|
|
64 |
|
|
|
|
|
|
|
|
|
|
|
|
|
|
|
|
|
|
|
|
|
|
|
|
|
|
|
|
|
|
|
|
|
|
|
|
|
|
|
|
|
|
|
|
|
|
|
|
||
90 |
|
|
|
|
|
|
|
|
|
|
|
|
62 |
|
|
|
|
|
|
|
|
|
|
|
|
|
|
|
|
|
|
|
|
|
|
|
|
|
|
|
|
|
|
|
|
|
|
|
|
|
|
|
|
|
|
|
|
|
|
|
|
||
84 |
|
|
|
|
|
|
|
|
|
|
|
|
|
|
|
|
|
|
|
|
|
|
|
|
|
|
|
|
|
|
|
|
|
|
|
|
|
|
|
|
|
|
|
|
|
|
|
|
|
|
|
|
|
|
|
|
|
|
|
|
|
|
|
1 |
2 |
3 |
4 |
5 |
6 |
1 |
2 |
3 |
4 |
5 6 7 8 |
|||||||||||||||||||||
|
|
D ose rate, G y/m in |
|
|
D ose rate, G y/m in |
||||||||||||||||||||||||||
44 |
C |
|
43 |
|
|
|
|
|
42 |
|
|
41 |
|
|
40 |
|
|
0.01 |
0.1 |
1.0 |
D ose rate, G y/m in
C |
|
D |
|
|
o |
41 |
|
42 |
|
Temperature, |
40 |
|
|
|
39 |
|
|
41 |
|
|
|
|
||
38 |
4 |
8 |
12 |
|
|
|
|||
|
|
C oncentration, |
|
|
|
|
|
Π M |
|
|
|
|
40 |
|
E |
|
|
|
|
|
36 |
|
|
|
32 |
|
|
|
28 |
4 |
6 |
8 |
10 |
|
C oncentration, |
|
|
|
Π g/m l |
|
|
|
F |
|
10 |
20 |
30 |
Pow er flux density, m W /cm 2
Fig. 7. Correlation of exposure temperature with the intensity of physical factor or the concentration of chemical agent providing the same value of synergistic interaction under simultaneous combined action of ionizing radiation and heat on inactivation of bacterial spores (A), bacteriophage (B) and cultured mammalian cells (C); inactivation of mammalian cells exposed to heat together with cis-diammine-dichloroplatinum (D) and tris(1-aziridinil)-phosphine sulfide (E); rabbit heating by microwave at various power flux density (F).
Temperature, which both provide equi-effective levels of synergistic interaction. To estimate this correlation, the original data were taken from a number of publications for simultaneous thermoradiation action on bacterial spores [12, 13], phage [16], mammalian cells [17,18], and rabbit heating [15]. Original data for mammalian cells exposed to heat combined with cis-DDP or TAPS were taken from the papers [19] and [20], respectively. One can see the linear relationships are found between these values for various biological objects. In all cases, at a smaller intensity of the physical factor or the concentration of the chemical agents, one has to reduce the acting temperature to preserve the highest or any arbitrary synergistic effect. These data, in principle, indicate a potential significance of synergistic interaction at low intensity of adverse factors encountered in the natural environment.
4. Cell recovery after combined actions
The inhibition of cell recovery is commonly considered as a reason of synergy of the combined action of ionizing radiation with various agents [1-4]. However, the inhibition may be proceeded via either the damage of the mechanism of the recovery itself or via the formation of irreversible damage which cannot be repaired at all. Therefore, it would be of interest to estimate quantitatively the probability of recovery per time unit and the fraction of irreversible damage for various combinations.
|
215 |
It is known [21, 22] that the decrease in the effective dose |
Deff(t) with the |
recovery time t was fitted to an equation of the form: |
|
Deff(t) = D1[K + (1 – K) e-Εt], |
(1) |
where D1 is the initial radiation dose; K is an irreversible component of radiation damage; e is the basis of the natural logarithm, and Ε is the recovery constant characterizing the probability of recovery per time unit. To determine whether the mechanism of synergistic interaction was related to the impairment of the recovery capacity per se or to the production of irreversible damages, we estimated the recovery parameters (K and Ε) after different combined treatments, at which a considerable synergistic interaction occurred. The final results presented in Table 1. One can see that for various biological objects and different conditions of the combined action the irreversible component increased with either the exposure temperature or the concentration of chemicals while the probability of recovery stayed unchanged. It can be concluded on this basis that the recovery process itself is not damaged and the inhibition of recovery is entirely due to the enhanced yield of irreversibly damaged cells.
Table 1. Radiobiological parameters of cell recovery after simultaneous action of UV light and heat, ionizing radiation and heat, as well as after combined treatments with ionizing radiation and pyruvate (Pur), novobiocin (Nov), lactate (Lac) and nalidixic acid (Nal). Original data, used for calculation, have already been published for ϑ- rays + high temperature [23] and X ray + chemicals [24].
Treatment |
Biological |
Irreversible |
Recovery |
|
Objects |
component Ê |
constant Ε, hr-1 |
UV light alone |
Yeast cells |
0.56 |
0.071 |
UV light + 53θC |
Yeast cells |
0.60 |
0.071 |
UV light + 54θC |
Yeast cells |
0.69 |
0.071 |
UV light + 55θC |
Yeast cells |
0.80 |
0.071 |
UV light + 56θC |
Yeast cells |
0.96 |
- |
UV light + 57θC |
Yeast cells |
1.00 |
- |
ϑ-rays alone |
Yeast cells |
0.41 |
0.07 |
ϑ-rays + 45θC |
Yeast cells |
0.51 |
0.063 |
ϑ-rays + 50θC |
Yeast cells |
0.75 |
0.07 |
ϑ-rays + 55θC |
Yeast cells |
0.90 |
0.063 |
X-rays alone |
Mammalian cells |
0.60 |
0.15 |
X-rays + 10 mM Pur |
Mammalian cells |
0.75 |
0.16 |
X-rays + 20 mM Pur |
Mammalian cells |
0.92 |
0.16 |
X-rays + 5 ΠM Nov |
Mammalian cells |
0.82 |
0.14 |
X-rays + 10 ΠM Nov |
Mammalian cells |
0.90 |
0.14 |
X-rays + 10 mM Lac |
Mammalian cells |
0.78 |
0.14 |
X-rays + 20 mM Lac |
Mammalian cells |
0.99 |
- |
X-rays + 5 ΠM Nal |
Mammalian cells |
0.74 |
0.15 |
X-rays + 10 ΠM Nal |
Mammalian cells |
0.82 |
0.15 |
216
5. Mathematical model of synergistic interaction
The results of the previous section, pointing out the negligible role of the recovery inhibition itself in the mechanism of synergistic interaction, strongly invoke the need to elaborate a new theoretical conception of the synergy which, being useful for environmental radiation protection, take into account the regularities revealed. It might be reasonable to assume that some additional lethal lesions produced during combined action are responsible for the synergistic interaction. We suppose that the additional lethal lesions are arisen from the interaction of sublesions induced by both agents and these sublesions are non-lethal when each agent is applied separately. We assume that one sublesion produced for instance by ionizing radiation interacts with one sublesion from another environmental agent (for specificity sake, let it be heat) to produce one additional lethal lesion. It would seem probable to suppose that the number of sublesions was directly proportional to the number of lethal lesions. Let p1 and p2 be the number of sublesions that occur for one lethal lesion induced by ionizing radiation and hyperthermia, respectively. Let N1 and N2 be the mean numbers of lethal lesions in a cell produced by these agents. A number of additional lesions N3 arising from the interaction of ionizing radiation and hyperthermia sublesions may be written as
N3 = min{p1N1; p2N2}. |
(2) |
Here, min{p1N1; p2N2} is a minimal value from two variable quantities: p1N1 and p2N2, which are the mean number of sublesions produced by ionizing radiation and hyperthermia, respectively. Thus, the model describes the mean yield of lethal lesions per cell as a function of ionizing radiation (N1), hyperthermia (N2), and interaction (min{p1N1; p2N2}) lethal lesions. Then the synergistic enhancement ratio k may be expressed as
k = (N1 + N2 + N3)/(N1 + N2). |
(3) |
Taking into account Eqn. 2, the last expression can be rewritten as |
|
k = 1 + min{p1; p2N2/N1} / (1 + N2/N1). |
(4) |
It is evident from here that the highest synergistic interaction will be determined by the least value from the two functions: f1 = 1 + p1 / (1 + N2/N1) and f2 = 1 + (p2N2/N1) / (1 + N2/N1). Fig. 8A shows the dependence of both this functions on the ratio of N2/N1, calculated for arbitrary chosen p1 and p2 (p1 = 6, p2 = 4). The bold line at this Figure depicts the dependence of the synergistic enhancement ratio on the ratio N2/N1, i.e. the ratio of the effects produced by each agent used in combination. Since f1 decreases while f2 increases with N2/N1, the greatest synergistic effect will be obtained when f1 = f2, i.e.
p1 / (1 + N2/N1) = (p2 N2/N1) / (1 + N2/N1). |
(5) |
From here, the condition of the highest synergistic interaction can be obtained: |
|
p1N1 = p2N2. |
(6) |
217
It means that the highest synergistic interaction occurred when both agents produce equal numbers of sublesions. Taking into account Eqns. 3 and 5, the value of the greatest synergistic enhancement ratio is given by
kmax = 1 + [p1p2/(p1 + p2)]. |
(7) |
f1, f2 |
|
|
|
A |
6 |
f |
|
|
|
|
|
|
||
|
2 |
|
|
f1 |
|
|
|
|
|
4 |
|
|
|
|
2 |
f1 |
|
|
f2 |
0 |
2 |
4 |
6 |
8 |
ratio |
12 |
|
|
|
|
|
|
|
|
|
|
|
|
|
|
|
|
|
|
|
|
enhancement |
|
|
4 |
|
B |
|
2 |
|
C |
6 |
|
|
|
|
|
|
|||||
8 |
|
|
|
|
1 |
|
3 |
|
|
|
|
|
|
|
|
|
|
|
|||
|
|
|
3 |
|
|
|
|
|
|
|
|
|
|
|
|
|
|
|
|
4 |
|
|
|
|
|
|
|
|
|
|
|
|
Synergistic |
4 |
|
|
2 |
|
|
|
|
|
|
|
|
|
|
|
|
|
|
2 |
||
|
|
|
|
|
|
|
|
|
||
|
|
|
|
1 |
|
|
|
|
|
|
|
|
|
|
|
|
|
|
|
|
|
|
0,01 |
0,1 |
1 |
10 |
100 |
0,01 0,1 |
1 |
10 |
100 |
|
Fig. 8. The calculated dependencies of functions f1 and f2 on the N2/N1 ratio for the following values of the basic parameter: p1 = 6 and p2 = 4 (A) and theoretically expected dependencies of the synergistic enhancement ratio on the N2/N1 ratio for the following values of the basic parameter: B - p1 = 5, p2 = 1 (curve 1), p1 = 15, p2 = 3 (curve 2), p1 = 35, p2 = 7 (curve 3), p1 = 60, p2 = 12 (curve 4); C - p1 = 5, p2 = 20 (curve 1), p1 = 10, p2 = 10 (curve 2), p1 = 20, p2 = 5 (curve 3).
N 2 /N 1 |
|
|
|
|
|
|
|
1 0 |
|
|
|
|
|
|
|
1 |
2 |
3 |
|
4 |
|
|
5 |
|
1 |
|
|
|
|
|
|
0 ,1 |
|
|
|
|
|
|
|
0 ,0 1 |
|
|
|
|
|
|
|
|
2 |
4 |
6 |
8 |
1 0 |
1 2 |
k i 1 4 |
Fig. 9. The prediction of N2/N1 ratio, at which equi-effective values of the synergistic enhancement ratio (ki) can be observed at different values of the basic model parameters: p1 = 1, p2 = 2 (curve 1); p1 = 2, p2 = 4 (curve 2); p1 = 5, p2 = 10 (curve 3); p1 = 10, p2 = 20 (curve 4); p1 = 20, p2 = 40 (curve 5).
218
Some examples of theoretically predicted dependency of the synergistic enhancement ratio on the N2/N1 ratio for various values of the basic model parameters p1 and p2 are depicted in Figs. 8B and 8C. If the observed biological effect is mainly induced by heat (p1N1 < p2N2) then taking into account Eqn. 4, the parameter p1 can be expressed as
p1 = (k1 - 1)(1 + N2/N1), |
(8) |
where k1 is the value of synergistic enhancement ratio observed in experiments performed in this condition. On the contrary, if the observed biological effect is mainly induced by ionizing radiation, we have
p2 = (k2 - 1)(1 + N1/N2), |
(9) |
where k2 is the experimental value of the synergistic enhancement ratio observed for the condition p2N2 < p1N1. The corresponding number of lethal lesions can be calculated [25] as
N = - lnS, |
(10) |
where S is the surviving fraction. |
|
It is easily to demonstrate that the model under consideration can predict two N2/N1 ratios, at which equi-effective values of the synergistic enhancement ratio (ki) can be observed. For the case p1N1 < p2N2,we have
N2/N1 |
= (p1 – ki + 1) / (ki - 1), |
(11) |
while for the case p2N2 < p1N1 |
|
|
N2/N1 |
= (ki - 1) / (p2 – ki + 1). |
(12) |
Fig. 9 shows some examples of calculations based on Eqns. 11 and 12. |
|
|
6. Comparison of the model predictions and experimental data
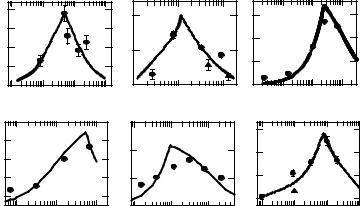
Several examples of this model application for optimizing and prediction of the synergy have already been published [26-28]. The main value of the mathematical approach presented is the possibility to predict the equi-effective synergy including the highest synergism and the N2/N1 ratio at which it can be achieved. We tested the applicability of the model for quantitative description, prediction and optimization of the synergistic interaction observed for various biological objects and test systems. Fig. 10 presents the experimentally obtained (circles) and theoretically predicted (solid lines) relationships between the synergistic enhancement ratio and the N2/N1 ratio for simultaneous thermoradiation action on inactivation of T4 bacteriophage (Fig. 10A), Bacillus subtilis spores (Fig. 10B), cultured mammalian cells (Fig. 10C). The procedures for calculating of these relationships have been described in detail in the previous section. Initial experimental data used for these calculations were taken from publications associated with bacterial spores [12, 13] bacteriophage [16], and mammalian cells [17, 18]. The similar relationships have been obtained for inactivation of cultured mammalian cells induced by simultaneous exposure to elevated temperature
219
with cis-diammindichloroplatinum (cis-DDP, Fig. 10D) and tri(1-aziridinyl)phosphine sulphide (TAPS, Fig. 10E) as well as for rabbit heating by exposure to microwave radiation at high ambient temperature (Fig. 10E).
Synergistic enhancement ratio
2 ,6 |
A |
|
|
|
2 ,0 |
B |
|
|
|
|
|
|
|||
2 ,2 |
|
|
|
|
|
|
|
1 ,8 |
|
|
|
|
1 ,5 |
|
|
|
|
|
|
|
|
|
|
1 ,4 |
|
|
|
|
|
|
|
1 ,0 |
|
|
|
|
1 ,0 |
|
|
|
0 ,01 |
0,1 |
1 |
1 0 |
0,1 |
1 |
10 |
|
|
N 2 /N 1 |
|
|
|
N 2 /N 1 |
|
1 0 |
|
|
|
|
4 |
|
|
8 |
D |
|
|
|
3 |
E |
|
6 |
|
|
|
|
|
|
|
|
|
|
|
|
|
|
|
4 |
|
|
|
|
2 |
|
|
2 |
|
|
|
|
1 |
|
|
|
10 -1 |
1 00 |
|
101 |
|
|
|
|
|
10 -2 |
10 -1 |
10 0 |
|||
|
|
N 2/N 1 |
|
|
|
N 2 /N 1 |
|
4 |
C |
|
|
3 |
|
|
|
2 |
|
|
|
1 |
|
|
|
0 ,0 0 1 |
0,0 1 |
0,1 |
1 |
|
|
N 2/N 1 |
|
1 0 |
|
|
|
7 |
F |
|
|
|
|
|
|
4 |
|
|
|
1 |
|
|
|
0,01 |
0,1 |
1 |
10 |
|
N 2 /N 1 |
|
|
Fig. 10. Experimentally obtained (circles) and theoretically predicted (solid lines) dependencies of the synergistic enhancement ratio k on the N2/N1 ratio under simultaneous combined action of ionizing radiation and heat on inactivation of bacterial spores (A), bacteriophage (B) and cultured mammalian cells (C); inactivation of mammalian cells exposed to heat together with cis-diamminedichloroplatinum (D) and tris(1-aziridinil)-phosphine sulfide (E); rabbit heating by microwave at various power flux density and ambient temperatures (F).
Table 2. Parameters of the mathematical model describing the inactivation of various cells and rabbit heating after combined exposure to different environmental factors and hyperthermia (H)
Biological object |
Inactivation |
p1 |
p2 |
Kmax |
N2/N1 |
|
agents |
|
|
|
|
Bacillus subtilis spores |
ϑ + H |
2.2 |
4.5 |
2.5 |
0.5 |
Bacteriophage T4 |
ϑ + H |
2.4 |
1.6 |
2.0 |
1.5 |
Mammalian cells |
ϑ + H |
4.3 |
30 |
4.8 |
0.14 |
Mammalian cells |
Cis-DDP + H |
18.0 |
4.0 |
4.3 |
4.5 |
Mammalian cells |
TAPS + H |
2.7 |
13.7 |
3.2 |
0.2 |
Rabbit |
Microwave + H |
16.0 |
21.0 |
10.0 |
0.76 |
Yeast cells |
ϑ + H |
2.3 |
3.0 |
2.4 |
0.8 |
Yeast cells |
Ultrasound + H |
1.8 |
25.0 |
2.7 |
0.07 |
Yeast cells |
UV light + H |
1.5 |
0.77 |
1.5 |
2.0 |
220
For these cases, initial experimental data and some previous calculation were taken from earlier publications devoted to microwaves [15] and cytostatic preparations [19, 20]. Predicted values of the synergistic enhancement ratio were estimated by Eqn. 4 using the basic parameters p1 and p2 of the model which have been derived (Eqns. 8 and 9) from real experimental results. These parameters together with kmax (Eqn. 7) as well as the ratio N2/N1 (Eqn. 6), at which it can be achieved, are collected in Table 2. This Table also includes the results for diploid yeast cells exposed simultaneously to heat combined with ionizing radiation [26], ultrasound [27] and UV light [28].
7. Conclusions
The main common regularities of the synergistic interaction obtained in this investigation may be summarized as follows. 1) For any constant rate of exposure, the synergy can be observed only within a certain temperature range. 2) The temperature range synergistically increasing the effects of radiations is shifted to lower temperature for thermosensitive objects. 3) Inside this range, there is a specific temperature that maximizes the synergistic effect. 4) A decrease in the exposure rate results in a decrease of this specific temperature to achieve the greatest synergy and vice versa. 5) For a constant temperature at which the irradiation occurs, synergy can be observed within a certain dose rate range. 6) Inside this range an optimal intensity of physical agent may be indicated, which maximizes the synergy. 7) As the exposure temperature reduces, the optimal intensity decreases and vice versa. 8) The recovery rate after combined action is decelerated due to an increased number of irreversible damage. 9) The probability of recovery is independent of the exposure temperature for yeast cells irradiated with ionizing or UV radiation. 10) Chemical inhibitors of cell recovery act through the formation of irreversible damage but not via damaging the recovery process itself.
The remarkable result of this paper concerns the mathematical model that has been proposed to explain the experimental data of synergistic interaction of hyperthermia with other inactivating agents. The model is based on the supposition that synergism takes place due to the additional lethal lesions arisen from the interaction of non-lethal sublesions induced by both agents. These sublesions are considered noneffective after each agent taken alone. The idea of sublesions is widely used in radiobiology [29-31]. In the model, the synergistic effect is given by min{p1N1; p2N2} (Eqn. 2). This means that one sublesion caused by irradiation or chemicals interacts with one sublesion produced by heat. This process is assumed to proceed until the sublesions of the less frequent type is used up. To estimate the basic parameters p1 and p2 we have used the experimental values of the synergistic enhancement ratio k1 and k2 (Eqns. 8 and 9). It means that the model takes into consideration only the actual interaction determining the synergistic effect. The model predicts the dependence of synergistic interaction on the ratio N2/N1 of lethal lesions produced by every agent applied (Eqn. 4), the greatest value of the synergistic effect (Eqn. 7) as well as the conditions under which it can be achieved (Eqn. 6). The model is not concerned with the molecular nature of sublesions, and the mechanism of their interaction remains to be elucidated. In spite of the approximation used in this simplified model, it is evident from the data presented that a good agreement appears to exist between theoretical and