

brechignac_f_desmet_g_eds_equidosimetry_ecological_standardi
.pdf199
Table 1. Averaged data for Kievska region , 1995
Pollutants |
Samples |
Mean |
Minimum |
Maximum |
Std.dev |
CS-137 |
85 |
752.90 |
166.00 |
2800.00 |
542.47 |
SR-90 |
85 |
275.20 |
13.00 |
2065.00 |
336.12 |
CU |
81 |
.42 |
0.00 |
1.50 |
.21 |
ZN |
81 |
1.87 |
.30 |
15.00 |
1.92 |
PB |
81 |
.13 |
.03 |
.44 |
.098 |
CD |
81 |
.005 |
.002 |
.04 |
.004 |
HG |
81 |
.009 |
.002 |
.048 |
.009 |
DDT |
81 |
.028 |
.011 |
.051 |
.009 |
6. Stages of Analysis
1.Estimation of (a) chemical risk and (b) radiation risk due to food ingestion for every farm in accordance with administrative list (it has been done for 10 regions);
2.Ordering of list of the farms in accordance with ascending of (a) chemical risk, (b) radiation risk and (c) total risk.
3.Estimation of total risk.
4.Analysis of chemical, radiation and total risk structure.
7. Results
Some results are shown by the examples for Kievska region and Volinska region.
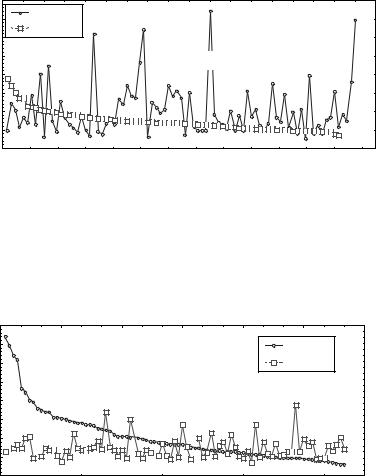
1.Risk due to ingestion of chemical and radiation contaminated food in Kievska region is indicated in Figure 1. Radiation risk and chemical risk in 85 districts and farms are given in accordance with the administrative list.
KIEVSKA REGION
Chemical and radiation risk in case contamination of vegetable ration
Chemical pollutants: lead, cadmium, copper, zinc, mercury, DDT
Radiation pollutants: Cs-137, Sr-90
|
0.0016 |
Radiation |
|
|
Rokitnovsky district |
|
0.0014 |
|
|
||
|
Chemical |
|
|
82-85 |
|
|
|
Bilocerkivsky district |
|||
|
0.0012 |
|
|||
|
|
|
|||
|
0.001 |
Ivankovsky district |
49-57 |
Taraschansky district |
|
|
|
||||
|
|
1-30 |
Vasylkivsky district |
||
Risk |
0.0008 |
58-68 |
Vishgorodsky district |
||
0.0006 |
|
31-48 |
|
||
|
|
|
|
69-81 |
|
|
0.0004 |
|
|
|
|
|
0.0002 |
|
|
|
|
|
0 |
20 |
40 |
60 |
80 |
|
0 |
||||
Districts and farms in accordance with administrative list
Fig. 1. Risk due to ingestion food contaminated by radiation and chemical pollutants.
200
2.Relation of chemical risk and radiation risk is indicated in Figure 2 and Figure 3. In Figure 2 the sequence of districts and farms in Kievska region corresponds to chemical risk ordering, in Figure 3 – to radiation risk ordering.
KIEVSKA REGION
Chemical and radiation risk in case contamination of vegetable ration
Chemical pollutants: lead, cadmium, copper, zinc, mercury, DDT
Radiation pollutants: Cs-137, Sr-90
|
0.0016 |
Radiation |
|
|
|
|
0.0014 |
|
|
|
|
|
Chemical |
|
|
|
|
|
0.0012 |
|
|
|
|
|
|
|
|
|
|
|
0.001 |
|
|
Chemical risk ordering |
|
Risk |
0.0008 |
|
|
|
|
|
|
|
|
||
0.0006 |
|
|
|
|
|
|
|
|
|
|
|
|
0.0004 |
|
|
|
|
|
0.0002 |
|
|
|
|
|
0 |
20 |
40 |
60 |
80 |
|
0 |
Districts and farms in accordance with chemical risk ordering
Fig. 2. Matching radiation risk with chemical risk. Sequence of districts and farms corresponds to chemical risk ordering.
KIEVSKA REGION
Chemical and radiation risk in case contamination of vegetable ration
Chemical pollutants: lead, cadmium, copper, zinc, mercury, DDT
Radiation pollutants: Cs-137, Sr-90
|
0.0016 |
|
|
|
|
|
0.0014 |
|
|
|
Radiation |
|
0.0012 |
|
|
|
Chemical |
|
0.001 |
Radiation risk ordering |
|
|
|
Risk |
0.0008 |
|
|
|
|
0.0006 |
|
|
|
|
|
|
|
|
|
|
|
|
0.0004 |
|
|
|
|
|
0.0002 |
|
|
|
|
|
0 |
20 |
40 |
60 |
80 |
|
0 |
||||
Districts and farms in accordance with radiation risk ordering
Fig. 3. Matching radiation risk with chemical risk. Sequence of districts and farms corresponds to radiation risk ordering.
201
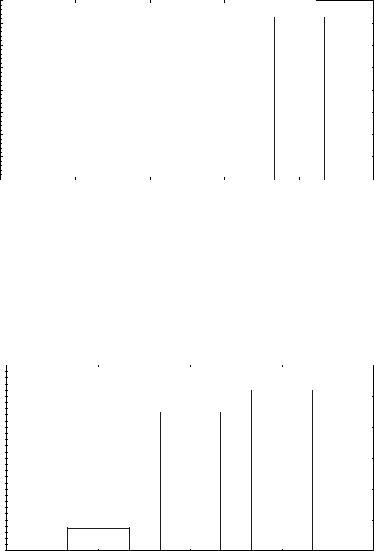
3.The total (chemical plus radiation) risk in Kievska region is indicated in Figure 4. The consequence of districts and farms corresponds to total risk ordering.
KIEVSKA REGION
Total (chemical plus radiation) risk in case contamination of vegetable ration Chemical pollutants: lead, cadmium, copper, zinc, mercury, DDT Radiation pollutants: Cs-137, Sr-90
|
0.002 |
|
|
|
|
|
0.0016 |
|
|
|
|
|
0.0012 |
Total (chemical plus radiation) risk ordering |
|
||
|
|
|
|
|
|
Risk |
0.0008 |
|
|
|
|
|
|
|
|
|
|
|
0.0004 |
|
|
|
|
|
0 |
20 |
40 |
60 |
80 |
|
0 |
||||
Districts and farms in accordance with total risk ordering
Fig. 4. Total (chemical plus radiation) risk. Sequence of districts and farms corresponds to total risk ordering.
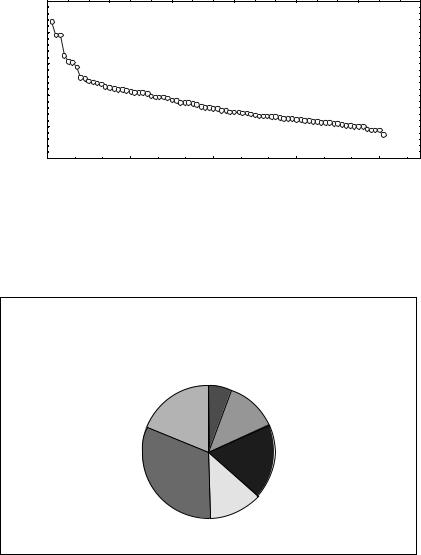
4.The contribution of different pollutants into chemical risk is shown in Figure 5. In this case only vegetable ration contamination is considered the in Kievska region.
KIEVSKA REGION
Structure of risk in case chemical contamination of vegetable ration (mean for region)
DDT, 18.9 % |
copper, 5.7 % |
|
zinc, 12.6 % |
||
|
lead, 18.4 %
mercury, 31.5 %
cadmium, 12.9 %
Fig. 5. Contributon different pollutants to chemical risk.
202
5.Structure of risk is demonstrated in Figure 6 for the case of chemical and radiation food contamination in Kievska region. (The information about chemical milk and meat contamination is absent).
Mean risk
KIEVSKA REGION
Structure of risk in case chemical and radiation contamination of food (mean for region)
0.0016 |
|
|
|
|
|
|
Total |
|
|
|
|
|
|
|
0.0014 |
|
|
|
|
|
|
|
|
|
|
|
|
||
0.0012 |
|
|
|
|
0.001 |
|
Radiation: |
|
|
|
|
|
|
|
|
|||
0.0008 |
|
milk+meat |
|
|
|
|
|
|
|
|
|||
|
|
|
|
|
|
|
|
|
|
|
|
|
|
0.0006 |
|
|
|
|
|
Radiation: |
|
|
|
|
|
|
|
|
|
|
|
|
|
|
Chemical: |
|
|
||||
|
|
|
|
|
|
vegetables |
|
|
|
|
|||
0.0004 |
|
|
|
|
|
|
|
vegetables |
|
|
|||
|
|
|
|
|
|
|
|
|
|
|
|||
|
|
|
|
|
|
|
|
|
|
||||
0.0002 |
|
|
|
|
|
|
|
|
|
|
|
|
|
|
|
|
|
|
|
|
|
|
|
|
|
|
|
0 |
|
|
|
|
|
|
|
|
|
|
|
|
|
|
|
|
|
|
|
|
|
|
|
|
|
|
|
Fig. 6. Structure of risk in case chemical and radiation contamination food. The information about chemical contamination of milk and meat is absent.
6.Chemical risk exceeds radiation risk in situation which is shown in Figure 7. This is the example for Volinska region; only vegetable ration contamination is considered, information about milk and meat contamination is absent.
Mean risk
VOLINSKA REGION
Structure of risk in case chemical and radiation contamination of vegetable ration (mean for region)
0.00036 |
|
|
|
|
|
|
|
|
|
|
|
|
|
|
|
|
|
|
|
|
|
|
|
|
|
|
|
|
|
|
|
|
Total |
|
|
0.0003 |
|
|
|
Chemical: |
|
|
|
||||
|
|
|
|
|
|
|
|
|
|||
|
|
|
|
|
|
|
|
|
|||
|
|
|
vegetables |
|
|
|
|
|
|
||
|
|
|
|
|
|
|
|
|
|
||
0.00024 |
|
|
|
|
|
|
|
|
|
|
|
|
|
|
|
|
|
|
|
|
|
|
|
|
|
|
|
|
|
|
|
|
|
|
|
0.00018 |
|
|
|
|
|
|
|
|
|
|
|
0.00012 |
|
|
|
|
|
|
|
|
|
||
|
Radiation: |
|
|
|
|
|
|
|
|
||
|
|
vegetables |
|
|
|
|
|
|
|
|
|
0.00006 |
|
|
|
|
|
|
|
|
|
|
|
|
|
|
|
|
|
|
|
|
|
|
|
0
Fig. 7. Structure of risk in case chemical contamination vegetable ration. The information about contamination of milk and meat is absent.
203
8. Conclusion
It is proposed the method of estimation of risk due to combined radiation and chemical food contamination.
This method is the synthesis of ”Maximum Permissible Concentration” (MPC) methodology of the Former USSR and methodology of the U.S. Environmental Protection Agency (US EPA). The pseudo-slope-factors are introduced in this method. They are calculated on the base of approximation of threshold criteria (MPC) by nonthreshold criteria.
This method was used for analysis of situation in 10 regions of Ukraine. In particular, it is shown that chemical risk may exceed radiation risk. The some results of this analysis are illustrated by examples for Kievska and Volinska regions.
9.References
1.Gabovich R.D., Priputina L.S. Hygienic base of safe food from bad chemical pollutants. Kiev, “Zdorova”, 1987
2.Risk Assessment Guidance for Superfund: EPA/540/1-89/002, 92; EPA/630/R-95; Publication 9285.7-01B; Publication 9285.7-01C; Directive 9285.6-03.
3.ICRB Publication 45 (1985), “Quantitative Based for Developing a Unified Index of Harm”, International Commission on Radiological protection, Pergamon Press, Oxford, New Yokk, Toronto, Sydney, Frankfurt.
4.The Integrated Risk Information System (IRIS), U.S. Environmental Protection Agency (U.S. EPA), the electronic data base, http://www.epa.gov/iris/intro.htm
Part 5.
Problems of Synergism of Different
Pollutants
SYNERGETIC EFFECTS OF DIFFERENT POLLUTANTS AND EQUIDOSIMETRY
V.G. PETIN, G.P. ZHURAKOVSKAYA
Medical Radiological Research Centre, 249036 Obninsk, Kaluga Region, RUSSIA
Jin Kyu KIM
Korea Atomic Energy Research Institute, 150 Dukjin-dong, Yusong-gu,
Taejon, 305-353
KOREA
1. Introduction
Living organisms and ecosystems are never exposed to merely one harmful agent. Many physical, chemical, biological and social factors may simultaneously exert their deleterious influence to man and the environment. Risk assessment is generally performed with the simplest assumption that the factor under consideration acts largely independently of others. However, the combined exposure to two harmful agents could result in a higher effect than would be expected from the addition of the separate exposures to individual agents [1-3]. Hence, there is a possibility that, at least at high exposures, the combined effect of ionizing radiation with other environmental factors can be resulted in a greater overall risk. The problem is not so clear for low intensity and there is no possibility of testing all conceivable combinations of agents. Moreover, there are contradictions in literatures devoted to synergy problems relative to interaction effectiveness in the dependence of dose of applied agents and their intensity which resulted in various opinions about the importance of the synergistic interaction at low intensity of harmful agents found in biosphere [2-5].
A lot of experimental data were obtained in our laboratories for action of various agents combined with hyperthermia [6-10]. For these cases, it was shown that synergistic enhancement ratio increases, reaches the highest value and then drops with increasing in the ambient temperature. This dependence suggests that the equi-effective synergy may be realized at various temperatures. To gain some more insight into the mode of interaction, we have had to implement the following tasks in this paper. 1) To reveal a common peculiarities of synergistic interaction display. 2) To study postradiation cell recovery after combined actions. 3) To suggest a unified biophysical conception of synergistic interaction that permits to interpret the revealed regularities and to advance some conclusions to combinations not yet tested. 4) On this basis, to formulate a common mathematical model to describe, optimise and predict the synergistic effects. 5) To prove the condition under which the highest or any equieffective values of the synergistic enhancement ratio can be achieved. 6) To compare the model predictions with experimental results. 7) To demonstrate that for any fixed intensity of one agent the synergistic effect might be increased, decreased or stayed without change with alteration in the intensity of another agent. The results obtained are discussed from the viewpoint of potential significance of synergistic interaction of deleterious agents delivered at intensities occurred in the human environment.
207
F. Brechignac and G. Desmet (eds.), Equidosimetry, 207–222.
© 2005 Springer. Printed in the Netherlands.
208
2. Materials and methods
The following yeast strains were used in the experiments: Zygosaccharomyces bailii (haploid), Saccharomyces cerevisiae (two diploid strains, XS800 and T1), Endomyces magnusii (diploid). Cells were incubated before irradiation for 3-5 days at 30oC on a complete nutrient agar layer to a stationary phase. Homogeneous cell populations were treated at stationary phase of growth.
The 60Co ϑ-ray source was a Gammacell 220 (Atomic Energy of Canada LTD). The ϑ-ray dose-rate was 10 Gy/min. The electron beam from a 25 MeV pulsed linear accelerator was also used in these experiments. The average dose rates were 5 and 25 Gy/min as determined by ferrous sulphate dosimeter.
For UV exposure, cells were irradiated with germicidal lamps that emitted predominantly UV light of wavelength 254 nm at fluence rates of 0.15 and 1.5 W/m2. Variation of the intensity was achieved by means of calibrated metal wire nets. The fluence rates were measured using a calibrated General Electrical germicidal meter.
A continuous mode of sonication was accomplished by a 20 kHz ultrasonic unit (Fisher sonic dismembrator). The ultrasonic dose rates were 0.05 and 0.2 W/cm2 which were measured by the calorimetric method. For sonication, 0.1 ml of cell suspension (108 cells/ml) at room temperature was put into 9.9 ml of sterile water which was placed into a metal vessel constructed together with the transducer. To determine the effect induced by ultrasound alone, the absorbed ultrasound heat was completely removed by cooling with water.
Hyperthermia was given in a water bath where a desired temperature ±0.1 °C was maintained. For the simultaneous action of hyperthermia and other agents, the time interval between the introduction of the cells into the preheated water and the beginning of exposure was about 0.1-0.3 min, which was significantly less than the total treatment time. At the end of the treatment, the samples were rapidly cooled to room temperature. Therefore, the duration of physical agent treatment and heat exposure were (was) identical.
After treatment with each agent applied alone or combined simultaneously with heat, a known number of cells were plated so that 150-200 colonies per dish would form by the surviving yeast cells after 5-7 days of incubation at 30°C. All experimental series were repeated 3-5x.
Exposure to radiofrequency radiation (RFR) was performed in a temperaturecontrolled anechoic chamber. The air temperatures in the chamber were adjusted to 22, 30, and 38 ρ 0.2θC. Shinella rabbits were individually exposed to 7-GHz microwave radiation at the following power density: 0, 10, 15, 20, 30 and 100 mW/cm2. The corresponding specific absorption rate was 0.75, 1.12, 1.50, 2.25, and 7.5 W/kg. A modified medical thermometry unit was used to monitor body temperature during exposure. The synergistic enhancement ratio was determined by the ratio of body temperature increments observed in experiments after simultaneous action of both factors) to that expected for additive summation of thermal effects from microwaves alone and high ambient temperature alone estimated for any identical duration of exposure.
209
3. Selected experimental results
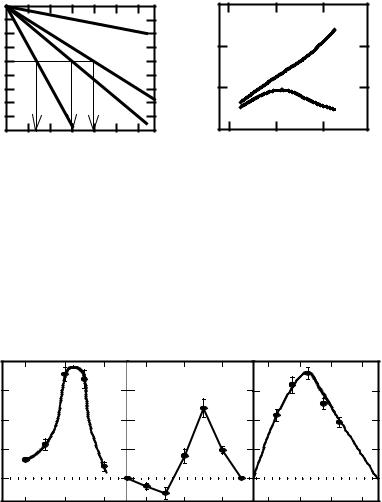
Fig. 1A provides an example of the basic experimental data used in this investigation. Four types of survival curves were obtained for every condition of thermoradiation action: a heat treatment alone (curve 1), ionizing radiation (or another physical agent or chemical compound) without heating (curve 2), composite simultaneous heat and radiation exposure (curve 4). Curve 3 represents a theoretically expected survival curve that would be obtained if inactivation by composite heat and radiation were completely independent. To estimate quantitatively the sensitisation action of hyperthermia, one can apply the thermal enhancement ratio [11], defined as t3/t1 (Fig. 1). This ratio indicates an increase in cell radiosensitivity by high temperature. However, it does not reflect the kind of interaction. To evaluate the synergistic effect we used the synergistic enhancement ratio [6-10], defined as t2/t1 (Fig. 1).
As an example, the thermal enhancement ratio (curve 1) and the synergistic enhancement ratio (curve 2) are plotted in Fig. 1B against the irradiation temperature for diploid yeast cells. It is curious that the thermal enhancement ratio increases indefinitely with increasing exposure temperature, while the synergistic enhancement ratio at first increases, then reaches a maximum, which is followed by a decrease. This implies that a synergistic interaction between hyperthermia and ionizing radiation is observed only within a certain temperature range. Noteworthy is the fact that such a dependence of the synergistic effect on temperature under which the exposure occurred was obtained for diploid yeast cells upon the simultaneous combination of hyperthermia with ionizing radiation (Fig. 2A), UV light (Fig. 2B), ultrasound (Fig. 2C), and for mammalian cells inactivated by some chemicals and heat (Fig. 3). Hence, one can conclude that for a given intensity of physical factors or concentration of chemical agents there should be a specific temperature that maximizes the synergistic interaction. Any deviation of temperature from the optimal value results in a decrease of synergism. Another example of similar synergy pattern is shown in Fig. 4. Here again, the dependence of the synergistic enhancement ratio upon the exposure temperature is depicted for relatively thermosensitive (Endomyces magnusii, curve 1) and thermoresistance (Saccharomyces ellipsoideus, curve 2) diploid yeast strains. One can see that the temperature range strengthening the effect of ionizing radiation has been shifted toward the lower temperatures for temperature-sensitive cell lines. Thus, it can be concluded that the synergistic interaction between hyperthermia and other inactivated agents is realized only within a certain temperature range independently of the object analyzed. For temperatures below this temperature range, the synergistic effect was not observed and cell killing was mainly determined by the damages induced by ionizing radiation. For temperatures above this temperature range, the synergistic effect was also not observed but cell killing was chiefly caused by hyperthermia. It follows that for a given intensity of physical factors or concentration of chemical agents there would be a specific temperature that maximizes the synergistic interaction. Any deviation of the exposure temperature from optimal value will result in a decrease of the synergistic interaction. These results, besides being an important key for searching the synergy, can be considered as an indication of the possibility to optimize and achieve a desirable level of synergy.
210
survival |
10 |
2 |
|
|
|
|
|
A |
4 |
|
|
 |
10 |
1 |
|
|
|
|
|
T ER , k |
|
1 |
|||
10 |
-2 |
|
|
|
|
|
|
|
|
|
||
|
10 |
0 |
|
|
|
|
|
1 |
3 |
|
|
|
|
10 |
-1 |
|
|
|
|
|
|
|
|
||
Perñent |
10 |
-3 |
t1 |
|
t2 |
|
t3 |
2 |
|
|
|
|
|
10 |
-4 |
|
|
4 |
|
|
2 |
|
|
|
|
|
|
|
|
|
|
|
|
2 |
||||
|
10 |
-5 |
|
|
|
|
|
3 |
|
|
|
|
|
10 |
-6 |
|
|
|
|
|
|
1 |
|
|
|
|
10 |
-7 |
|
|
|
|
|
|
|
|
|
|
|
|
0 |
4 |
8 |
12 |
16 |
20 |
24 |
50 |
52 |
54 |
|
Exposure tim e, m in |
Tem perature, oC |
Fig. 1. Example of the basic experimental data. A. Survival curves of haploid yeast cell: curve 1 - heat treatment (45 oC) alone; curve 2 - ionizing radiation (60Co) at about 10 Gy/min and room temperature; curve 3 - calculated curve for independent action of ionizing radiation and heat; curve 4 - experimental curve after simultaneous thermoradiation action. B. The dependence of the thermal enhancement ratio (curve 1) and the synergistic enhancement ratio (curve 2) against the irradiation temperature.
|
|
2 ,0 0 |
|
À |
|
|
|
 |
|
|
Ñ |
|
|
|
|
|
|
|
|
|
|||
|
enhancement ratio |
1 ,7 5 |
|
|
|
|
|
|
|
|
|
Synergistic |
1 ,5 0 |
|
|
|
|
|
|
|
|
|
|
1 ,2 5 |
|
|
|
|
|
|
|
|
|
||
1 ,0 0 |
|
|
|
|
|
|
|
|
|
||
|
|
|
|
|
|
|
|
|
|
|
|
|
|
4 5 |
5 0 |
5 5 |
4 5 |
5 0 |
5 5 |
5 0 |
5 2 |
5 4 |
5 6 |
|
|
|
|
T e m p e r a t u r e , o C |
|
|
|
||||
Fig. 2. The dependence of the synergistic enhancement ratio upon the exposure temperature for diploid Saccharomyces cerevisiae yeast cells (strain XS800) simultaneously exposed to heat and ionizing radiation (A), UV light (B) and ultrasound
(C). Error bars show inter-experimental standard errors.