

Ammonia Technology Roadmap |
Chapter 2. The future of ammonia production |
Towards more sustainable nitrogen fertiliser production |
|
About 45% of the emission reductions to 2050 in the Sustainable Development Scenario come from deploying near-zero-emission technologies, comprising CCS-equipped and electrolysis-based hydrogen production. Almost 30% of the CO2 savings through to 2050 result from ammonia production via electrolytic hydrogen growing to 27% of total ammonia production in 2050, from a position of initial projects about to start operating today. Similarly, another 16% of emissions are saved cumulatively via permanent storage after capture from ammonia production, a greater than 50 times increase by 2050 relative to today’s storage volumes from this CO2 emissions source.
Ammonia direct CO2 emission reductions in the Sustainable Development Scenario by mitigation strategy
Mt CO2/yr
|
Ammonia direct emission reductions |
|
Cumulative direct emission |
|||||
500 |
|
|
|
|
|
|
reductions between 2021 and 2050 |
|
|
|
|
|
|
|
|
|
|
400 |
|
|
|
|
|
STEPS |
16% |
|
|
|
|
|
|
|
|
21% |
|
300 |
|
|
|
|
|
|
|
|
|
|
|
|
|
|
|
|
|
200 |
|
|
|
|
|
|
24% |
|
|
|
|
|
|
|
|
|
|
100 |
|
|
|
|
|
SDS |
|
29% |
|
|
|
|
|
10% |
|
||
|
|
|
|
|
|
|
||
|
|
|
|
|
|
|
|
|
0 |
2025 |
2030 |
2035 |
2040 |
|
|
|
|
2020 |
2045 |
2050 |
|
|
||||
|
Nutrient use and material efficiency |
Electrolytic hydrogen |
|
|||||
|
Other fuel shifts |
|
|
Technology performance |
|
|||
|
CCS |
|
|
|
|
|
|
|
IEA, 2021.
Notes: STEPS = Stated Policies Scenario; SDS = Sustainable Development Scenario; CCS = carbon capture and storage.
Only an array of mitigation measures can significantly reduce emissions from ammonia production. Nutrient use and material efficiency, electrolytic hydrogen and CCS account for two-thirds of the cumulative emission reductions in the Sustainable Development Scenario.
Innovative technology pathways
Overview of global and regional technology trends
Whether in natural gas-based5 or coal gasification-based routes, the CO2 emissions stemming from the feedstock energy use for hydrogen production (process emissions) are inherently captured as part of the ammonia manufacturing process, which makes CCS a particularly competitive option for substantial emission reductions from ammonia production (see Chapter 2,
5 Applicable both to steam methane reforming (SMR) and auto-thermal reforming (ATR) technologies.
PAGE | 89
IEA. All rights reserved.
Ammonia Technology Roadmap |
Chapter 2. The future of ammonia production |
Towards more sustainable nitrogen fertiliser production |
|
“Readiness, competitiveness and investment”). The resulting CO2-rich stream only requires purification and compression to make it suitable for transporting and geological storage. By 2050 in the Sustainable Development Scenario, 200 Mt CO2 are captured, 17% of which are energy-related emissions and 83% process emissions. Of the process emissions captured, 65% are utilised for urea production, and 35% are permanently stored. In the Net Zero Emissions by 2050 Scenario a higher share of energy-related emissions is captured (33% of total capture), as the process emissions are nearly fully abated in many regions.
In both scenarios some of the CO2 required for urea has to be obtained from sources other than the process CO2 emission streams of ammonia plants. These volumes, at around 4% of total CO2 capture in the Sustainable Development Scenario and 11% in the Net Zero Emissions by 2050 Scenario in 2050, could be sourced from the energy-related emissions of ammonia production that are captured for permanent storage, or more sustainably from an indirect emissions perspective, from the power and fuel transformation sector, through the use of DAC or from biogenic CO2 sources.
The concentration of CO2 in energy-related emissions from ammonia production (3-13% by volume) is typically significantly lower than that of process emission streams (> 95% by volume), which increases the energy requirements to separate it from the flue gas stream. This is particularly relevant for SMR plants. Virtually all current natural gas-based production uses SMR. Existing SMR facilities have a higher proportion of their total CO2 emissions as flue gas relative to ATR technologies – the likely choice for new-build CCS-equipped plants – which generate around 90% of their emissions in a concentrated stream as process emissions. The CO2 capture unit that is integrated into conventional ammonia plants to handle the concentrated CO2 generated from feedstock is typically specified for that process stream and not able to treat the additional volumes from flue gases. The expansion of such a unit or the integration of an additional capture unit (depending on the possibilities at each individual site) would be needed to allow for full capture of the CO2 generated at a site using an SMR. Another option for retrofitting SMR plants could be to meet the process energy requirements using electrolytic hydrogen, generated on site or imported from merchant hydrogen plants. Process CO2 emissions capture would still be required, but this would avoid the need to capture the more dilute energy-related flue gas stream, which would no longer contain CO2.
PAGE | 90
IEA. All rights reserved.
Ammonia Technology Roadmap |
Chapter 2. The future of ammonia production |
Towards more sustainable nitrogen fertiliser production |
|
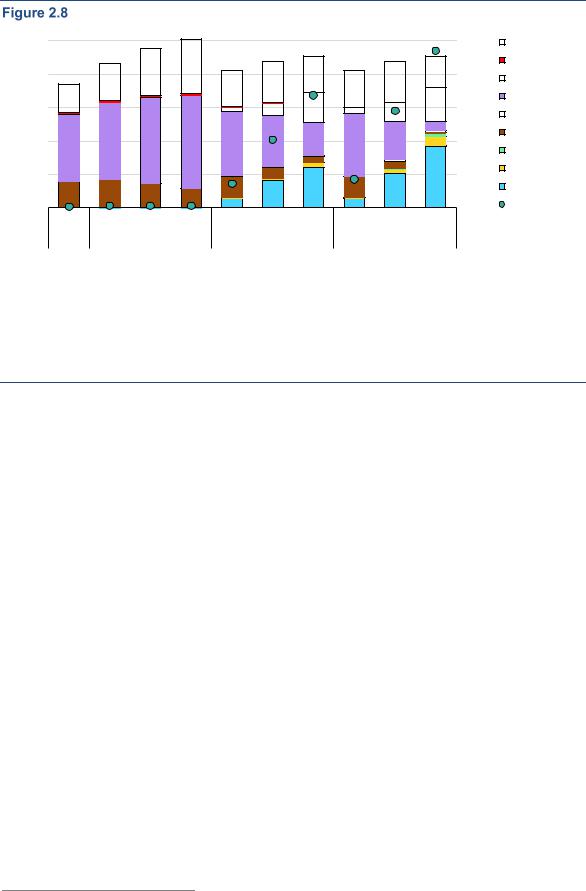
Global ammonia production by technology and scenario
Mt
250 |
|
|
|
|
|
|
|
|
100% |
Fossil with CCU |
200 |
|
|
|
|
|
|
|
|
80% |
Oil |
|
|
|
|
|
|
|
|
Gas with CCS |
||
|
|
|
|
|
|
|
|
|
|
|
150 |
|
|
|
|
|
|
|
|
60% |
Gas |
|
|
|
|
|
|
|
|
Coal with CCS |
||
|
|
|
|
|
|
|
|
|
|
|
100 |
|
|
|
|
|
|
|
|
40% |
Coal |
|
|
|
|
|
|
|
|
Biomass |
||
|
|
|
|
|
|
|
|
|
|
|
50 |
|
|
|
|
|
|
|
|
20% |
Pyrolysis |
|
|
|
|
|
|
|
|
Electrolysis |
||
|
|
|
|
|
|
|
|
|
|
|
0 |
|
|
|
|
|
|
|
|
0% |
Near-zero share |
2020 |
2030 |
2040 |
2050 |
2030 |
2040 |
2050 |
2030 |
2040 |
2050 |
|
|
|
STEPS |
|
|
SDS |
|
|
NZE |
|
|
IEA, 2021.
Notes: STEPS = Stated Policies Scenario; SDS = Sustainable Development Scenario; NZE = Net Zero Emissions by 2050 Scenario; CCS = carbon capture and storage; CCU = carbon capture and utilisation for urea production. Near-zero share = aggregated share of near-zero-emission routes, excluding CCU.
Near-zero-emission ammonia production routes account for 50% of total production by 2050 in the Sustainable Development Scenario and 73% in the Net Zero Emissions by 2050 Scenario.
Electrolysis is the other innovative technology pathway that plays a major role in the Sustainable Development Scenario and the Net Zero Emissions by 2050 Scenario. Water electrolysers6 have been used in several industrial plants commercially over the past century, including for ammonia production using hydropower (see Chapter 1), although their use is not widespread today due to their higher cost relative to fossil fuel-based ammonia production. For this route to achieve substantial reductions in both direct and indirect emissions, it needs to be powered by low-carbon electricity. In the Sustainable Development Scenario the CO2 intensity of grid electricity drops by 56% by 2030 (75% in the Net Zero Emissions by 2050 Scenario, in which electricity generation would already be at net zero in 2048). In addition to grid-connected arrangements, dedicated VRE installations for ammonia production are also attracting growing interest (see Table 2.2). These could lead to zero-emission production, including both direct and indirect emissions. In the Sustainable Development Scenario 27% (60 Mt) of the ammonia produced globally in 2050 relies on electrolysis, more than China’s current annual ammonia production. In the Net Zero Emissions by 2050 Scenario this share reaches 41% by 2050 (92 Mt), limited from going further in many regions by the need to provide CO2 from carbon-containing feedstocks for urea production.
Methane pyrolysis also plays an important role in specific regions, accounting for around 7 Mt of ammonia production by 2050 in the Sustainable Development
6 This is aside from the use of brine electrolysis to produce chlorine, which is the dominant pathway in this industry.
PAGE | 91
IEA. All rights reserved.
Ammonia Technology Roadmap |
Chapter 2. The future of ammonia production |
Towards more sustainable nitrogen fertiliser production |
|
Scenario. Biomass gasification is a technology that is not deployed in any region in this scenario due to its high projected costs and low technology maturity (no plants are being pursued using this technology today). In the Net Zero Emissions by 2050 Scenario methane pyrolysis reaches production of 15 Mt by 2050, and as the innovation cycles of early-stage technologies are compressed in this scenario, biomass gasification plays a minor role (production of around 6 Mt by 2050 globally). This occurs in regions with access to plentiful supplies of sustainable bioenergy to alleviate the sourcing of carbon for urea production, which becomes more difficult as the carbon-intensive routes are phased out more quickly.
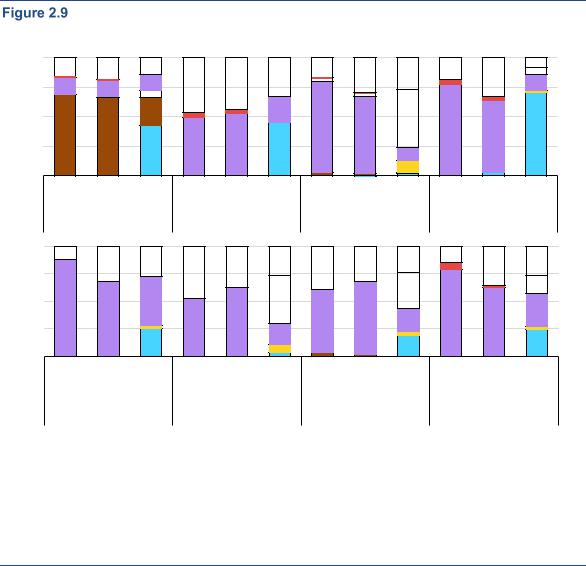
Underlying these technology pathways at the global level are important regional nuances. Both the Sustainable Development Scenario and Net Zero Emissions by 2050 Scenario are modelled regionally, but the results for the latter are only presented globally in this technology roadmap. We use the Sustainable Development Scenario to shed light on some of the major regional dynamics.
Ammonia production by process route and scenario in major ammoniaproducing regions
100%
75%
50%
25%
0%
2020 |
2050 |
2050 |
2020 |
2050 |
2050 |
2020 |
2050 |
2050 |
2020 |
2050 |
2050 |
|
STEPS |
SDS |
|
STEPS |
SDS |
|
STEPS |
SDS |
|
STEPS |
SDS |
|
China |
|
|
India |
|
North America |
|
Europe |
|
||
100%
75%
50%
25%
0%
2020 |
2050 |
2050 |
2020 |
2050 |
2050 |
2020 |
2050 |
2050 |
2020 |
2050 |
2050 |
|
STEPS |
SDS |
|
STEPS |
SDS |
|
STEPS |
SDS |
|
STEPS |
SDS |
|
Eurasia |
|
|
Middle East |
|
|
Africa |
|
Central and South |
||
|
|
|
|
|
|
|
|
|
|
America |
|

 Electrolysis
 Pyrolysis
 Coal
Coal 
 Coal with CCS
 Gas
Gas 
 Gas with CCS
 Oil
Oil 
 Fossil with CCU
IEA, 2021.
Notes: STEPS = Stated Policies Scenario; SDS = Sustainable Development Scenario; CCS = carbon capture and storage; CCU = carbon capture and utilisation for urea production.
The electrolysis route makes important inroads in certain regional markets with access to low-cost renewable electricity and relatively high natural gas prices.
PAGE | 92
IEA. All rights reserved.