

Part IV - Well productivity estimating methods
.pdfGeological uncertainty
1 |
2 |
3 |
4 |
5 |
Prepared by Alexey Khrulenko, 2011
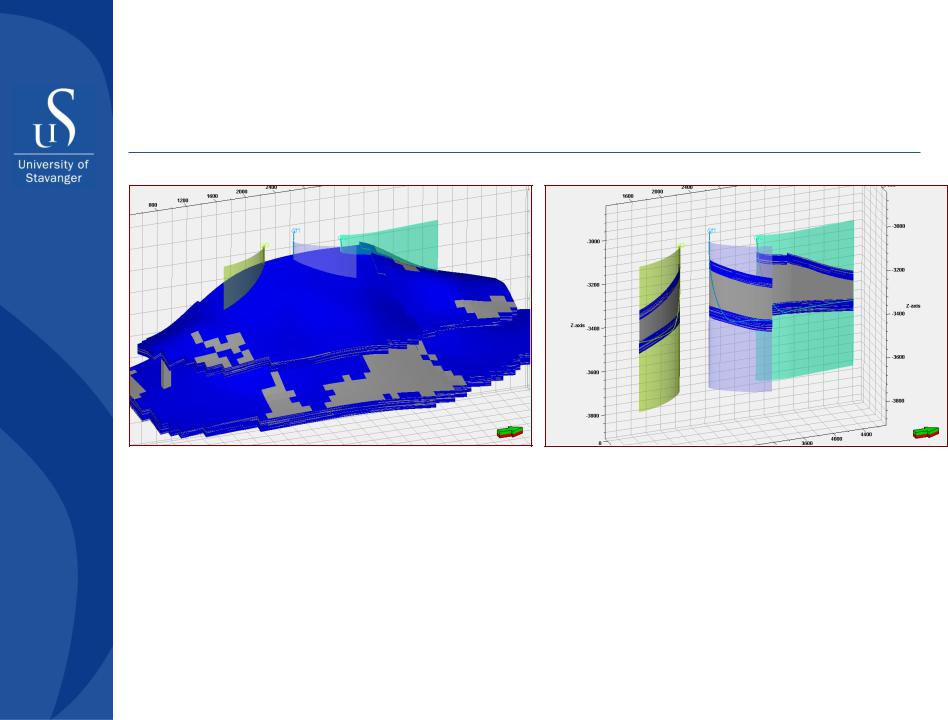
Drainage Strategy
62
Prepared by Alexey Khrulenko, 2011
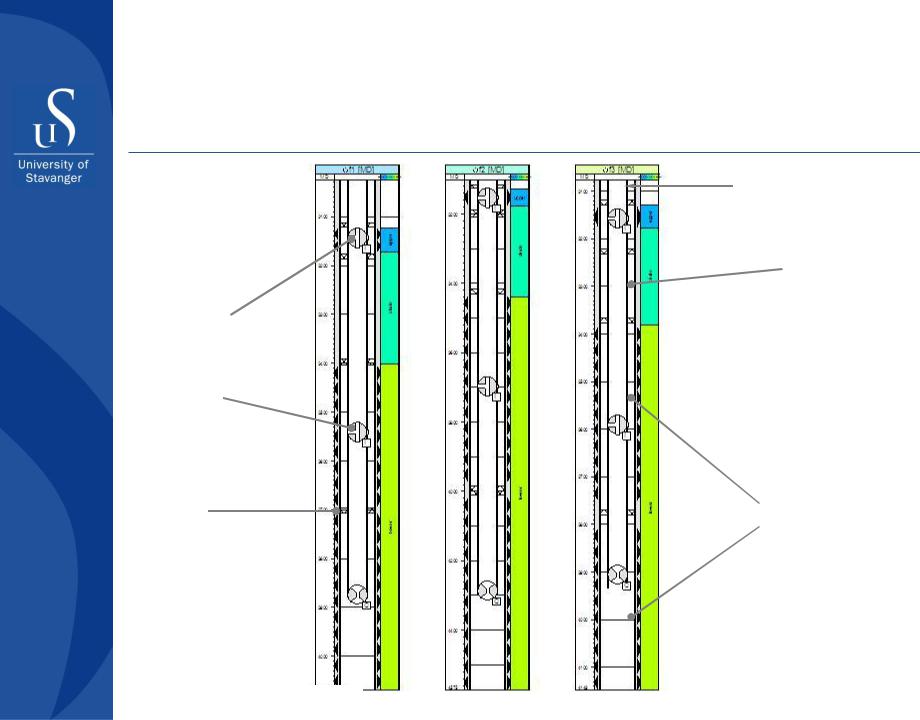
Well completion scenario
Tubing
Casing
ICVs
Packer |
Perforation |
|
intervals |
||
|
63
Prepared by Alexey Khrulenko, 2011
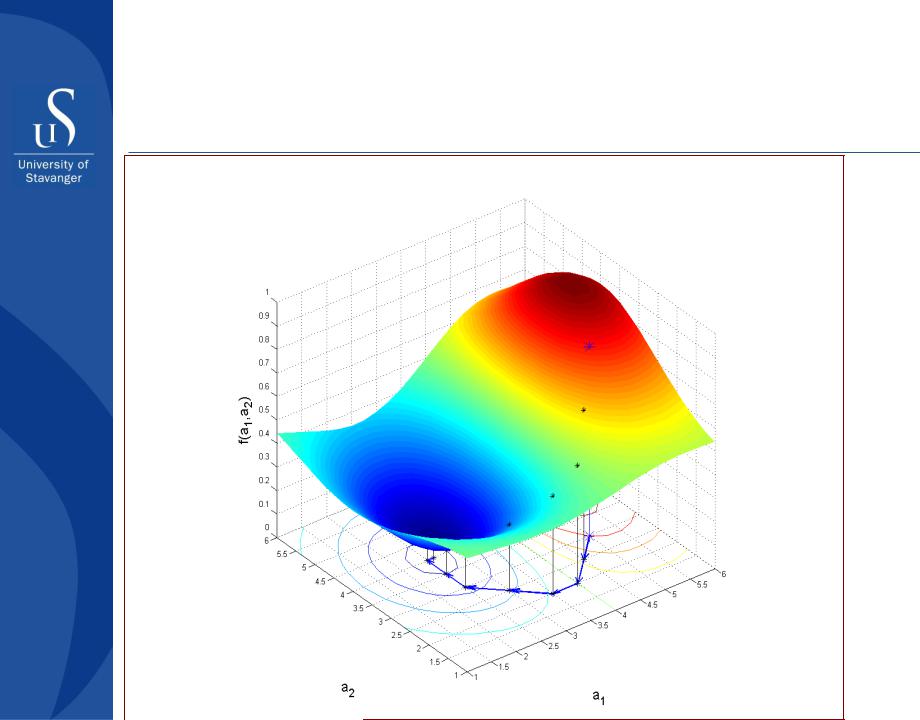
ICV Optimization Methodology
64
Prepared by Alexey Khrulenko, 2011
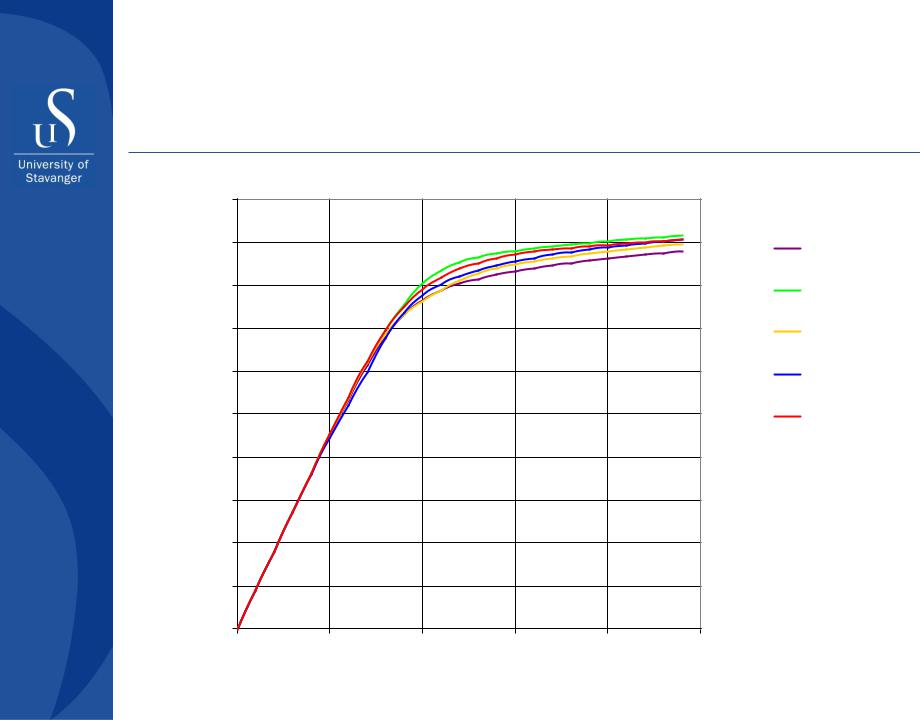
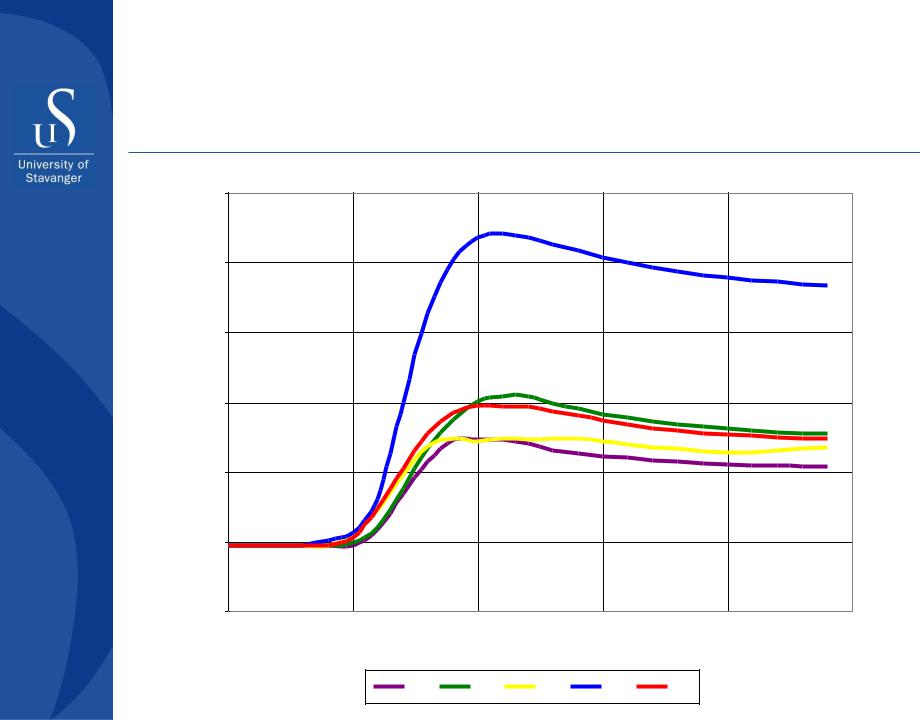
Simulation Results: Cumulative oil production with ICVs and its incremental volumes as compared with ordinary completion wells
20
18
16
, |
|
|
|
нефти |
|
|
|
production,oilCum million |
14 |
||
|
|||
3 |
12 |
||
добыча |
м3 |
||
|
|||
станд |
|
||
Sm |
|
||
|
. |
|
|
Накопленная |
млн |
10 |
|
|
|||
|
. |
|
|
|
|
8 |
|
|
|
6 |
|
4
2
0
0 5 10 15 20 25
Время, лет
Prepared by Alexey Khrulenko, 2011
Years
QQн #1o, Scen(ВТЗ) 1
QQн #2o, Scen(ВТЗ) 2
QQн #3o, Scen(ВТЗ) 3
QQн #4o, Scen(ВТЗ) 4
QQн #5o, Scen(ВТЗ) 5
ПриростIncremental,Qн для #11
ПриростIncremental,Qн для #22
ПриростIncremental,Qн для #33
ПриростIncremental,Qн для #44
ПриростIncremental,Qн для #55
Discounted effect, ICVs performance
|
|
500 |
|
|
|
|
|
|
|
, |
|
400 |
|
|
|
|
|
|
|
|
|
|
|
|
|
|
|
|
|
million |
|
300 |
|
|
|
|
|
|
|
эффект |
|
|
|
|
|
|
|
|
|
$ |
|
|
|
|
|
|
|
|
|
effect, |
млн. $ |
200 |
|
|
|
|
|
|
|
|
|
|
|
|
|
|
|
||
Discounted |
100 |
|
|
|
|
|
|
|
|
|
|
|
|
|
|
|
|
||
Дисконтированный |
0 |
|
|
|
|
|
|
|
|
|
|
0 |
5 |
|
10 |
|
15 |
20 |
25 |
|
|
-100 |
|
|
|
|
|
|
|
|
|
|
|
|
Time, years |
|
|
|
|
|
|
|
|
|
Время, лет |
|
|
||
Prepared by Alexey Khrulenko, 2011 |
|
#1 |
#2 |
#3 |
#4 |
#5 |
|
||
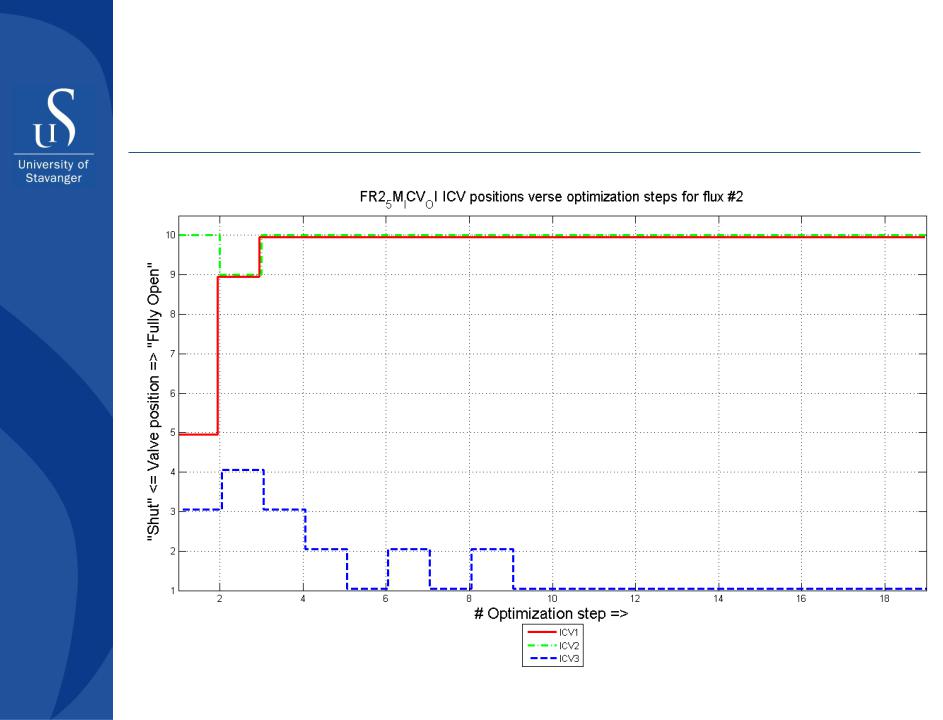
Position of ICV in one of the wells
Prepared by Alexey Khrulenko, 2011

Uncertainty in Forecasting
a Well Productivity
15 September 2012 |
68 |
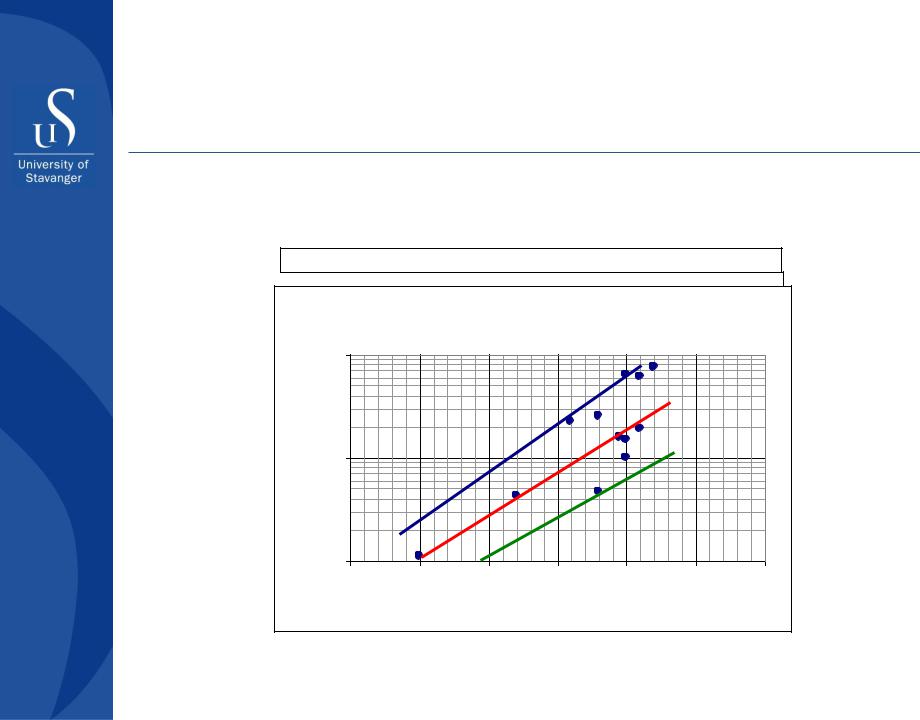
Uncertainty in Forecasting a Well
Productivity
Porosity-permeability correlation |
||||||||
|
|
|
Sorokin Trend, Triassic sandstones |
|
|
|||
|
|
|
|
Depth - po osity trend |
|
|
||
|
|
|
Sorokin Trend, Triassic sandstones |
|
|
|||
|
|
|
Porosity-permeability trend |
|
|
|||
|
|
|
|
Depth - permeability trend |
|
|
||
|
0.35 |
|
|
|
|
|
|
|
|
10080.3 |
|
|
|
|
|
|
|
mD |
70.25 |
|
|
|
|
|
|
|
60 |
|
|
|
|
|
|
|
|
Permeability,Porosity |
0.2 |
|
|
|
|
|
|
|
mD |
50 |
|
|
|
|
|
|
|
Permeability, |
0.15 |
|
|
|
|
|
|
|
|
40 |
|
|
|
|
|
|
|
|
0.1 |
|
|
|
|
|
|
|
|
130 |
|
|
|
|
|
|
|
|
0.05 |
|
|
|
|
|
|
|
|
20 |
|
|
|
|
|
|
|
|
10 0 |
|
|
|
|
|
|
|
|
0 |
0 |
500 |
1000 |
1500 |
2000 |
2500 |
3000 |
|
|
|
|
|
|
|
|
|
|
0 |
|
500 |
1000 |
1500 |
2000 |
2500 |
3000 |
|
|
|
|
|
Depth, m |
|
|
|
|
1 |
|
|
|
Depth, m |
|
|
|
|
0.05 |
0.1 |
0.15 |
0.2 |
0.25 |
0.3 |
0.35 |
|
|
|
|
|
|
Porosity |
|
|
|
15 September 2012 |
|
|
|
|
|
|
|
69 |
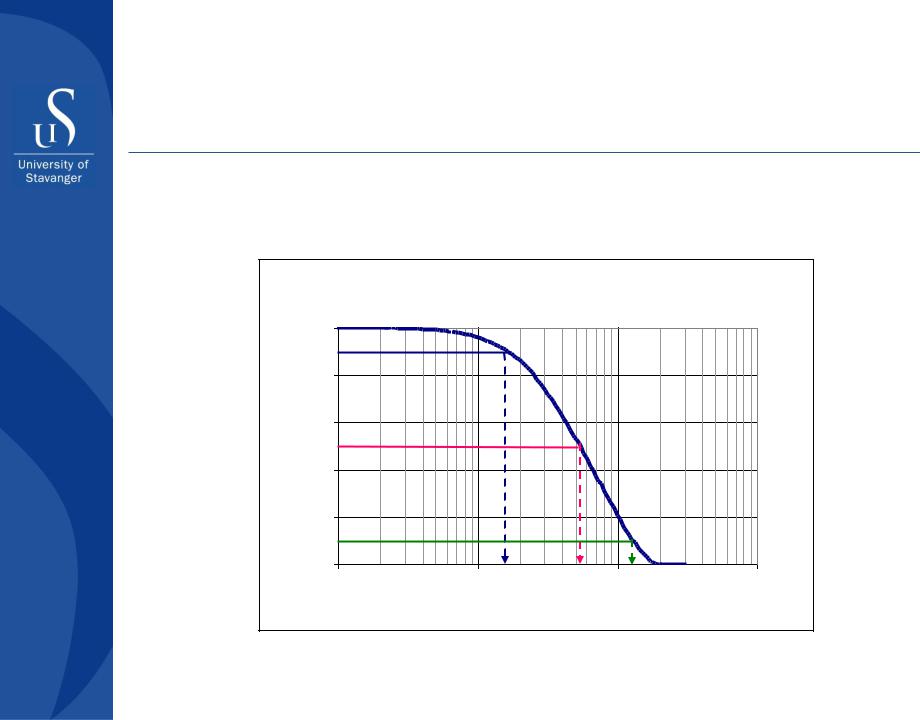
Uncertainty in Forecasting a Well
Productivity
Production rate forecast
Production rate
|
1.0 |
|
|
|
distribution |
0.8 |
|
|
|
0.6 |
|
|
|
|
|
|
|
|
|
Cumulative |
0.4 |
|
|
|
0.2 |
|
|
|
|
|
|
|
|
|
|
0.0 |
|
|
|
|
100 |
1000 |
10000 |
100000 |
Rate, bopd
15 September 2012 |
70 |