

BY REGION |
1 |
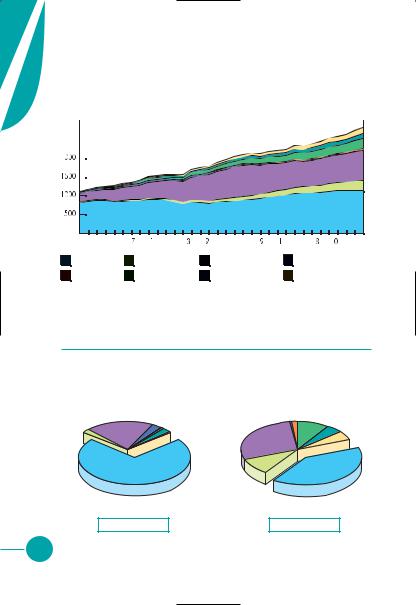
The OECD
from 1971 to 2003 of OECD Total Primary Energy Supply* by Region (Mtoe)
9 |
3 |
9 |
97 |
98 |
983 |
985 |
987 |
989 |
99 |
993 |
95 |
97 |
3 |
|
|
|
OECD North America |
|
|
OECD Pacific |
|
|
OECD Europe |
|
|||||
|
|
|
|
|
|
|
||||||||
|
|
|
|
|
|
|
||||||||
973 and 2003 Regional Shares of TPES*
1973 |
|
2003 |
|
||
Europe |
OECD Europe |
||||
37.3% |
|
34.1% |
|
||
|
|
|
OECD |
||
|
|
|
Pacific |
||
|
|
|
15.8% |
|
|
|
OECD North America |
|
OECD North America |
||
51.8% |
|
50.1% |
|
||
|
|
|
|
|
|
|
3 763 Mtoe |
|
|
5 395 Mtoe |
|
*Excludes electricity trade.
9

S |
|
|
|
U |
Crude Oil Production |
||
P |
|||
P |
|
|
|
|
|
|
|
L |
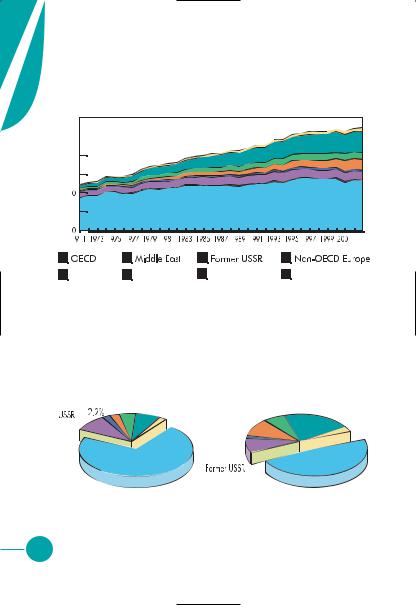
Evolution from 1971 to 2004 of Crude Oil Production by Region |
||
Y |
|||
|
|
(Mt) |
|
|
3000 |
|
|
500 |
|
|
|
|
|
|
|
|
|
|
|
|
|
|
|
|
|
0 |
|
|
|
|
|
|
|
|
|
|
|
|
|
|
|
|
|
97 |
974 |
9 |
7 |
980 |
98 |
86 |
989 |
9 |
2 |
995 |
99 |
2 |
0 |
2004 |
|||
|
OECD |
|
|
Middle East |
|
Former USSR |
|
|
Non-OECD Europe |
||||||||
|
|
|
|
|
|
||||||||||||
|
|
|
|
|
|
||||||||||||
|
China |
|
|
|
Asia* |
|
|
Latin America |
|
|
Africa |
|
|
|
|||
|
|
|
|
|
|
|
|
|
|
|
|||||||
|
|
|
|
|
|
|
|
|
|
|
|||||||
1973 and 2004 Regional Shares of
Crude Oil Production
|
|
|
1973 |
|
|
|
|
|
2004 |
|
|
||
Non- |
|
|
Asia* |
Latin |
|
|
Non- |
|
|
Asia* |
Latin |
|
|
OECD |
China |
3.2% |
America |
Africa |
OECD |
China |
4.8% |
America |
Africa |
||||
Europe |
|
8.6% |
Europe |
|
8.8% |
||||||||
ormer |
1.9% |
|
|
10.0% |
0.2% |
4.5% |
|
|
11.6% |
||||
|
|
|
|
|
|
Former |
|
|
|
|
|
|
|
USSR |
|
|
|
|
|
|
|
|
|
|
|
|
|
|
|
|
|
|
|
USSR |
|
|
|
|
|
|
|
5.0% |
|
|
|
|
|
|
|
|
|
|
|
|
|
|
|
|
|
|
|
14.3% |
|
|
|
|
|
|
|
|
|
|
|
|
|
|
|
|
|
|
|
|
|
|
|
|
|
|
|
OECD |
|
|
|
|
|
|
OECD |
Middle East |
|
|
23.6% |
Middle East |
|
|
25.5% |
||||||
|
|
|
|
|
|
|
|
||||||
37.0% |
|
|
|
|
|
|
30.3% |
|
|
|
|
|
|
|
|
|
|
|
|
|
|
|
|
|
|
||
|
|
|
2 867 Mt |
|
|
|
|
|
3 888 Mt |
|
|
||
10 |
*Asia excludes China. |

Producers, Exporters and Importers |
1 |
of Crude Oil |
|
|
% of |
|
Mt |
World |
|
|
total |
Arabia |
492 |
12.7 |
|
456 |
11.7 |
States |
337 |
8.7 |
Rep. of Iran |
203 |
5.2 |
|
192 |
4.9 |
Rep. of China |
174 |
4.5 |
|
153 |
3.9 |
|
151 |
3.9 |
|
146 |
3.8 |
|
129 |
3.3 |
|
|
|
the World |
1 455 |
37.4 |
|
|
|
|
3 888 |
100.0 |
|
|
|
Exporters |
Mt |
Saudi Arabia |
333 |
Russia |
228 |
Norway |
135 |
Islamic Rep. of Iran |
116 |
Nigeria |
112 |
Mexico |
105 |
Venezuela |
90 |
United Arab Emirates |
88 |
Canada |
83 |
United Kingdom |
75 |
|
|
Rest of the World |
648 |
|
|
World |
2 013 |
|
|
2003 data
Importers |
Mt |
United States |
545 |
Japan |
209 |
Korea |
108 |
Germany |
106 |
Italy |
92 |
People’s Rep. of China |
91 |
India |
90 |
France |
85 |
Spain |
58 |
Netherlands |
57 |
|
|
Rest of the World |
674 |
|
|
World |
2 115 |
|
|
2003 data
11
S |
|
|
|
|
|
U |
|
|
Natural Gas Production |
||
P |
|
|
|||
P |
|
|
|
|
|
|
|
|
|
|
|
L |
Evolution from 1971 to 2004 of Natural Gas Production by Region |
||||
Y |
|||||
|
|
|
|
(Billion Cubic Metres) |
|
|
3000 |
|
|
|
|
|
2500 |
|
|
|
|
|
|
|
|
|
|
|
2 |
|
|
|
|
0 |
|
|
|
|
|
|
|
|
|
|
|
|
|
|
|
|
|
|
1971 |
1974 |
19 |
7 |
980 |
198 |
1 |
86 |
1989 |
19 |
2 |
995 |
199 |
2 |
01 |
2004 |
|||
|
OECD |
|
|
|
Middle East |
|
Former USSR |
|
|
Non-OECD Europe |
||||||||
|
|
|
|
|
|
|
||||||||||||
|
|
|
|
|
|
|
||||||||||||
|
China |
|
|
|
Asia* |
|
|
Latin America |
|
|
Africa |
|
|
|
||||
|
|
|
|
|
|
|
|
|
|
|
||||||||
|
|
|
|
|
|
|
|
|
|
|
||||||||
1973 and 2004 Regional Shares of
Natural Gas Production
|
1973 |
|
|
2004 |
|
|
||
|
Non- |
|
Asia* |
Non- |
|
|
Latin |
|
Former |
OECD |
|
China |
|
|
|||
China |
1.0% |
OECD |
Asia* |
|
||||
Europe |
America |
|||||||
USSR |
2.6% |
0.4% |
Latin America |
Europe |
1.7% |
9.1% |
4.7% |
Africa |
Middle 19.7% |
|
|
2.0% |
0.6% |
|
|
|
|
East |
|
|
|
|
|
|
5.5% |
|
|
|
Africa |
|
|
|
|
||
2.1% |
|
|
Former |
|
|
|
|
|
|
|
|
0.8% |
|
|
|
|
|
|
|
|
|
USSR |
|
|
|
|
|
|
|
|
28.1% |
|
|
|
|
|
|
|
OECD |
Middle |
|
|
|
OECD |
|
|
|
East |
|
|
|
||
|
|
|
71.4% |
|
|
|
40.3% |
|
|
|
|
10.0% |
|
|
|
||
|
|
|
|
|
|
|
|
|
|
1 226 Bcm |
|
|
2 794 Bcm |
|
|||
12 |
*Asia excludes China. |

Producers, Exporters and Importers* |
1 |
of Natural Gas |
|
Mm3 |
% of |
|
|
|
|
|
|
|
World |
|
|
|
|
|
|
|
|
|
total |
|
|
|
|
|
|
|
620 095 |
22.2 |
|
|
|
|
|
|
|
Exporters |
Mm3 |
|
|
|
|||
States |
531 951 |
19.0 |
|
|
|
|
||
|
Russia |
194 832 |
|
|
|
|||
|
182 564 |
6.5 |
|
|
|
|
||
|
|
|
|
|
|
|
||
Kingdom |
101 182 |
3.6 |
|
Canada |
103 083 |
|
Importers |
Mm3 |
|
Norway |
75 858 |
|
|||||
|
88 337 |
3.2 |
|
|
United States |
120 587 |
||
|
|
|
|
|
||||
|
|
|
|
Algeria |
64 544 |
|
||
|
85 983 |
3.1 |
|
|
Germany |
90 109 |
||
|
|
|
|
|
||||
|
|
|
|
Netherlands |
53 560 |
|
||
|
82 340 |
2.9 |
|
|
Japan |
81 225 |
||
|
|
|
|
|
||||
|
|
|
|
Turkmenistan |
44 090 |
|
||
. of Iran |
81 332 |
2.9 |
|
|
Italy |
67 908 |
||
|
|
|
|
|||||
|
|
|
|
Indonesia |
38 593 |
|
||
|
79 498 |
2.8 |
|
|
Ukraine |
54 428 |
||
|
|
|
|
|
||||
|
|
|
|
Malaysia |
25 460 |
|
||
Arabia |
63 999 |
2.3 |
|
|
France |
43 978 |
||
|
|
|
|
|||||
|
|
|
|
Qatar |
24 420 |
|
||
the World |
877 235 |
31.5 |
|
|
Korea |
28 929 |
||
|
United States |
24 188 |
|
|||||
|
|
|
|
|
Spain |
26 951 |
||
|
2 794 516 |
100.0 |
|
|
||||
|
|
|
|
|
||||
|
Rest of the World |
139 542 |
|
|||||
|
|
|
|
|
Turkey |
21 732 |
||
|
|
|
|
|
||||
|
|
|
|
|
|
|
||
|
|
|
|
World** |
788 170 |
|
Belarus |
19 643 |
|
|
|
|
|
|
|
|
|
|
|
|
|
2004 data |
|
|
Rest of the World |
238 879 |
|
|
|
|
|
|
|
|
|
|
|
|
|
|
|
|
World** |
794 369 |
and imports include pipeline gas and LNG. |
|
|
||||||
2004 data |
|
|||||||
trade includes intra trade of Former USSR. |
|
|||||||
13

S |
|
|
|
|
|
U |
|
|
Hard Coal Production |
||
P |
|
|
|||
P |
|
|
|
|
|
|
|
|
|
|
|
L |
Evolution from 1971 to 2004 of Hard Coal Production by Region |
||||
Y |
|||||
|
|
|
|
(Mt) |
|
|
5000 |
|
|
|
|
|
4500 |
|
|
|
|
|
|
|
|
|
|
500 |
|
|
|
|
|
|
|
|
|
|
|
|
|
|
|
|
0 |
|
|
|
|
|
|
|
|
|
|
|
|
|
|
|
|
1971 |
1974 |
19 7 |
980 |
198 |
1 |
86 |
1989 |
19 2 |
995 |
199 |
2 01 |
2004 |
||||
|
OECD |
|
|
Middle East |
|
Former USSR |
|
|
|
Non-OECD Europe |
||||||
|
|
|
|
|
|
|
||||||||||
|
|
|
|
|
|
|
||||||||||
|
China |
|
|
Asia* |
|
|
Latin America |
|
|
|
Africa |
|
|
|||
|
|
|
|
|
|
|
|
|
|
|||||||
|
|
|
|
|
|
|
|
|
|
|||||||
1973 and 2004 Regional Shares of
Hard Coal Production
|
1973 |
|
|
2004 |
||
Non- |
China |
Asia* |
|
|
Asia* |
|
OECD |
Latin America |
|
Latin America |
|||
Europe |
18.6% |
4.8% |
0.3% |
China |
11.9% |
1.5% |
0.4% |
|
|
Africa |
42.3% |
|
Africa |
Former |
|
|
|
|
5.3% |
|
|
|
3.0% |
|
|
||
USSR |
|
|
|
|
|
|
|
|
|
|
|
|
|
.8% |
|
|
|
|
|
|
|
|
|
|
Non- |
|
|
|
|
|
OECD |
OECD |
Former |
OECD |
|
|
|
50.1% |
Europe |
USSR |
31.3% |
|
|
|
|
0.1% |
7.7% |
|
|
|
|
|
|
|
|
|
2 237 Mt |
|
|
4 629 Mt |
||
14 |
*Asia excludes China. |

Producers, Exporters and Importers |
1 |
of Coal |
|
Hard |
Brown |
|
Coal |
Coal |
|
(Mt) |
(Mt) |
Rep. of China |
1 956 |
* |
States |
933 |
76 |
|
373 |
29 |
|
285 |
69 |
Africa |
238 |
0 |
|
210 |
70 |
|
129 |
0 |
|
100 |
61 |
|
83 |
4 |
|
62 |
0 |
|
|
|
the World |
260 |
570 |
|
|
|
|
4 629 |
879 |
|
|
|
|
Hard |
Exporters |
Coal |
|
(Mt) |
Australia |
218 |
Indonesia |
107 |
People’s Rep. of China |
87 |
South Africa |
66 |
Russia |
65 |
Colombia |
52 |
United States |
43 |
Canada |
27 |
Kazakhstan |
22 |
Poland |
20 |
|
|
Rest of the World |
48 |
|
|
World |
755 |
|
|
2004 data |
|
*Included in hard coal.
|
Hard |
Importers |
Coal |
|
(Mt) |
Japan |
183 |
Korea |
79 |
Chinese Taipei |
60 |
Germany |
39 |
United Kingdom |
36 |
India |
31 |
Italy |
25 |
United States |
25 |
Spain |
24 |
Netherlands |
23 |
|
|
Rest of the World |
229 |
|
|
World |
754 |
|
|
2004 data |
|
15

S |
|
|
|
|
|
|
|
|
|
|
|
|
|
|
|
|
|
|
|
|
|
|
|
|
U |
|
|
|
|
|
Nuclear Production |
|
|
|
|
||||||||||||||
P |
|
|
|
|
|
|
|
|
|
|||||||||||||||
P |
|
|
|
|
|
|
|
|
|
|
|
|
|
|
|
|
|
|
|
|
|
|
|
|
|
|
|
|
|
|
|
|
|
|
|
|
|
|
|
|
|
|
|
|
|
|
|
|
|
L |
|
Evolution from 1971 to 2003 of Nuclear Production by Region |
||||||||||||||||||||||
Y |
|
|||||||||||||||||||||||
|
|
|
|
|
|
|
|
|
|
|
|
(TWh) |
|
|
|
|
|
|
|
|
|
|
|
|
|
3000 |
|
|
|
|
|
|
|
|
|
|
|
|
|
|
|
|
|
|
|
|
|
|
|
|
2500 |
|
|
|
|
|
|
|
|
|
|
|
|
|
|
|
|
|
|
|
|
|
|
|
|
2000 |
|
|
|
|
|
|
|
|
|
|
|
|
|
|
|
|
|
|
|
|
|
|
|
|
500 |
|
|
|
|
|
|
|
|
|
|
|
|
|
|
|
|
|
|
|
|
|
|
|
|
000 |
|
|
|
|
|
|
|
|
|
|
|
|
|
|
|
|
|
|
|
|
|
|
|
|
500 |
|
|
|
|
|
|
|
|
|
|
|
|
|
|
|
|
|
|
|
|
|
|
|
|
0 |
|
|
|
|
|
|
|
|
|
|
|
|
|
|
|
|
|
|
|
|
|
|
|
|
97 |
973 |
975 |
977 |
979 |
98 |
983 |
985 |
987 |
989 |
99 |
993 |
995 |
997 |
999 |
200 |
2003 |
|||||||
|
|
OECD |
|
|
Former USSR |
|
|
Non-OECD Europe |
|
Asia* |
|
|
Other** |
|||||||||||
|
|
|
|
|
|
|
|
|
||||||||||||||||
|
|
|
|
|
|
|
|
|
||||||||||||||||
1973 and 2003 Regional Shares of
Nuclear Production
|
1973 |
|
|
|
2003 |
|
|
|
Non- |
Asia* |
|
|
|
|
Asia* |
OECD |
Other** |
|||
|
Europe |
2.2% |
2.9% |
|
||
Former |
1.3% |
|
||||
1.0% |
|
|
|
|
||
|
|
|
|
|
||
USSR |
|
Former |
|
|
|
|
5.9% |
|
|
|
|
|
|
|
USSR |
|
|
|
|
|
|
|
9.5% |
|
|
|
|
|
|
OECD |
|
|
|
OECD |
|
|
92.8% |
|
|
84.4% |
|
|
|
|
|
|
|
|
|
203 TWh |
|
|
2 635 TWh |
|
|
|
*Asia excludes China. |
16 |
** Other includes Africa, Latin America & China. |

Producers of Nuclear Electricity
1
|
|
% of |
|
TWh |
World |
|
|
total |
States |
788 |
29.9 |
|
441 |
16.7 |
|
240 |
9.1 |
|
165 |
6.3 |
|
150 |
5.7 |
|
130 |
4.9 |
Kingdom |
89 |
3.4 |
|
81 |
3.1 |
|
75 |
2.8 |
|
67 |
2.5 |
|
|
|
the World |
409 |
15.6 |
|
|
|
|
2 635 |
100.0 |
|
|
|
Installed |
GW |
|
|
% of |
|
Capacity |
|
Country |
nuclear |
||
|
|
||||
United States |
98 |
|
(based on first |
in total |
|
|
domestic |
||||
|
|
|
10 producers) |
||
France |
63 |
|
electricity |
||
|
|
||||
Japan |
44 |
|
|
generation |
|
|
France |
78 |
|||
Germany |
21 |
|
|||
Russia |
21 |
|
Sweden |
50 |
|
|
|
|
|||
Korea |
16 |
|
Ukraine |
45 |
|
|
|
|
|||
United Kingdom |
12 |
|
Korea |
37 |
|
|
|
|
|||
Ukraine |
11 |
|
Germany |
28 |
|
|
|
|
|||
Canada |
11 |
|
Japan |
23 |
|
|
|
|
|||
Sweden |
9 |
|
United Kingdom |
22 |
|
|
United States |
19 |
|||
|
|
|
|||
Rest of the World |
55 |
||||
|
Russia |
16 |
|||
|
|
|
|||
World |
361 |
|
Canada |
13 |
|
2003 data |
|
|
|
|
|
|
|
Rest of the World* |
9 |
||
Source: Commissariat à |
|
|
|
||
|
World |
16 |
|||
l’Énergie Atomique (France). |
|
||||
|
|
|
|
|
|
*Excludes countries with no nuclear production. |
2003 data |
17
S |
|
|
|
|
|
|
|
|
|
|
|
|
|
|
|
|
|
|
|
|
|
U |
|
|
|
|
|
|
|
Hydro Production |
|
|
|||||||||||
P |
|
|
|
|
|
|
|
|
|
||||||||||||
P |
|
|
|
|
|
|
|
|
|
|
|
|
|
|
|
|
|
|
|
|
|
|
|
|
|
|
|
|
|
|
|
|
|
|
|
|
|
|
|
|
|
|
|
L |
|
|
Evolution from 1971 to 2003 of Hydro Production by Region |
||||||||||||||||||
Y |
|
|
|||||||||||||||||||
|
|
|
|
|
|
|
|
|
|
|
|
|
(TWh) |
|
|
|
|
|
|
||
|
3000 |
|
|
|
|
|
|
|
|
|
|
|
|
|
|
|
|
|
|
||
|
2500 |
|
|
|
|
|
|
|
|
|
|
|
|
|
|
|
|
|
|
||
|
|
|
|
|
|
|
|
|
|
|
|
|
|
|
|
|
|
|
|||
|
2000 |
|
|
|
|
|
|
|
|
|
|
|
|
|
|
|
|
|
|
||
|
1500 |
|
|
|
|
|
|
|
|
|
|
|
|
|
|
|
|
|
|
||
|
100 |
|
|
|
|
|
|
|
|
|
|
|
|
|
|
|
|
|
|
||
|
500 |
|
|
|
|
|
|
|
|
|
|
|
|
|
|
|
|
|
|
||
|
1 |
|
|
|
|
|
|
|
|
|
|
|
|
|
|
|
|
2003 |
|
||
|
|
|
|
|
|
|
|
|
|
|
|
|
|
|
|
|
|
||||
|
|
|
|
|
|
|
|
|
|
|
|
|
|
|
|
|
|
|
|
|
|
|
|
|
China |
|
|
Asia* |
|
|
Latin America |
|
|
Africa |
|
|
|||||||
|
|
|
|
|
|
|
|
|
|
|
|||||||||||
|
|
|
|
|
|
|
|
|
|
|
|||||||||||
|
|
|
|
|
1973 and 2003 Regional Shares of |
|
|
||||||||||||||
|
|
|
|
|
|
|
|
|
|
Hydro Production |
|
|
|||||||||
|
|
|
|
|
|
|
1973 |
|
|
|
|
|
|
2003 |
|
|
|||||
|
|
|
|
|
Non- |
China Asia* |
|
|
|
|
|
|
|
|
|
|
|
|
|||
|
|
|
|
|
OECD |
Latin America |
|
Asia* |
|
|
Latin America |
|
|
||||||||
|
Former Europe |
2.9% 4.3% |
7.2% |
|
|
20.8% |
|
|
|||||||||||||
|
|
|
China 6.7% |
Africa |
|||||||||||||||||
|
|
|
|
|
|
|
|
|
|
|
Africa |
|
|
|
|
|
|||||
|
|
|
|
|
|
|
|
|
|
|
10.4% |
|
|
|
|
|
3.2% |
|
|||
|
9.4% |
|
|
|
|
|
|
2.2% |
|
|
|
|
|
|
|
||||||
|
|
|
|
|
|
|
|
|
Non-OECD |
|
|
|
|
|
|
||||||
|
Middle |
|
|
|
|
|
|
|
|
|
|
|
|
|
|||||||
|
|
|
|
|
|
|
|
Europe |
|
|
|
|
|
|
|||||||
|
|
East |
|
|
|
|
|
|
|
|
|
|
|
|
|
||||||
|
|
|
|
|
|
|
|
1.7% |
|
|
|
|
|
|
|
||||||
|
0.3% |
|
|
|
|
|
|
|
|
|
|
|
|
|
|
|
|
||||
|
|
|
|
|
|
|
|
|
|
|
|
|
|
|
|
|
|
|
|||
|
|
|
|
|
|
|
|
|
|
|
OECD |
8.3% |
|
|
|
|
|
OECD |
|||
|
|
|
|
|
|
|
|
|
|
|
|
Middle East |
|
|
|
|
|||||
|
|
|
|
|
|
|
|
|
|
71.5% |
0.6% |
|
|
|
|
|
48.3% |
||||
|
|
|
|
|
|
|
|
|
|
|
|
|
|
||||||||
|
|
|
|
|
|
1 295 TWh |
|
|
|
|
|
2 726 TWh |
|
|
|||||||
18 |
*Asia excludes China. |