

B Y F U E L
The OECD
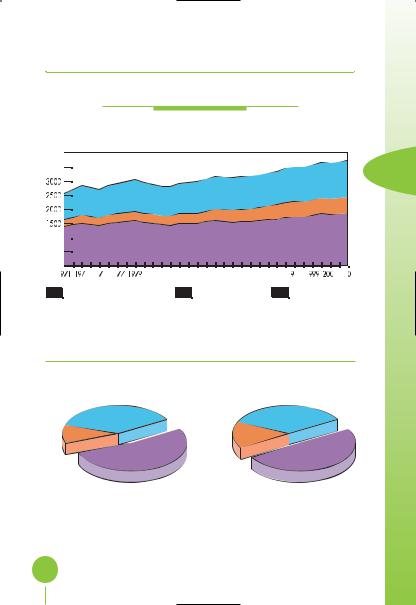
Evolution from 1971 to 2003 of OECD Total Final Consumption by Fuel (Mtoe)
4000 |
|
3500 |
3 |
|
000 |
|
|
|
|
|
|
|
|
|
|
|
|
|
|
|
|
|
500 |
|
|
|
|
|
|
|
|
|
|
|
|
|
|
|
|
|
0 |
|
|
5 |
|
|
|
985 |
987 |
|
|
|
|
|
995 |
97 |
|
|
3 |
9 |
9 |
98 |
983 |
989 |
99 |
993 |
3 |
|||||||||
|
Coal |
|
|
|
|
|
|
|
|
|
|
Oil |
|
|
|
|
Gas |
|
|
|
|
|
|
|
|
|
|
|
|
|
|
||||
|
|
|
|
|
|
|
|
|
|
|
|
|
|
||||
|
Combustible Renewables & Waste |
|
|
|
|
Electricity |
|
|
Other* |
||||||||
|
|
|
|
|
|
|
|||||||||||
|
|
|
|
|
|
|
|||||||||||
1973 and 2003 Fuel Shares of
Total Final Consumption
|
|
1973 |
|
|
|
|
2003 |
|
|
|
Combustible |
Electricity |
Other* |
Electricity |
Other* |
Coal |
|||||
Renewables |
11.4% |
0.7% Coal |
Combustible 19.4% |
1.4% |
3.4% |
|
||||
& Waste |
|
10.1% |
Renewables |
|
|
|
|
|||
2.9% |
|
|
|
& Waste |
|
|
|
|
||
|
|
|
|
|
3.2% |
|
|
|
|
|
|
Gas |
|
|
|
Gas |
|
|
|
|
|
18.2% |
|
|
|
|
|
|
|
|||
|
|
|
|
Oil |
19.9% |
|
|
|
Oil |
|
|
|
|
56.7% |
|
|
|
52.7% |
|||
|
|
|
|
|
|
|
|
|||
|
|
|
|
|
|
|
|
|
|
|
|
|
2 839 Mtoe |
|
|
3 754 Mtoe |
|
|
|||
*Other includes geothermal, solar, wind, heat, etc.
29

C |
|
|
|
|
|
|
|
|
|
|
|
|
|
|
|
|
|
|
|
|
|
|
O |
T O T A L F I N A L C O N S U M P T I O N |
|||||||||||||||||||||
N |
||||||||||||||||||||||
S |
||||||||||||||||||||||
U |
|
|
|
|
|
|
|
|
|
|
The World |
|
|
|
|
|
|
|||||
M |
|
|
|
|
|
|
|
|
|
|
|
|
|
|
|
|
||||||
P |
|
|
|
|
|
|
|
|
|
|
|
|
|
|
|
|
|
|
|
|
|
|
T |
|
Evolution from 1971 to 2003 of World Total Final Consumption* |
||||||||||||||||||||
I |
|
|||||||||||||||||||||
|
|
|
|
|
|
|
|
|
|
by Region (Mtoe) |
|
|
|
|
|
|
|
|
|
|||
O |
|
|
|
|
|
|
|
|
|
|
|
|
|
|
|
|
|
|
|
|||
8000 |
|
|
|
|
|
|
|
|
|
|
|
|
|
|
|
|
|
|
||||
N |
|
|
|
|
|
|
|
|
|
|
|
|
|
|
|
|
|
|
||||
7000 |
|
|
|
|
|
|
|
|
|
|
|
|
|
|
|
|
|
|
||||
|
|
|
|
|
|
|
|
|
|
|
|
|
|
|
|
|
|
|
||||
|
4000 |
|
|
|
|
|
|
|
|
|
|
|
|
|
|
|
|
|
|
|||
|
0 |
|
|
|
|
|
|
|
|
|
|
|
|
|
|
|
2003 |
|||||
|
|
|
|
|
|
|
|
|
|
|
|
|
|
|
|
|
|
|
|
|||
|
|
|
|
|
|
|
|
|
|
|
|
|
|
|
|
|
|
|
||||
|
|
|
|
|
|
|
|
|
|
|
|
|
|
|
|
|
|
|
|
|
|
|
|
|
|
|
China |
|
|
|
Asia** |
|
Latin America |
|
|
Africa |
|||||||||
|
|
|
|
|
|
|
|
|
|
|||||||||||||
|
|
|
|
|
|
|
|
|
|
|||||||||||||
|
|
|
|
|
1973 and 2003 Regional Shares of |
|||||||||||||||||
|
|
|
|
|
|
|
|
Total Final Consumption* |
|
|
|
|||||||||||
|
|
|
|
|
|
|
|
|
|
|
|
|
|
|
|
|
||||||
|
|
|
|
|
|
|
1973 |
|
|
|
|
|
|
2003 |
|
|
||||||
|
|
|
|
|
Non- |
|
|
|
|
Latin |
|
|
|
|
|
|
|
Latin |
||||
|
|
|
|
|
OECD |
|
|
|
|
|
|
|
|
|
|
|
||||||
|
Former |
Europe |
8.0% |
7.1% America |
Non- |
China |
12.1% |
America |
||||||||||||||
|
|
|
|
|
|
OECD |
12.3% |
5.0% Africa |
||||||||||||||
|
|
USSR |
|
|
|
|
|
|
Africa |
|
|
|
||||||||||
|
|
|
|
|
|
|
|
Europe |
|
|
|
|
|
|
5.7% |
|
||||||
|
12.8% |
|
|
|
|
|
|
|
|
|
|
|
|
|
||||||||
|
|
|
|
|
|
4.2% |
0.9% |
|
|
|
|
|
|
|
|
|
||||||
|
Middle |
|
|
|
|
|
|
|
|
Former |
|
|
|
|
|
|
|
|
|
|||
|
|
|
|
|
|
|
|
|
USSR |
|
|
|
|
|
|
|
|
|
||||
|
East |
|
|
|
|
|
|
|
|
|
|
|
|
|
|
|
|
|
||||
|
|
|
|
|
|
|
|
|
8.5% |
|
|
|
|
|
|
|
|
|
||||
|
0.9% |
|
|
|
|
|
|
|
|
|
|
|
|
|
|
|
|
|
|
|||
|
|
|
|
|
|
|
|
|
|
Middle |
|
|
|
|
|
|
|
|
|
|||
|
|
|
|
|
|
|
|
|
|
|
OECD |
|
|
|
|
|
|
|
|
|
||
|
|
|
|
|
|
|
|
|
|
|
East |
|
|
|
|
|
|
|
OECD |
|||
|
|
|
|
|
|
|
|
|
|
61.7% |
4.0% |
|
|
|
|
|
|
51.5% |
||||
|
|
|
|
|
|
4 606 Mtoe |
|
|
|
|
|
7 287 Mtoe |
|
|||||||||
* Prior to 1994 combustible renewables & waste final consumption has been estimated.
**Asia excludes China.
30
B Y R E G I O N
The OECD
Evolution from 1971 to 2003 of OECD Total Final Consumption by Region (Mtoe)
4000 |
|
3500 |
3 |
|
000 |
|
|
|
|
|
|
|
|
|
|
|
|
|
|
500 |
|
|
|
|
|
|
|
|
|
|
|
|
|
|
0 |
|
5 |
|
|
|
985 |
987 |
|
|
|
995 |
97 |
|
|
3 |
9 |
9 |
98 |
983 |
989 |
99 |
993 |
20 |
3 |
|||||
OECD North America |
|
|
OECD Pacific |
|
|
OECD Europe |
|
|||||||
1973 and 2003 Regional Shares of
Total Final Consumption
|
1973 |
|
2003 |
|
|
||
|
OECD Europe |
OECD Europe |
|
||||
36.8% |
|
|
34.9% |
|
|
|
|
OECD |
OECD |
|
|||||
Pacific |
Pacific |
|
|||||
10.5% |
OECD North America |
15.4% |
OECD North America |
|
|||
|
|
|
|
||||
52.7% |
|
49.7% |
|
|
|||
|
|
|
|
|
|
|
|
|
|
|
|
|
|
|
|
|
|
2 839 Mtoe |
|
|
3 754 Mtoe |
|
|
31

C |
|
|
|
|
|
|
|
|
|
|
|
|
|
|
|
|
|
|
|
|
|
|
|
|
|
|
|
|
|
|
|
|
|
|
|
O |
T O T A L F I N A L C O N S U M P T I O N |
||||||||||||||||||||||||||||||||||
N |
|||||||||||||||||||||||||||||||||||
S |
|||||||||||||||||||||||||||||||||||
U |
|
|
|
|
|
|
|
|
|
|
|
|
|
|
|
|
Coal |
|
|
|
|
|
|
|
|
|
|
|
|
|
|
|
|||
M |
|
|
|
|
|
|
|
|
|
|
|
|
|
|
|
|
|
|
|
|
|
|
|
|
|
|
|
|
|
|
|
||||
P |
|
|
|
|
|
|
|
|
|
|
|
|
|
|
|
|
|
|
|
|
|
|
|
|
|
|
|
|
|
|
|
|
|
|
|
T |
|
|
|
Evolution from 1971 to 2003 of Total Final Consumption |
|
|
|||||||||||||||||||||||||||||
I |
|
|
|
|
|
||||||||||||||||||||||||||||||
|
|
|
|
|
|
|
|
|
|
|
|
|
|
by Sector (Mtoe) |
|
|
|
|
|
|
|
|
|
|
|
||||||||||
O |
|
|
|
|
|
|
|
|
|
|
|
|
|
|
|
|
|
|
|
|
|
|
|
|
|
||||||||||
900 |
|
|
|
|
|
|
|
|
|
|
|
|
|
|
|
|
|
|
|
|
|
|
|
|
|
|
|
|
|
|
|
||||
N |
|
|
|
|
|
|
|
|
|
|
|
|
|
|
|
|
|
|
|
|
|
|
|
|
|
|
|
|
|
|
|
||||
800 |
|
|
|
|
|
|
|
|
|
|
|
|
|
|
|
|
|
|
|
|
|
|
|
|
|
|
|
|
|
|
|
||||
|
|
|
|
|
|
|
|
|
|
|
|
|
|
|
|
|
|
|
|
|
|
|
|
|
|
|
|
|
|
|
|
||||
|
600 |
|
|
|
|
|
|
|
|
|
|
|
|
|
|
|
|
|
|
|
|
|
|
|
|
|
|
|
|
|
|
|
|||
|
500 |
|
|
|
|
|
|
|
|
|
|
|
|
|
|
|
|
|
|
|
|
|
|
|
|
|
|
|
|
|
|
|
|||
|
300 |
|
|
|
|
|
|
|
|
|
|
|
|
|
|
|
|
|
|
|
|
|
|
|
|
|
|
|
|
|
|
|
|||
|
200 |
|
|
|
|
|
|
|
|
|
|
|
|
|
|
|
|
|
|
|
|
|
|
|
|
|
|
|
|
|
|
|
|||
|
00 |
|
|
|
|
|
|
|
|
|
|
|
|
|
|
|
|
|
|
|
|
|
|
|
|
|
|
|
|
|
|
|
|||
|
0 |
|
|
|
|
|
|
|
|
|
|
|
|
|
|
|
|
|
|
|
|
|
|
|
|
|
|
|
|
|
|
|
|||
|
7 |
73 |
75 |
77 |
9 |
9 |
9 |
9 |
3 |
9 |
5 |
9 |
7 |
9 |
9 |
99 |
|
993 |
99 |
|
99 |
99 |
200 |
2003 |
|||||||||||
|
|
|
|
Industry |
|
|
|
|
|
Transport |
|
|
|
Other sectors* |
|
|
|
|
Non-energy use |
||||||||||||||||
|
|
|
|
|
|
|
|
|
|
|
|
|
|
|
|
||||||||||||||||||||
|
|
|
|
|
|
|
|
|
|
|
|
|
|
|
|
||||||||||||||||||||
|
|
|
|
|
|
|
|
1973 and 2003 Shares of |
|
|
|
|
|
|
|
||||||||||||||||||||
|
|
|
|
|
|
|
|
World Coal Consumption |
|
|
|
|
|
|
|
||||||||||||||||||||
|
|
|
|
|
|
|
|
|
|
|
|
|
|
|
|
|
|
|
|
|
|
|
|
|
|
|
|||||||||
|
|
|
|
|
|
1973 |
|
|
|
|
|
|
|
|
|
|
|
|
|
|
2003 |
|
|
|
|
|
|||||||||
|
|
|
Other sectors* |
|
|
|
|
|
Non-energy |
|
|
|
|
|
|
Transport |
|
Other sectors* |
|
|
|
|
|||||||||||||
|
36.3% |
|
|
|
|
|
|
|
|
use |
|
|
|
|
|
|
|
|
20.5% |
|
|
|
|
|
|||||||||||
|
|
|
|
|
|
|
|
|
|
|
|
|
|
|
|
|
1.0% |
|
|
|
Non-energy |
||||||||||||||
|
|
|
|
|
|
|
|
|
|
|
|
|
0.8% |
|
|
|
|
|
|
|
|
|
|
|
|
|
|
|
|
||||||
|
|
|
|
|
|
|
|
|
|
|
|
|
|
|
|
|
|
|
|
|
|
|
|
|
|
|
|
|
|
|
use |
||||
|
|
|
|
|
|
|
|
|
|
|
|
|
|
|
|
|
|
|
|
|
|
|
|
|
|
|
|
|
|
|
|
|
|||
|
|
|
|
|
|
|
|
|
|
|
|
|
|
|
|
|
|
|
|
|
|
|
|
|
|
|
|
|
|
|
|
2.4% |
|
||
|
Transport |
|
|
|
|
|
|
|
|
|
|
|
|
|
|
|
|
Industry |
|
|
|
|
|
|
|
|
|
|
|
||||||
|
5.3% |
|
|
|
|
Industry |
|
|
|
|
|
|
|
|
|
|
|
|
|
|
|
|
|
|
|
||||||||||
|
|
|
|
|
|
|
|
57.6% |
|
|
|
|
|
|
|
|
76.1% |
|
|
|
|
|
|
|
|
|
|
|
|
||||||
|
|
|
|
|
|
|
|
|
|
|
|
|
|
|
|
|
|
|
|
|
|
|
|
|
|
|
|
|
|
|
|||||
|
|
|
|
|
|
|
|
|
|
|
|
|
|
|
|
|
|
|
|
|
|
|
|
|
|||||||||||
|
|
|
|
|
620 Mtoe |
|
|
|
|
|
|
|
|
|
|
|
|
|
538 Mtoe |
|
|
|
|
|
|||||||||||
*Other sectors comprises agriculture, commercial & public service, residential
and non-specified.
32

B Y S E C T O R
Oil
Evolution from 1971 to 2003 of Total Final Consumption by Sector (Mtoe)
3500
3000 
 3
3
2500 
0 |
|
|
|
|
|
|
|
|
|
|
|
|
|
|
|
|
|
|
|
|
|
|
|
|
97 |
73 |
75 |
77 |
79 |
8 |
83 |
985 |
987 |
9 |
9 |
9 |
9 |
3 |
9 |
5 |
9 |
7 |
999 |
200 |
2003 |
||||
|
Industry |
|
|
Transport |
|
|
|
|
Other sectors* |
|
|
|
|
Non-energy use |
||||||||||
|
|
|
|
|
|
|
|
|
|
|
||||||||||||||
|
|
|
|
|
|
|
|
|
|
|
||||||||||||||
1973 and 2003 Shares of
World Oil Consumption
1973 |
|
2003 |
|
|
Other sectors* |
Non-energy |
Other sectors* |
Non-energy |
|
use |
use |
|||
24.6% |
15.7% |
|||
6.4% |
6.6% |
|||
|
|
|
Industry |
|
Industry |
|
|
26.7% |
|
||
Transport |
Transport |
19.9% |
||
|
||||
|
|
|||
42.3% |
|
57.8% |
|
|
2 141 Mtoe |
|
|
3 108 Mtoe |
*Other sectors comprises agriculture, commercial & public service, residential and non-specified.
33

C |
|
|
|
|
|
O |
T O T A L F I N A L C O N S U M P T I O N |
||||
N |
|||||
S |
|||||
U |
|
Gas |
|||
M |
|
||||
P |
|
|
|
|
|
T |
Evolution from 1971 to 2003 of Total Final Consumption |
||||
I |
|||||
O |
1200 |
by Sector (Mtoe) |
|||
N |
|
|
|
|
|
|
|
|
|
|
|
0 |
|
|
|
|
|
|
|
|
|
|
|
|
|
|
|
5 |
9 |
98 |
983 |
985 |
987 |
989 |
99 |
993 |
995 |
97 |
20 |
3 |
|||
|
|
Industry |
|
|
|
Transport |
|
|
|
Other sectors* |
|
|
|||
|
|
|
|
|
|
|
|
|
|
||||||
|
|
|
|
|
|
|
|
|
|
||||||
1973 and 2003 Shares of
World Gas Consumption
1973 |
2003 |
Other sectors* |
Other sectors* |
40.7% |
49.5% |
Transport
2.6%
|
Transport |
|
Industry |
5.2% |
Industry |
56.7% |
|
45.3% |
671 Mtoe |
|
1 192 Mtoe |
*Other sectors comprises agriculture, commercial & public service, residential
and non-specified.
34

B Y S E C T O R
Electricity
Evolution from 1971 to 2003 of Total Final Consumption
by Sector (Mtoe)
1200
3
0 |
985 |
987 |
989 |
3 |
|
||||
Industry |
Transport |
|
Other sectors* |
|
1973 and 2003 Shares of
World Electricity Consumption
1973 |
2003 |
Other sectors* |
Other sectors* |
46.3% |
56.0% |
Transport |
Transport |
|
2.4% |
|
|
Industry |
1.8% |
Industry |
51.3% |
|
42.2% |
439 Mtoe |
|
1 175 Mtoe |
*Other sectors comprises agriculture, commercial & public service, residential and non-specified.
35

E |
|
|
|
|
|
|
|
|
|
|
|
|
N |
|
|
|
|
SIMPLIFIED ENERGY |
|||||||
E |
|
|
|
|
||||||||
R |
|
|
|
|
||||||||
G |
|
|
|
|
|
|
|
|
|
|
|
|
Y |
|
|
|
|
The World |
|
|
|
|
|||
B |
|
|
|
|
|
1973 |
|
|
|
|
|
|
A |
|
|
|
|
|
|
|
|
|
|
(Mtoe) |
|
|
|
|
|
|
|
|
|
|
|
|
||
L |
|
|
|
|
|
|
|
|
|
|
|
|
|
|
|
|
|
|
|
|
|
|
|
|
|
|
SUPPLY AND |
Coal |
Crude |
Petroleum |
Gas |
Nuclear |
Hydro |
|
Other** |
Total |
||
A |
|
Combustible |
||||||||||
|
CONSUMPTION |
|
Oil |
Products |
|
|
|
|
Renewables |
|
|
|
N |
|
|
|
|
|
|
|
|
||||
|
|
|
|
|
|
|
|
|
& Waste* |
|
|
|
C |
|
|
|
|
|
|
|
|
|
|
|
|
|
Indigenous Prod. |
1476.05 |
2935.79 |
– |
993.51 |
53.05 |
|
110.23 |
673.23 |
6.13 |
6247.98 |
|
E |
|
|
||||||||||
|
Imports |
140.01 |
1577.05 |
409.81 |
73.41 |
– |
– |
0.12 |
8.14 |
2208.54 |
||
S |
|
|||||||||||
|
Exports |
–130.35 |
–1611.05 |
–440.77 |
–72.80 |
– |
– |
–0.19 |
–8.27 |
–2263.43 |
||
|
|
|||||||||||
|
|
Stock Changes |
12.22 |
–21.82 |
–16.08 |
–15.00 |
– |
– |
–0.23 |
– |
–40.91 |
|
|
|
|
|
|
|
|
|
|
|
|
|
|
|
|
TPES |
1497.93 |
2879.97 |
–47.03 |
979.11 |
53.05 |
|
110.23 |
672.92 |
6.00 |
6152.17 |
|
|
|
|
|
|
|
|
|
|
|
|
|
|
|
Intl. Marine Bunkers |
– |
– |
–118.77 |
– |
– |
– |
– |
– |
–118.77 |
|
|
|
Transfers |
– |
–43.47 |
48.43 |
– |
– |
– |
– |
– |
4.96 |
|
|
|
Statistical Diff. |
12.59 |
11.98 |
–7.13 |
4.79 |
– |
– |
– |
–0.11 |
22.11 |
|
|
|
Electricity Plants |
–557.42 |
–22.65 |
–317.87 |
–160.04 |
–52.95 |
–110.23 |
–2.73 |
502.23 |
–721.67 |
|
|
|
CHP Plants |
–87.77 |
– |
–28.39 |
–50.85 |
–0.10 |
– |
–0.75 |
100.70 |
–67.16 |
|
|
|
Heat Plants |
–9.22 |
– |
–0.91 |
–0.69 |
– |
– |
–0.80 |
7.11 |
–4.50 |
|
|
|
Gas Works |
–9.87 |
–0.60 |
–9.27 |
13.52 |
– |
– |
– |
– |
–6.21 |
|
|
|
Pet. Refineries |
– |
–2800.47 |
2772.64 |
– |
– |
– |
– |
– |
–27.83 |
|
|
|
Coal Transf. |
–182.88 |
1.48 |
–3.38 |
–0.19 |
– |
– |
–0.08 |
– |
–185.05 |
|
|
|
Liquefaction Plants |
–1.60 |
0.21 |
– |
– |
– |
– |
– |
– |
–1.39 |
|
|
|
Other Transf. |
– |
3.95 |
–5.47 |
–0.03 |
– |
– |
–11.04 |
– |
–12.59 |
|
|
|
Own Use |
–34.10 |
–2.62 |
–161.80 |
–106.70 |
– |
– |
–0.07 |
–57.75 |
–363.05 |
|
|
|
Distribution Losses |
–7.41 |
–7.07 |
–0.27 |
–7.51 |
– |
– |
– |
–42.56 |
–64.83 |
|
|
|
|
|
|
|
|
|
|
|
|
|
|
|
|
TFC*** |
620.23 |
20.70 |
2120.76 |
671.41 |
– |
– |
657.46 |
515.62 |
4606.18 |
|
|
|
|
|
|
|
|
|
|
|
|
|
|
|
|
Industry Sector |
356.88 |
16.38 |
556.30 |
380.42 |
– |
– |
– |
277.14 |
1587.11 |
|
|
|
Transport Sector |
32.99 |
– |
905.51 |
17.72 |
– |
– |
– |
10.47 |
966.69 |
|
|
|
Other Sectors |
225.12 |
– |
527.11 |
273.27 |
– |
– |
– |
228.01 |
1253.51 |
|
|
|
Non–Energy Use |
5.24 |
4.32 |
131.84 |
– |
– |
– |
– |
– |
141.40 |
|
|
* Combustible renewables & waste final consumption has been estimated based on TPES. |
|
** Other includes geothermal, solar, electricity and heat, wind, etc. *** Totals may not always |
|
|
36 |
add up due to a lack of breakdown of consumption for combustible renewables & waste. |
|
|
|
|

BALANCE TABLE
The World
2003
|
|
|
|
|
|
|
|
|
(Mtoe) |
|
||
SUPPLY AND |
Coal |
Crude |
Petroleum |
Gas |
Nuclear |
Hydro |
Combustible |
Other* |
Total |
|
|
|
CONSUMPTION |
|
Oil |
Products |
|
|
|
Renewables |
|
|
|
|
|
|
|
|
|
|
|
|
& Waste |
|
|
|
|
|
|
|
|
|
|
|
|
|
|
|
|
|
|
Indigenous Prod. |
2562.14 |
3782.87 |
– |
2250.34 |
687.31 |
227.50 |
1144.50 |
54.35 |
10709.00 |
|
|
|
Imports |
475.24 |
2152.07 |
764.88 |
623.18 |
– |
– |
1.44 |
46.86 |
4063.67 |
|
|
|
Exports |
–466.97 |
–2048.64 |
–857.38 |
–619.54 |
– |
– |
–1.83 |
–47.17 |
–4041.52 |
4 |
||
Stock Changes |
13.16 |
–10.86 |
0.54 |
–9.84 |
– |
– |
–1.00 |
– |
–8.00 |
|||
|
||||||||||||
|
|
|
|
|
|
|
|
|
|
|
|
|
TPES |
2583.57 |
3875.44 |
–91.96 |
2244.14 |
687.31 |
227.50 |
1143.11 |
54.04 |
10723.14 |
|
|
|
|
|
|
|
|
|
|
|
|
|
|
|
|
Intl. Marine Bunkers |
– |
– |
–144.42 |
– |
– |
– |
– |
– |
–144.42 |
|
||
Transfers |
– |
–121.73 |
135.49 |
– |
– |
– |
– |
– |
13.76 |
|
|
|
Statistical Diff. |
–33.56 |
–13.53 |
1.96 |
0.06 |
– |
– |
0.09 |
0.10 |
–44.87 |
|
||
Electricity Plants |
–1496.42 |
–20.18 |
–215.72 |
–468.60 |
–675.23 |
–227.50 |
–35.38 |
1233.71 |
–1905.31 |
|
||
CHP Plants |
–186.79 |
–0.06 |
–36.82 |
–275.35 |
–12.08 |
– |
–27.42 |
289.79 |
–248.74 |
|
||
Heat Plants |
–73.50 |
–1.02 |
–16.37 |
–87.73 |
– |
– |
–6.27 |
149.94 |
–34.96 |
|
||
Gas Works |
–11.87 |
– |
–3.68 |
8.49 |
– |
– |
– |
– |
–7.06 |
|
||
Pet. Refineries |
– |
–3736.39 |
3704.52 |
– |
– |
– |
– |
– |
–31.87 |
|
||
Coal Transf. |
–173.35 |
0.04 |
–2.67 |
–0.20 |
– |
– |
– |
– |
–176.18 |
|
||
Liquefaction Plants |
–17.45 |
8.72 |
– |
–2.90 |
– |
– |
– |
– |
–11.63 |
|
||
Other Transf. |
0.01 |
31.38 |
–29.95 |
–5.46 |
– |
– |
–47.25 |
– |
–51.27 |
|
||
Own Use |
–50.52 |
–9.64 |
–201.73 |
–198.06 |
– |
– |
–4.84 |
–151.68 |
–616.46 |
|
||
Distribution Losses |
–1.91 |
–3.63 |
–0.22 |
–22.47 |
– |
– |
– |
–148.79 |
–177.01 |
|
||
|
|
|
|
|
|
|
|
|
|
|
|
|
TFC |
538.21 |
9.41 |
3098.43 |
1191.92 |
– |
– |
1022.04 |
1427.12 |
7287.13 |
|
|
|
|
|
|
|
|
|
|
|
|
|
|
|
|
Industry Sector |
409.62 |
9.02 |
607.80 |
539.94 |
– |
– |
162.82 |
596.50 |
2325.69 |
|
|
|
Transport Sector |
5.50 |
0.01 |
1797.85 |
61.51 |
– |
– |
8.88 |
21.08 |
1894.83 |
|
|
|
Other Sectors |
110.39 |
0.37 |
488.63 |
590.48 |
– |
– |
850.35 |
809.54 |
2849.76 |
|
|
|
Non–Energy Use |
12.69 |
– |
204.15 |
– |
– |
– |
– |
– |
216.84 |
|
|
|
* Other includes geothermal, solar, electricity and heat, wind, etc.
37

E |
|
|
|
|
|
|
|
|
|
|
|
N |
|
|
|
|
SIMPLIFIED ENERGY |
||||||
E |
|
|
|
|
|||||||
R |
|
|
|
|
|||||||
G |
|
|
|
|
|
|
|
|
|
|
|
Y |
|
|
|
|
The OECD |
|
|
|
|
||
B |
|
|
|
|
|
1973 |
|
|
|
|
|
A |
|
|
|
|
|
|
|
|
|
(Mtoe) |
|
|
|
|
|
|
|
|
|
|
|
||
L |
|
|
|
|
|
|
|
|
|
|
|
|
|
|
|
|
|
|
|
|
|
|
|
|
SUPPLY AND |
Coal |
Crude |
Petroleum |
Gas |
Nuclear |
Hydro |
|
Other* |
Total |
|
A |
|
Combustible |
|||||||||
|
CONSUMPTION |
|
Oil |
Products |
|
|
|
Renewables |
|
|
|
N |
|
|
|
|
|
|
|
||||
|
|
|
|
|
|
|
|
& Waste |
|
|
|
C |
|
|
|
|
|
|
|
|
|
|
|
|
Indigenous Prod. |
818.29 |
701.67 |
– |
705.65 |
49.22 |
78.46 |
85.96 |
6.13 |
2445.38 |
|
E |
|
||||||||||
|
Imports |
121.72 |
1286.57 |
337.43 |
62.56 |
– |
– |
0.03 |
7.55 |
1815.85 |
|
S |
|
||||||||||
|
Exports |
–111.07 |
–63.46 |
–173.84 |
–50.39 |
– |
– |
–0.01 |
–7.00 |
–405.78 |
|
|
|
||||||||||
|
|
Intl. Marine Bunkers |
– |
– |
–72.76 |
– |
– |
– |
– |
– |
–72.76 |
|
|
Stock Changes |
14.41 |
–11.04 |
–11.51 |
–11.98 |
– |
– |
0.06 |
– |
–20.07 |
|
|
|
|
|
|
|
|
|
|
|
|
|
|
TPES |
843.35 |
1913.74 |
79.32 |
705.83 |
49.22 |
78.46 |
86.04 |
6.67 |
3762.62 |
|
|
|
|
|
|
|
|
|
|
|
|
|
|
Transfers |
– |
–37.99 |
42.12 |
– |
– |
– |
– |
– |
4.13 |
|
|
Statistical Diff. |
17.70 |
13.14 |
2.28 |
–5.62 |
– |
– |
–0.00 |
– |
27.50 |
|
|
Electricity Plants |
–387.37 |
–20.67 |
–223.37 |
–108.33 |
–49.12 |
–78.46 |
–1.42 |
363.19 |
–505.54 |
|
|
CHP Plants |
–53.52 |
– |
–7.93 |
–11.65 |
–0.10 |
– |
–0.75 |
30.94 |
–43.01 |
|
|
Heat Plants |
–9.22 |
– |
–0.91 |
–0.69 |
– |
– |
–0.80 |
7.11 |
–4.50 |
|
|
Gas Works |
–8.40 |
–0.60 |
–8.81 |
13.02 |
– |
– |
– |
– |
–4.79 |
|
|
Pet. Refineries |
– |
–1871.64 |
1864.06 |
– |
– |
– |
– |
– |
–7.58 |
|
|
Coal Transf. |
–90.04 |
1.48 |
–3.38 |
–0.19 |
– |
– |
–0.02 |
– |
–92.15 |
|
|
Liquefaction Plants |
–0.87 |
– |
– |
– |
– |
– |
– |
– |
–0.87 |
|
|
Other Transf. |
– |
3.74 |
–5.27 |
–0.03 |
– |
– |
– |
– |
–1.55 |
|
|
Own Use |
–23.62 |
–1.00 |
–127.38 |
–72.86 |
– |
– |
–0.07 |
–33.37 |
–258.29 |
|
|
Distribution Losses |
–2.32 |
– |
–0.24 |
–3.95 |
– |
– |
– |
–30.33 |
–36.83 |
|
|
|
|
|
|
|
|
|
|
|
|
|
|
TFC |
285.69 |
0.21 |
1610.48 |
515.53 |
– |
– |
82.99 |
344.21 |
2839.11 |
|
|
|
|
|
|
|
|
|
|
|
|
|
|
Industry Sector |
179.29 |
0.21 |
426.97 |
259.25 |
– |
– |
42.02 |
168.80 |
1076.53 |
|
|
Transport Sector |
7.21 |
– |
691.14 |
17.00 |
– |
– |
0.00 |
5.29 |
720.64 |
|
|
Other Sectors |
96.10 |
– |
396.27 |
239.28 |
– |
– |
40.97 |
170.13 |
942.74 |
|
|
Non–Energy Use |
3.10 |
– |
96.11 |
– |
– |
– |
– |
– |
99.20 |
*Includes geothermal, solar, electricity and heat, wind, etc.
38