

Radiation Physics for Medical Physiscists - E.B. Podgorsak
.pdf8.4 Activation of Nuclides |
299 |
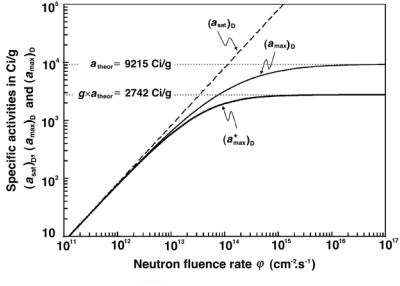
Fig. 8.14. Specific activity fraction f defined as (amax)D/(atheor)D plotted against the neutron fluence rate ϕ˙ for cobalt-60, iridium-192, and molybdenum-99. The data for molybdenum are visible only at very high fluence rates because the activation factor m at a given ϕ˙ is several orders of magnitude smaller for molybdenum-99 in comparison with that of cobalt-60 and iridium-192
which gives
|
m |
1 |
|
|
|
f = m e |
|
ln m = m |
|
, |
(8.115) |
1−m |
1−m |
||||
where we used the following relationships: m = σPϕ/λ˙ |
D and AD ≈ AP. |
||||
We then introduce m = αϕ˙ , where α is defined as α = σP/λD, to obtain |
|||||
f = (αϕ˙ )1/(1−αϕ˙ ) |
|
|
(8.116) |
||
and plot this expression in Fig. 8.14 for cobalt-60, iridium-192, and molybden- um-99 in the fluence rate range from 1011 cm−2 · s−1 to 1017 cm−2 · s−1. Again, the data for cobalt-60 and iridium-192 are essentially the same for a given ϕ˙ , since, fortuitously, the ratio σP/λD is almost identical for the two radionuclides. The molybdenum-99 fraction f data, on the other hand, are extremely small in comparison to those of the other two radionuclides indicating very low practical specific activities in the practical fluence rate range from 1012 cm−2 · s−1 to 1015 cm−2 · s−1.
Data from Fig. 8.14 show that for cobalt-60 and iridium-192 the fraction f is 0.07 at ϕ˙ = 1013 cm−2 ·s−1 and 0.49 at ϕ˙ = 2×1014 cm−2 ·s−1. Same results are provided in Table 8.2 with the ratio (amax)D/(atheor)D. Thus, to obtain a higher specific activity in a cobalt-60 or iridium-192 target, we would have to surpass the currently available reactor fluence rates ϕ˙ . For example, to reach f = 0.75, i.e., (amax)D = 850 Ci/g for a cobalt-60 source and 6900 Ci/g for an iridium-192 source, a ϕ˙ of 1015 cm−2 · s−1 would be required. This would result in an activation factor m of 8.8 and, as shown in Fig. 8.12 and given

300 8 Radioactivity
by (8.113), the activation time tmax to reach this specific activity would be relatively short at 2.1 years for cobalt-60 and 30 days for iridium-192.
8.4.7 Neutron Activation of the Daughter:
Depletion-Activation Model
In the discussion of neutron activation above we have tacitly assumed that the daughter nuclide is not a ected by exposure to activation particles. In situations where this assumption does not hold, account must be taken of the activation of the daughter radionuclide into a granddaughter that may or may not be radioactive. Ignoring the possibility of the granddaughter radioactivity, we account for the daughter activation by subtracting σDϕN˙ D(t) from the di erential equation for dND/dt given in (8.88) to obtain
dND |
= σDϕN˙ |
D(t) − λDND(t) − σDϕN˙ |
D(t) |
||||||||
dt |
|||||||||||
|
= σ |
D |
ϕN˙ |
D |
(t) |
− |
λ |
N |
D |
(t) , |
(8.117) |
|
|
|
|
D |
|
|
|
||||
where σP and σD are cross sections for activation of parent and daughter nuclei, respectively; NP(t) and ND(t) are numbers of parent and daughter nuclei, respectively; and ϕ˙ is the particle fluence rate. The modified decay constant λD is defined as follows:
λD = λD + σDϕ˙ . |
(8.118) |
Using the same initial conditions as in (8.88), we get the following solution to (8.113):
ND(t) = NP(0) |
σPϕ˙ |
e−σPϕt˙ − e−λDt |
(8.119) |
λD − σPϕ˙ |
and the following expression for the daughter activity AD(t)
AD(t) = λDND(t) = NP(0) |
σPϕλ˙ D |
e−σPϕt˙ − e−λDt |
= |
|||||||
λD − σPϕ˙ |
|
|||||||||
= σPϕN˙ P(0) |
(λ /λ ) |
D |
e− |
P |
ϕt˙ |
− e− |
D . |
(8.120) |
||
1 − σPϕ/λ˙ |
||||||||||
|
D |
D |
|
σ |
|
λ t |
|
|||
To obtain a general expression for the daughter activity in the “parent depletion-daughter activation model ” we now introduce new parameters and variables, similarly to the approach we took in the discussion of the decay series and the radioactivation depletion model, as follows:
k = σP/σD |
(8.121) |
|||||
|
λ |
σDϕ˙ |
||||
ε = |
D |
= 1 + |
|
(8.122) |
||
|
|
|||||
|
λD |
λD |
||||
m = |
σPϕ˙ |
|
(8.123) |
|||
λD |
||||||
|
|
|
||||
302 8 Radioactivity
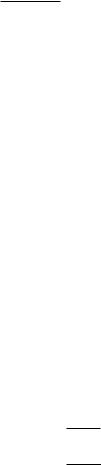
Fig. 8.15. A plot of function g of (8.132) against parameter k = σP/σD
k → ∞, the function g approaches 1, and (amax)D transforms into (amax)D of (8.110).
In the limit for ϕ˙ → ∞, the maximum specific activity (amax)D in the depletion-activation model thus approaches a limit g(atheor)D that is lower than the (atheor)D limit of the depletion model, since g < 1. The value g = 1 applies to the depletion model in which σD = 0, ε = 1 and k = ∞.
8.4.8 Example of Daughter Neutron Activation: Iridium-192
A closer investigation of the iridium radioactivation reveals a considerably more complicated picture than the one given in Sect. 8.4.5:
•Firstly, iridium has two stable isotopes: iridium-191 (Ir-191) with a natural abundance of 37.2% (σP = σ191 = 954 b) and iridium-193 with a natural abundance of 63.7% (σP = σ193 = 100 b). The Ir-191 isotope is of interest in industry and medicine, since iridium-192, the product of neutron activation has a reasonably long half-life of 73.8 days. In contrast, neutron activation of Ir-193 results in Ir-194 that decays with a short half-life of 19.3 hours. Since the Ir-192 radionuclide is produced through the neutron activation of the Ir-191 stable nuclide, the natural mixture of Ir-191 (37.3%) and Ir-193 (62.7%) in the activation target will result in a lower final specific activity of the Ir-192 source in comparison with activation of a pure Ir-191 target.
8.4 Activation of Nuclides |
303 |
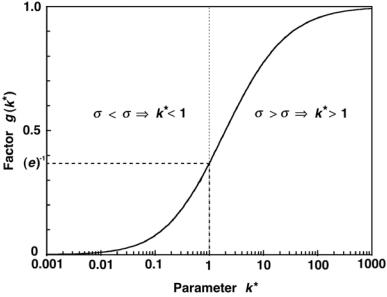
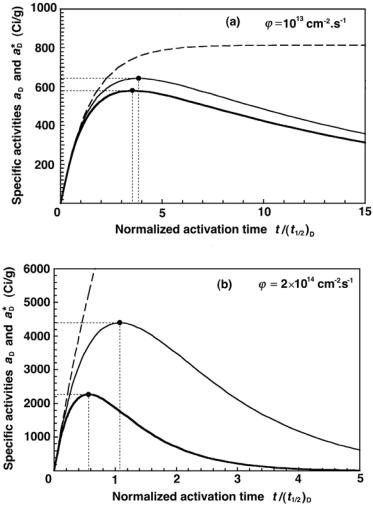
Fig. 8.16. A plot of normalized activity functions against x for iridium-191 neutron activation: zD for the saturation model (dashed curves); yD for the depletion model; and yD for the depletion-activation model (heavy solid curves). The functions are plotted for two neutron fluence rates: ϕ˙ = 1013 cm−2·s−1 and ϕ˙ = 2×1014 cm−2·s−1
•Secondly, iridium-192, the daughter product of iridium-191 neutron activation, itself has a significant cross section for neutron activation σD = σ192 = 1420 b in contrast to the parent cross section σP = σ191 = 954 b. As shown in Sect. 8.4.5, the activation of the daughter product will a ect the specific activity of the iridium-192 source.
In Fig. 8.16 we plot the normalized activity functions for iridium-191: zD of (8.105) for the saturation model; yD of (8.103) for the depletion model; and yD of (8.127) for the depletion-activation model. The functions are plotted against the variable x of (8.100) for two neutron fluence rates: ϕ˙ = 1013 cm−2· s−1 and ϕ˙ = 2 × 1014 cm−2 · s−1. The relevant parameters for these functions and three activation models are listed in Table 8.3.
The following features are of note:
1.For all three functions (zD, yD, and yD) the initial slopes at x = 0 are identical and equal to (ln 2)/m.
2.For the saturation model zD saturates at 1; for the depletion model yD
reaches its maximum of (ymax)D at (xmax)D; for the depletion-activation model yD reaches its maximum of (ymax)D at (xmax)D.
3.(xmax)D and (ymax)D for the depletion-activation model decrease in comparison to (xmax)D and (ymax)D for the depletion model, respectively. The larger is ϕ˙ , the larger is the discrepancy between the two parameters.
304 8 Radioactivity
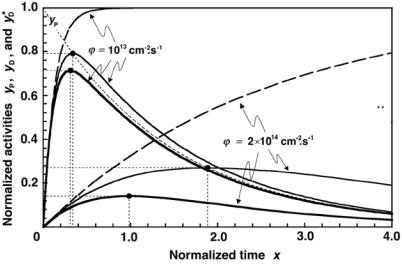
Fig. 8.17. Maximum attainable specific activity for iridium-192 against neutron fluence rate ϕ˙ for the three activation models: saturation model (dashed curve); depletion model (solid curve); and depletion-saturation model (heavy solid curve). An assumption is made that the activation parent target contains pure iridium-191 rather than a natural mixture of iridium-191 and iridium-193 equal to 37.3% and 62.7%, respectively
4.(ymax)D no longer occurs at the point of ideal equilibrium where yP = yD, in contrast to (ymax)D of the daughter in the depletion model that occurs at the point of ideal equilibrium.
Figure 8.17 shows a plot of the maximum attainable specific activity for iridium-192 against neutron fluence rate ϕ˙ for the three activation models: saturation model with dashed curve; depletion model with solid curve; depletion-activation model with heavy solid curve. The saturation model saturates at σPϕN˙ A/AP, the depletion model saturates at the theoretical specific activity for iridium-192 at 9215 Ci/g, as also shown in Fig. 8.11, while the depletion-activation model saturates at g × (atheor)Ir−192 = 2742 Ci/g, where g = 0.3, as given in (8.132) with k for iridium-192 equal to 0.672, as shown in Fig. 8.16 (Note: k = σP/σD = 954/1420).
Figure 8.17 shows that when large specific activities of iridium-192 are produced with fluence rates of the order of 1013 cm−2 · s−1 or higher, the best model for estimation of the specific activity of iridium-192 sample is the depletion-activation model.
In Fig. 8.18 we plot aD, the specific activity of iridium-192, against activation time t normalized to (t1/2)D, for the three radioactivation models (saturation model with dashed curve, depletion model with solid curve, and

8.4 Activation of Nuclides |
305 |
Table 8.3. Parameters of the depletion model and the depletion-activation model applied to neutron activation of iridium-191 nuclide into iridium-192 nuclide
|
|
Particle fluence |
Definition |
|
|
|
|
|
|
|
|
||
|
|
ϕ˙ = |
ϕ˙ = |
|
|
|
|
|
|
|
|
|
|
|
|
1013 cm−2 · s−1 |
2 × 1014 cm−2 · s−1 |
|
|
|
|
|
|
|
|
|
|
λD (s−1) |
1.087 × 10⁻⁷ |
1.087 × 10⁻⁷ |
λD = ln 2/(t1/2)D |
|
|
|
|
|
|||||
λD (s−1) |
1.229 × 10⁻⁷ |
3.927 × 10⁻⁷ |
λD = λD + σDϕ˙ (a) |
|
|
|
|
||||||
ε |
|
1.0 |
1.0 |
ε = 1 |
|
|
|
|
|
|
|
|
|
ε |
|
1.13 |
3.61 |
ε = λD/λD |
(b) |
|
|
|
|
|
|||
m |
|
0.088 |
1.76 |
m = σPϕ/λ˙ D |
|
|
|
|
|
||||
|
|
|
|
|
|
|
|
|
|||||
m |
|
0.078 |
0.49 |
m = σDϕ/λ˙ D = m/ε |
|
|
|
||||||
(xmax)D |
0.338 |
1.89 |
(xmax)D = m ln m/[(m − 1) ln 2] |
||||||||||
(x |
|
0.311 |
0.98 |
|
|
ln m /[(m |
− |
1) ln 2] |
|||||
max)D |
0.793 |
0.270 |
(xmax)D = m |
|
(x |
|
) |
|
|
|
|||
(ymax)D |
(ymax)D = 1/2 |
|
max |
D |
|
|
|
||||||
(ymax |
)D |
0.713 |
0.140 |
(ymax |
)D = 1/(ε |
2 |
(x |
) |
D ) |
|
|
||
max |
|
|
|||||||||||
(amax)D |
643.8 |
4398 |
(amax)D = (σPNA/AP)ϕ˙ (ymax)D |
||||||||||
(amax |
)D |
580.0 |
2275 |
(amax |
)D = (σPNA/AP)ϕ˙ (ymax)D |
||||||||
(tmax)D/(t1/2)D |
3.84 |
1.07 |
(tmax)D/(t1/2)D = (xmax)D/m |
||||||||||
(tmax)D/(t1/2)D |
3.53 |
0.56 |
(tmax)D/(t1/2)D = (xmax)D/(m ε ) |
||||||||||
(a)σD(Ir - 192) = 1420 b;
(b)σP(Ir - 191) = 954 b
depletion-activation model with heavy solid curve) and two fluence rates ϕ˙ : 1013 cm−2 · s−1 in the top figure and 2 × 1014 cm−2 · s−1 in the bottom fig-
ure. The appropriate values for the parameters (amax)D, (tmax)D, (amax)D, and (tmax)D are given in Table 8.3. Note that an assumption is made that
the iridium activation sample contains only the iridium-191 stable nuclide rather than a natural mixture of iridium-191 and iridium-193. Thus to get the specific activity for a natural sample of iridium, the natural abundance of iridium-191 in the sample would have to be taken into account.
Again we note that the activation of the daughter product iridium-192 has a significant e ect on the daughter specific activity; this is especially pronounced at larger fluence rates, as shown in Fig. 8.18.
The following conclusions can now be made:
•The best model for description of radioactivation kinematics is the depletion model when the daughter product is not activated by the exposure to radioactivation particles. An example for the use of this model is the activation of cobalt-59 into cobalt-60.
•The best model for describing the radioactivation kinematics in situations where the daughter product is activated by the radioactivation particles is the depletion-activation model. An example for the use of this model is the neutron activation of iridium-191 into iridium-192.
•The saturation model is only an approximation to the other two models. It is valid only at very short activation times or when σPϕ/λ˙ D < 10−3.
8.4 Activation of Nuclides |
307 |
8.4.9 Practical Aspects of Radioactivation
Currently, the list of known nuclides contains some 275 stable nuclides and over 3000 radioactive nuclides (radionuclides). Some 200 radionuclides are used in industry and medicine and most of them are produced through radioactivation.
A variety of particles may be used for radioactivation; however, most commonly radioactivation is achieved by bombarding stable target nuclei with neutrons produced by nuclear reactors or by protons produced by cyclotrons.
Nuclear reactors are the main source of radionuclides used in medicine. These radionuclides are produced either through neutron activation of stable target nuclei placed into the reactor or by separation from fission fragments resulting from the fission process of the nuclear fuel in which fuel nuclei split into two lighter fragments and two or three fission neutrons.
Activation with Thermal Neutrons
Thermal neutrons produced in nuclear reactors are the most common particles used for radioactivation. This type of the radioactivation process is then referred to as neutron activation or neutron capture and produces neutronrich unstable isotopes that decay through β− decay into more stable configurations. Two types of neutron activation processes occur commonly: (n, γ) and (n, p). The (n, γ) process results in emission of γ rays, while the (n, p) process results in emission of protons.
Sources produced by neutron activation in a nuclear reactor normally contain a mixture of stable parent nuclei in addition to radioactive daughter nuclei. The parent nuclei thus act as carriers of daughter nuclei and e ectively decrease the specific activity of the source. For example, the practical specific activity of cobalt-60 sources is limited to about 300 Ci/g or 25% of the carrier-free theoretical activity of 1133 Ci/g. This means that in a cobalt-60 teletherapy source 75% of the source mass is composed of stable 59Co nuclei and only 25% is composed of radioactive 60Co nuclei. The reactor-produced molybdenum-99, on the other hand, has a practical specific activity that is several orders of magnitude lower than the theoretical specific activity of molybdenum-99.
The (n, γ) reaction is much more common than the (n, p) reaction and usually produces radioactive products that are not carrier-free, while the (n, p) reaction can produce carrier-free sources. In non-carrier-free sources, a chemical separation of the daughter from the parent is not possible because the parent and daughter are isotopes of the same element; a physical separation, while possible, is too expensive.
•In a (n, γ) reaction the target nucleus AZ X captures a neutron and is converted into an excited nucleus A+1Z X that undergoes an immediate deexcitation to its ground state through emission of a γ ray. Note that AZ X
308 8 Radioactivity
and A+1Z X are isotopes of the same chemical element. The schematic representation of the reaction is as follows:
ZAX + n = A+1Z X + γ or ZAX(n, γ)A+1Z X . |
(8.133) |
•In a (n, p) reaction the target nucleus AZ X captures a neutron and promptly ejects a proton to become converted into a new nucleus AZ−1Y. Note that
AZ X and AZ−1Y do not represent the same chemical element. Schematically the reaction is represented as follows:
AX + n = A |
Y + p |
or |
AX(n, p) A |
Y . |
(8.134) |
||
Z |
Z−1 |
|
|
Z |
Z−1 |
|
|
From a medical physics perspective the most important neutron activation processes are:
•Production of cobalt-60 sealed sources for use in external beam radiotherapy with typical initial source activity of the order of 370 TBq (104 Ci).
•Production of iridium-192 sealed sources for use in brachytherapy with typical activities of 0.37 TBq (10 Ci).
•Production of molybdenum-99 radioisotope for generating the technetium99m (99mTc) radionuclide for use in nuclear medicine.
Activation with Protons or Heavier Charged Particles
Protons produced by cyclotrons are used in the production of proton-rich unstable radionuclides that decay through β+ decay or electron capture into more stable configurations. When striking a target material, protons may cause nuclear reactions that produce radionuclides in a manner similar to neutron activation in a reactor. However, because of their positive charge, protons striking the target must have relatively high kinetic energies, typically 10–20 MeV, to penetrate the repulsive Coulomb barrier surrounding the positively charged nucleus. Many proton activation reactions are endoergic which means that energy must be supplied by the projectile for the reaction to occur. The minimum energy that will allow the reaction to occur is referred to as the threshold energy.
Proton capture by a target nucleus changes the atomic number from Z for the parent to Z + 1 for the daughter nucleus allowing production of carrierfree radionuclides for use in medicine, because a chemical separation of the newly produced daughter radionuclide from the remaining parent nuclide is possible. Positron emitters produced for use in medicine by proton activation in cyclotrons generally have much shorter half-lives than radionuclides produced for use in medicine by neutron activation in nuclear reactors.
Cyclotrons generally produce smaller quantities of radioactivity than do nuclear reactors because:
1.cross sections for proton capture are lower by several orders of magnitude than those for neutron capture and they are strongly energy dependent;
2.the proton beam is monodirectional and is attenuated in the target;