

Radiation Physics for Medical Physiscists - E.B. Podgorsak
.pdf7.8 General Aspects of Photon Interaction with Absorbers |
239 |
Table 7.8. Characteristic absorber thicknesses and their e ects upon beam intensity attenuation
Absorber thickness |
|
I(x) |
|
100 |
I(x) |
|
Name |
Symbol |
|
I(0) |
I(0) |
||||||
|
|
|
|
|
||||
|
|
|
|
|
|
|||
(ln 2)/µ |
0.500 |
50.0% |
|
Half-Value Layer |
HVL = x1/2 |
|||
1/µ |
0.368 |
36.8% |
|
Mean Free Path |
MFP = x¯ |
|||
(ln 10)/µ |
0.100 |
10.0% |
|
Tenth-Value Layer |
TVL = x1/10 |
|||
3/µ |
0.050 |
5.0% |
|
— |
— |
|||
5/µ |
0.0067 |
0.7% |
— |
— |
||||
7/µ |
0.0009 |
0.1% |
— |
— |
||||
9/µ |
0.00012 |
0.012% |
— |
— |
||||
7.8.3 Other Attenuation Coe cients and Cross Sections
In addition to the linear attenuation coe cient µ, other related coe cients and cross sections are in use for describing photon beam attenuation characteristics, such as
•mass attenuation coe cient µm
•atomic cross section aµ
•electronic cross section eµ
•energy transfer coe cient µtr
•energy absorption coe cient µab
The relationship among the various attenuation coe cients and cross sections is given as follows:
µ = ρµm = n aµ = Z n (eµ) , |
(7.98) |
where
ρis the density of the absorber:
n |
is the number of atoms Na per volume V of the absorber, i.e., n = |
|
Na/V , and Na/V = ρNa/m = ρNA/A with NA the Avogadro’s number |
|
of atoms per gram-atom and A the atomic mass of the absorber in |
|
g/gram-atom; |
Z |
is the atomic number of the absorber. |
Two other coe cients are in use to account for
1.the energy transferred from photons to charged particles (electrons and positrons) in a photon-atom interaction (energy transfer coe cient µtr);
2.the energy actually absorbed by the medium (energy absorption coe - cient µab, often labeled as µen in the literature).
The energy transfer coe cient µtr is defined as follows:
|
|
|
|
µtr = µEtr/(hν) , |
(7.99) |
||

240 7 Interactions of Photons with Matter
where Etr is the average energy transferred from the primary photon with energy hν to kinetic energy of charged particles (electrons and positrons).
The energy absorption coe cient µab is similarly defined as
|
|
|
|
µab = µEab/(hν) , |
(7.100) |
||
where Eab is the average energy absorbed in the volume-of-interest in the medium.
The average energy absorbed in the volume-of-interest in the medium is equal to
¯ |
¯ ¯ |
(7.101) |
Eab = Etr − Erad , |
||
¯ |
|
¯ |
where Erad is the average energy component of Etr that the charged particles
lose in the form of radiative collisions and is thus not absorbed in the volume- of-interest.
•The energy absorption coe cient µab can now be written in terms of the energy transfer coe cient µtr as follows:
|
¯ |
¯ |
¯ |
|
|
|
¯ |
|
|
|
|
|
|||
µ |
= µ |
Eab |
= µ |
Etr − Erad |
= µ |
tr − |
µ |
|
Erad |
= µ |
|
(1 |
− |
g¯) ,(7.102) |
|
|
|
tr E¯tr |
|
||||||||||||
ab |
|
hν |
|
|
hν |
|
|
|
tr |
|
|
||||
where g¯ represents the so-called radiative fraction, i.e., the average fraction of the energy lost in radiative interactions by the secondary charged particles as they travel through the absorbing medium. These radiative interactions are the bremsstrahlung production (for electrons and positrons) and in-flight annihilation (for positrons).
•The in-flight annihilation is usually ignored and the radiative fraction is often referred to as the bremsstrahlung fraction. As discussed in Sect. 5.7, the radiative fraction g¯ is the average value of the radiation yields B(EKo) for the spectrum of all electrons and positrons of various starting energies EKo produced or released in the medium by primary photons.
Table 7.9 lists the various attenuation coe cients and cross-sections, their relationship to the linear attenuation coe cient and their units.
7.8.4 Broad Beam Geometry
In contrast to the narrow beam geometry that is used in determination of the various attenuation coe cients and cross sections for photon beam attenuation, one can also deal with broad beam geometry in which the detector reading is not only decreased through attenuation of the primary photon beam in the absorber, it is also increased by the radiation scattered from the absorber into the detector. The geometry for a broad beam experiment on photon attenuation in an absorber is shown in Fig. 7.31b.

7.8 General Aspects of Photon Interaction with Absorbers |
241 |
Table 7.9. Attenuation coe cients and cross sections used in photon attenuation studies
|
Symbol |
Relationship to µ |
Units |
||
|
|
|
|
|
|
Linear attenuation coe cient |
µ |
µ |
|
cm−1 |
|
Mass attenuation coe cient |
µm |
µ/ρ |
(a) |
cm2 |
/g |
Atomic cross-section |
aµ |
µ/n |
(b) |
cm2 |
/atom |
Electronic cross-section |
eµ |
µ/(Zn ) |
(c) |
cm2 |
/electron |
|
|
|
|
|
|
(a)ρ is the density of the absorber,
(b)n is the number of atoms per unit volume of the absorber, i.e., n = ρNA/A,
(c)Zn is the number of electrons per unit volume of absorber, i.e., Zn =
ρZNA/A.
The signal measured by the detector for an absorber thickness x is then equal to BI(x) where:
I(x) is the narrow beam geometry signal for absorber thickness x,
Bis the so-called build-up factor that accounts for the secondary photons that are scattered from the absorber into the detector.
Broad beam geometry is used in radiation protection for design of treatment room shielding and in beam transport studies.
7.8.5 Classification of Photon Interactions
As discussed in previous sections and summarized in Table 7.10, there are numerous options available to photons for interacting with matter. The photon interactions may be classified according to the type of target and type of event.
•As shown in Table 7.11, according to the type of target there are two possibilities for photon interaction with an atom:
– photon/orbital electron interaction,
Table 7.10. Most important photon interactions with atoms of the absorber
Interaction |
Symbol for |
Symbol for |
Symbol for |
|
electronic |
atomic |
linear |
|
cross section |
cross section |
attenuation coe cient |
Thomson scattering |
eσTh |
Rayleigh scattering |
- |
Compton scattering |
eσc |
Photoelectric e ect |
- |
Pair production |
- |
Triplet production |
eκtp |
Photodisintegration |
- |
aσTh aσR aσc aτ
aκpp aκtp aσpn
σTh
σR
σC
τ
κp κt
σpn
242 |
7 Interactions of Photons with Matter |
|
|
Table 7.11. Types of targets in photon interactions with atoms |
|
|
|
|
Photon-orbital electron interactions |
Photon-nucleus interactions |
|
|
|
|
— with bound electrons |
— with nucleus directly |
|
|
Photoelectric e ect |
Photodisintegration |
|
Rayleigh scattering |
|
— with “free” electrons |
— with Coulomb field of nucleus |
|
|
Thomson scattering |
Pair production |
|
Compton scattering |
|
— with Coulomb field of electron |
|
|
|
Triplet production |
|
|
|
|
|
Table 7.12. Types of photon-atom interactions |
|
|
|
|
Complete absorption of photon |
Photon scattering |
|
|
|
|
Photoelectric e ect |
Thomson scattering |
|
Pair production |
Rayleigh scattering |
|
Triplet production |
Compton scattering |
|
Photodisintegration |
|
|
|
|
|
–photon/nucleus interaction.
•As shown in Table 7.12, according to the type of event there are two possibilities for photon interaction with an atom:
–complete absorption of the photon,
–scattering of the photon.
As far as medical physics is concerned, photon interactions are classified into four categories:
1.Interactions of major importance:
–Photoelectric e ect
–Compton scattering by free electron
–Pair production (including triplet production)
2.Interactions of moderate importance:
–Rayleigh scattering
–Thomson scattering by free electron
3.Interactions of minor importance:
–Photonuclear reactions
4.Negligible interactions:
–Thomson scattering by the nucleus
–Compton scattering by the nucleus
7.8 General Aspects of Photon Interaction with Absorbers |
243 |
–Meson production
–Delbr¨uck scattering
7.8.6 Mass Attenuation Coe cient of Compounds and Mixtures
The mass attenuation coe cient µ/ρ for a compound or mixture is approximated by a summation of a weighted average of its constituents, i.e.,
|
µ |
µ |
|
|
|||
|
|
|
= ,i |
wi |
i |
, |
(7.103) |
|
|
ρ |
ρ |
||||
where |
|
|
|
|
|
|
|
wi |
is the proportion by weight of the i-th constituent, |
|
|||||
µi/ρ |
is the mass attenuation coe cient of the i-th constituent. |
|
|||||
7.8.7 Tabulation of Attenuation Coe cients
The attenuation coe cients and cross sections listed in Table 7.10 have specific values for a given photon energy hν and absorber atomic number Z, and these values represent a sum of values for all individual interactions that a photon may have with an atom (photonuclear reactions are usually neglected).
Thus, for an absorber with density ρ, atomic number Z, and atomic mass A, we write the following relationships for the linear attenuation coe cient µ, mass attenuation coe cient µm, atomic cross section aµ, and electronic cross-section eµ:
µ = τ + σR + σc + κ , |
(7.104) |
||||||||||||||||
µm = µ/ρ = (τ + σR + σc + κ)/ρ , |
(7.105) |
||||||||||||||||
aµ = |
µ |
|
|
A |
= |
1 |
|
|
A |
(τ + σR + σc + κ) |
|
||||||
|
|
|
|
|
|
|
|
||||||||||
|
|
ρ NA |
ρ NA |
|
|||||||||||||
= aτ + aσR + aσc + aκ , |
(7.106) |
||||||||||||||||
eµ = |
µ |
|
A |
= |
1 |
|
A |
(τ + σR + σc + κ) , |
(7.107) |
||||||||
ρ ZNA |
|
|
|||||||||||||||
|
|
|
|
ρ ZNA |
|
||||||||||||
where
τ is the linear attenuation coe cient for photoelectric e ect, σR is the linear attenuation coe cient for Rayleigh scattering, σc is the linear attenuation coe cient for Compton e ect,
κ is the linear attenuation coe cient for pair production (including triplet).
244 7 Interactions of Photons with Matter
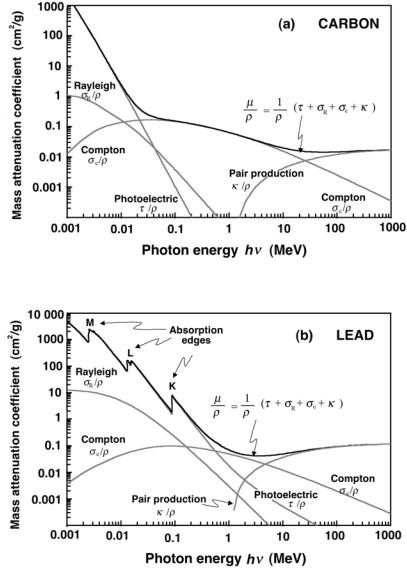
In Fig. 7.32 we show the total mass attenuation coe cients µ/ρ for carbon in part a and lead in part b, plotted against the photon energy hν. In addition to µ/ρ that represents the sum of the individual coe cients for the photoelectric e ect, Rayleigh scattering, Compton scattering and pair production, the coe cients for the individual components are also shown. Also shown are the absorption edges for the lead attenuator; the absorption edges for the carbon attenuator are not visible, because they occur o -scale at energies below 1 keV.
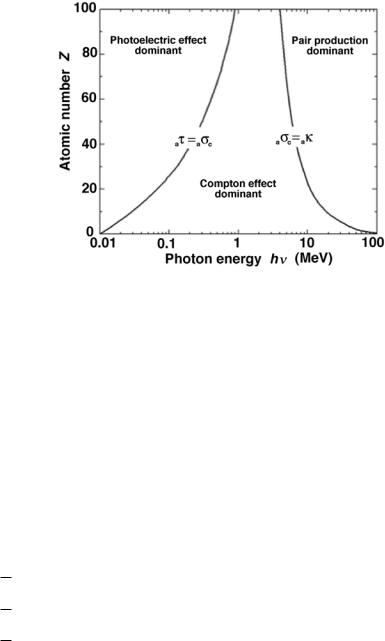
Figure 7.33 is a plot on a (Z, hν) diagram of the relative predominance of the three major photon interactions with atoms: photoelectric e ect, Compton scattering, and pair production for various absorbers with Z = 1 to Z = 100. The two curves on the graph represent the loci of points in the (Z, hν) diagram for which either aτ = aσc or aσc = aκ, i.e., the left hand curve represents (Z, hν) points for which the photoelectric atomic cross section aτ equals the Compton atomic cross section aσc and the right hand curve represents (Z, hν) points for which the Compton atomic cross section aσc equals the pair production atomic cross section aκ.
From Figs. 7.32 and 7.33 the following conclusions may be made:
•At low photon energies (hν < 100 keV) and high atomic numbers Z the photoe ect mass coe cient τ /ρ predominates and makes the largest contribution to the total mass attenuation coe cient µ/ρ.
•At intermediate photon energies and low atomic numbers Z the Compton e ect mass coe cient σc/ρ predominates and makes the largest contribution to the total mass attenuation coe cient µ/ρ.
•The width of the region of Compton scattering predominance depends on the atomic number Z of the absorber; the lower is Z, the broader is the Compton scattering predominance region. For water and tissue this region ranges from 20 keV up to 20 MeV, indicating that for most of radiotherapy the most important interaction of photon beams with tissues is the Compton scattering.
•The pair production dominates at photon energies hν above 10 MeV and at high atomic numbers Z of the absorber.
•In all energy regions the Rayleigh scattering mass coe cient σR/ρ plays only a secondary role in comparison with the other three coe cients.
7.8.8 Energy Transfer Coe cient
The energy transfer coe cient µtr consist of three components, each of them representing a photon-atom interaction in which all or part of the photon energy hν is transferred to charged particles (electrons or positrons). Rayleigh scattering transfers no energy to charged particles in the absorber and the interactions that generally result in energy transfer to charged particles are the photoelectric e ect, Compton scattering and pair production. The energy transfer coe cient µtr is the sum of the energy transfer coe cients for the
7.8 General Aspects of Photon Interaction with Absorbers |
245 |
Fig. 7.32. Mass attenuation coe cient µ/ρ against photon energy hν in the range from 1 keV to 1000 MeV for carbon in part a and lead in part b. In addition to the total coe cient µ/ρ, the individual coe cients for photoelectric e ect, Rayleigh scattering, Compton scattering, and pair production (including triplet production) are also shown. The mass attenuation coe cient µ/ρ is the sum of the coe cients for individual e ects, i.e., µ/ρ = (τ + σR + σc + κ)/ρ
246 7 Interactions of Photons with Matter
Fig. 7.33. Regions of relative predominance of the three main processes of photon interactions with an absorber: photoelectric e ect, Compton scattering, and pair production. The left curve represents the loci of points on the (Z,hν) diagram where the atomic cross section for photoelectric e ect equals the atomic cross section for Compton scattering, i.e., aτ = aσc. The right curve represents the loci of points on the (Z,hν) diagram where the atomic cross section for Compton scattering equals the atomic cross section for pair production, i.e., aσc = aκ
three individual e ects, i.e.,
|
|
|
|
|
|
|
|
|
|
|
|
|
|
|
|
|
|
|
|
|
µtr = µ |
Etr |
= τtr + (σc)tr + κtr = |
|
|
|
|
||||||||||||||
|
|
|
|
|
|
|||||||||||||||
|
hν |
|
|
|
|
|
|
|
|
|
|
|
|
|
|
|
|
|
|
|
= τ |
|
trτ |
|
|
|
trσ |
+ κ |
|
trκ |
= f τ τ + f σ σ + f κκ = |
|
|
||||||||
E |
+ σc |
E |
E |
|
|
|||||||||||||||
hν |
|
|
|
|
|
|
|
|||||||||||||
|
|
|
hν |
|
hν |
|
|
|
|
|||||||||||
= τ 1 |
|
|
|
|
+ σc |
|
trσ |
1 − |
2mec2 |
, |
|
|||||||||
|
PKωKhνK |
E |
|
|||||||||||||||||
− |
|
|
|
+ κ |
|
(7.108) |
||||||||||||||
|
hν |
hν |
hν |
|||||||||||||||||
where
Eτtr is the average energy transferred to electrons (photoelectron and Auger electrons) in a photoelectric e ect process,
Eσtr is the average energy transferred to recoil electron in a Compton e ect process,
Eκtr is the average energy transferred to electron and positron in a pair production process (including triplet production).
¯τ |
|
|
|
|
= 1 − PKωKhνK /(hν) is the average fraction of the photon energy given |
||||
f |
||||
|
|
|
to the photoelectron and Auger electrons in a pho- |
|
7.8 General Aspects of Photon Interaction with Absorbers |
247 |
¯τ |
¯σ |
¯κ |
for photoelectric e ect, |
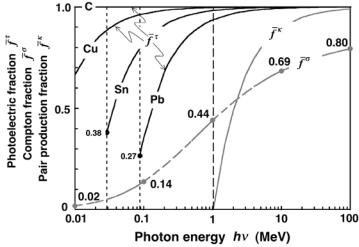
Fig. 7.34. Average energy transfer fractions f |
, f |
, and f |
Compton e ect and pair production, respectively, for carbon, copper, tin, and lead.
¯τ
Only the photoe ect fraction f depends on the atomic number Z of the absorber; the Compton e ect and pair production fractions are independent of Z and depend only on photon energy hν
¯σ |
|
|
σ |
/(hν) |
|
|
|
|
|||
f |
= Etr |
|
|||
¯κ |
|
|
|
2 |
/(hν) |
f |
= 1 − 2mec |
||||
toelectric e ect interaction (for photons with energy above the K edge of the absorbing medium). is the average fraction of the photon energy given to the recoil (Compton) electron in a Compton interaction (see Fig. 7.8).
is the average fraction of the photon energy given to the electron/positron pair in a pair production interaction (including triplet production).
¯τ |
¯σ |
¯κ |
for en- |
Figure 7.34 summarizes the three energy fractions f |
, f |
, and f |
ergy transfer in an absorber from photon to charged particles in photoelectric e ect, Compton scattering, and pair production, respectively.
•All three fractions depend upon photon energy hν, increase with increasing photon energy hν, and converge to 1 at large hν.
• |
|
¯τ |
also |
depends on the atomic number Z of the |
||
The photoelectric fraction f |
|
¯τ |
in the vicinity of the absorption |
|||
|
absorber; the higher is Z, the lower is f |
|||||
|
|
|
|
|
|
¯τ |
|
edge and the slower is the convergence to 1. The photoelectric fraction f |
|||||
|
was given in Fig. 7.25. |
|
|
¯σ |
|
|
|
|
|
|
|
|
|
• |
The Compton Klein-Nishina fraction f |
and the pair production fraction |
||||
¯κ |
|
|
|
|
||
|
f |
are independent of Z and depend on photon energy hν only. The |
||||
|
|
|
|
¯σ |
|
¯κ |
|
Compton Klein-Nishina fraction f |
and the pair production fraction f |
||||
are given in Figs. 7.8 and 7.29, respectively.

248 7 Interactions of Photons with Matter
From (7.108) we note that Etr, the average energy transferred to charged particles, is in general given as
|
|
|
|
|
µtr |
|
|
|
|
|
|
i |
τ |
|
|
|
τ |
|
|
σ |
|
|
|
|
|
σ |
|
|
κ |
|
κ |
|
||||||
|
|
|
|
|
|
|
|
|
|
|
|
|
|
|
|
|
||||||||||||||||||||||
Etr = hν |
|
|
= ,i |
wiEtr = |
|
|
|
Etr |
+ |
c |
|
Etr |
+ |
|
|
Etr |
|
|||||||||||||||||||||
µ |
µ |
µ |
µ |
|
||||||||||||||||||||||||||||||||||
|
= wτ |
|
trτ + wσ |
|
trσ + wκ |
|
|
trκ |
|
|
|
|
|
|
|
|
|
|
|
|
|
|
|
|
|
|
|
|||||||||||
|
E |
E |
E |
|
|
|
|
|
|
|
|
|
|
|
|
|
|
|
|
|
|
|
||||||||||||||||
|
|
τ |
|
|
|
|
|
|
|
|
|
σc |
|
|
|
σ |
|
|
κ |
(hν − 2mec2) , |
|
|||||||||||||||||
|
|
|
|
|
|
|
|
|
|
|
|
|
|
|
|
|
||||||||||||||||||||||
|
= |
|
(hν |
− PKωKhνK ) + |
|
|
Etr |
+ |
|
|
(7.109) |
|||||||||||||||||||||||||||
|
µ |
µ |
µ |
|||||||||||||||||||||||||||||||||||
where
irefers to a particular interaction of the photon with an atom of the absorber,
wi is the weight of the particular interaction i of photon with absorber atoms.
Figure 7.35 gives a plot of the mass energy transfer coe cient µtr/ρ for carbon and lead in the photon energy range from 1 keV to 100 MeV. The mass attenuation coe cient µ/ρ is shown with dashed curves for comparison.
•For lead the K, L, and M absorption edges are visible, for carbon they are not because they all occur below the lower 1 keV limit of the graph.
•At photon energies between 1 keV and 10 keV in the photoe ect region
µ/ρ ≈ µtr/ρ ≈ µab/ρ.
•At intermediate photon energies in the Compton region the Compton
¯σ
fraction f correction to µ/ρ is very e ective (see Fig. 7.34) and clearly separates µ/ρ from µtr/ρ.
•At very high photon energies in the pair production region the pair production fraction is 1 and µ/ρ ≈ µtr/ρ (see Fig. 7.34).
7.8.9 Energy Absorption Coe cient
The energy absorption coe cient µab is related to the energy transfer coe - cient µtr by
µab = µtr(1 − g¯) , |
(7.110) |
with g¯ representing the so-called radiative fraction, i.e., the average fraction of secondary charged particle energy lost in radiative interactions that the secondary charged particles experience in their travel through the absorbing medium. These radiative interactions are the bremsstrahlung production (for electrons and positrons) and in-flight annihilation (for positrons).
•For low absorber atomic number Z and low photon energies hν the radiative fraction g¯ approaches zero and µtr ≈ µab.
•For increasing Z or hν the radiative fraction g¯ increases gradually, so that, for example, in lead at hν = 10 MeV, g¯ = 0.26 and µab = 0.74 µtr.
Figure 7.35 also shows, in addition to the mass attenuation coe cient µ/ρ and mass energy transfer coe cient µtr/ρ, the mass energy absorption