

Neutron Scattering in Biology - Fitter Gutberlet and Katsaras
.pdf172 S. Krueger et al.
SANS, indicating that changes in the size and shape of the ribozyme during the transition from the intermediates to the native state are smaller than the 1 ˚A error of these measurements.
Taken together, these experiments provide strong support for the idea that counterions induce the collapse of polynucleotide chains, but that collapse alone is not su cient to produce the native state. That the collapse transition of the Azoarcus ribozyme produces an IC state with near-native Rg values suggests that Mg2+ leads to a specific collapse, in agreement with biochemical assays [41]. In contrast, other RNAs, both smaller and larger than Azoarcus, have been found to form intermediates that are about 5–15% less compact than their native structures [38, 39]. More expanded intermediates could reflect the increased presence of non-native interactions or greater structural dynamics of the folding intermediates compared with the collapsed intermediates formed by the Azoarcus ribozyme.
This example shows how SANS, in combination with biochemical assays and structural modeling techniques, can provide insight into the collapse of RNA molecules. The overall structural information provided by SANS can be directly related to biochemical activity if the biochemical assays are performed under the same conditions as the SANS experiments. Such analyzes can also be applied to protein folding problems.
9.3 Protein Complexes:
Multisubunit Proteins and Viruses
9.3.1 Conformation of a Polypeptide Substrate in Model GroEL/GroES Chaperonin Complexes
The role of molecular chaperones in mediating and controlling intracellular as well as in vitro protein folding has broad implications for biotechnology. There is now considerable insight into the possible mechanisms whereby chaperone proteins recognize, stabilize, and release non-native polypeptide chains in a manner whereby they are able to productively refold. However, there are a number of important, fundamental gaps in the understanding of chaperone action, that remain to be resolved. Among the growing list of chaperone families, which are thought to play essential roles in a variety of fundamental cellular processes, are the chaperonins GroEL and GroES, which have been intensively studied. Knowledge of how misfolded protein substrates physically interact with GroEL should provide vital clues necessary to unravel the process by which GroEL mediates the proper folding of a wide variety of unfolded and misfolded protein substrates. The ultimate goal is to determine the mechanism by which GroEL transforms its substrate proteins and then releases them in a form able to refold to their native conformation.
One of the key issues in establishing a molecular mechanism for GroEL is to describe in structural terms the conformations of polypeptide substrates
9 SANS from Proteins, Nucleic Acids, and Viruses |
173 |
when bound to various chaperonin complexes. Any mechanism for chaperonin action will require the answer to several questions. For example, does a non-native polypeptide substrate unfold further upon binding to GroEL? On the other hand, when a chain is released from GroEL in the presence of the co-chaperonin GroES, does it adopt a more folded, or unfolded conformation? These questions are di cult to resolve with naturally occurring proteins since they refold so readily when released from chaperonin complexes. One approach to address these issues, however, is to utilize a family of mutationally altered protein substrates that are unable to adopt their native conformation. A number of such protein systems are readily available, one of which is a non-native subtilisin variant (PJ9) that is unable to refold when released [47].
Wild-type and Single-ring GroEL
In order to evaluate any changes in polypeptide conformation in association with models of chaperonin complexes, it is necessary to describe a model for the solution conformation of the single ring GroEL variant (srGroEL) used in this study. Data were obtained from srGroEL in both H2O and D2O bu ers and compared to data obtained from wild-type GroEL under the same conditions. Analysis of these data were enhanced by parallel studies with a mutational variant of GroEL for which 16 C-terminal residues have been deleted [48] as well as by using information obtained from previous SANS studies on GroEL and chaperonin complexes [49, 50]. These additional data sets enabled an assignment of the crystallographically disordered C-terminal domain of GroEL, and were also helpful in modeling studies of the solution structure of the single ring chaperonin.
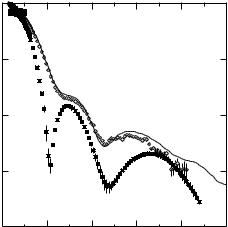
The scattering curve for srGroEL in D2O bu er is presented in Fig. 9.5 along with the corresponding curve for the wild type GroEL. The solid line in Fig. 9.5 represents the scattered intensity calculated, using XTAL2SAS, from just one of the rings of the double-ring crystal structure [51] with the added SANS-derived model for the disordered C-terminal domain. The best fit to the data was obtained when the disordered C-terminal domain is positioned along the inner wall of the GroEL ring, a possibility also suggested in [50], and when no adjustments are made to the location of the flexible apical domains. Equally good fits to the data can still be obtained if the apical domains are allowed to rotate up to 10◦ in a similar manner to that described in [49]. Thus, the solution structure of srGroEL can be described well using one ring of the double ring crystal structure and by positioning the disordered C-terminal domain along the inner wall of the ring.
GroEL Complexes with Substrate
Single-ring GroEL mutants have been shown to assist in the refolding of nonnative polypeptide chains [52, 53] and they form unusually stable complexes with GroES upon the addition of nucleotides. This attribute was exploited to
174 S. Krueger et al.
1 |
I(Q)
0.1
0.01
0.001
0.0001 |
|
|
|
|
|
0.00 |
0.05 |
0.10 |
0.15 |
0.20 |
0.25 |
Q (Å−1)
Fig. 9.5. SANS data of the srGroEL variant (diamond), compared with that of wild-type GroEL (filled squares). The solid line represents the scattered intensity calculated from one ring of the wild-type GroEL crystal structure, including the SANS-derived model for the disordered C-terminal residues
obtain a low-resolution structure for a non-native variant of the serine protease subtilisin polypeptide (PJ9) when bound to GroEL. The subtilisin was 86% deuterated (dPJ9) so that its SLD contrasted su ciently with the chaperonin, allowing the contrast variation technique to be used to separate the scattering from the two components bound in the complex. The srGroEL mutant assured that dPJ9 and GroES were each bound in a 1:1 stoichiometry with the single ring of GroEL, providing an advantage over previous SANS experiments [49] which included mixed stoichiometries of GroEL. For comparison, a complex between dPJ9 and wild-type, double-ring GroEL was also studied. Care was taken to ensure that two dPJ9 molecules were bound to each GroEL molecule, in order to maintain the 1:1 stoichiometry between dPJ9 and each ring of GroEL.
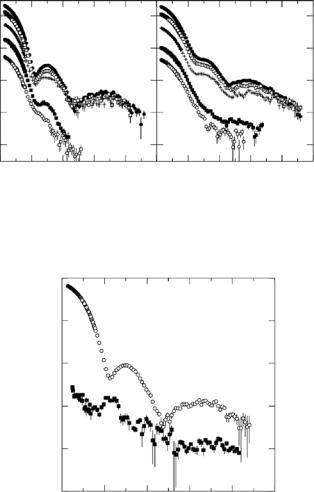
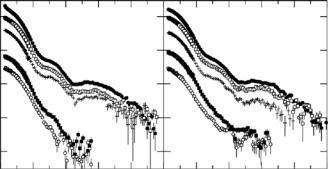
SANS contrast variation data for the wild-type GroEL/dPJ9 and single ring srGroEL/dPJ9 complexes are shown in Fig. 9.6. Measurements were made in 0%, 20%, 70%, 85%, and 100% D2O bu ers in each case [54]. The extensive data set in Fig. 9.6 allows the scattering from each of the components in the complex to be separated using Eq. 9.3. Here, I1(Q) and I2(Q), refer to the GroEL (or srGroEL) component and the dPJ9 component of the GroEL/dPJ9 complexes, respectively. The cross-term, I12(Q), represents the interference function between the GroEL and dPJ9 components. Fig. 9.7 shows the scattered intensities for the wild-type GroEL and dPJ9 components, as determined from the contrast variation data. The peak in the dPJ9 curve at
9 SANS from Proteins, Nucleic Acids, and Viruses |
175 |
I (Q)
1 |
(a) |
(b) |
1 |
0.1 |
|
|
0.1 |
0.01 |
|
|
0.01 |
0.001 |
|
|
0.001 |
|
(x0.1) |
(x0.1) |
|
0.0001 |
|
0.0001 |
|
(x0.1) |
(x0.1) |
0.00 0.05 0.10 0.15 0.20 0.00 0.05 0.10 0.15 0.20 0.25 Q ( Å−1)
Fig. 9.6. Contrast variation data from (a) GroEL/dPJ9 and (b) srGroEL/dPJ9 complexes measured in 100% (filled circle), 85% (square), 70% (+), 20% (circle), and 0% (filled square) D2O. The data in 20% and 0% D2O solution are shifted by the factor 0.1, as indicated, for clarity
100 |
|
|
|
|
|
10 |
|
|
|
|
|
1 |
|
|
|
|
|
I(Q) |
|
|
|
|
|
0.1 |
|
|
|
|
|
0.01 |
|
|
|
|
|
0.001 |
0.05 |
0.10 |
0.15 |
0.20 |
0.25 |
0.00 |
Q ( Å−1)
Fig. 9.7. Scattered intensities IEL(Q) (circle) and IdPJ9(Q) (filled square), the GroEL and dPJ9 components, as bound in the complex, respectively
Q ≈ 0.05 ˚A−1 is due to the interaction between the two dPJ9 molecules at each end of the GroEL/dPJ9 complex. A comparison of the scattered intensity for bound GroEL and that measured free in solution (Fig. 9.5) indicates that little or no change in GroEL conformation occurs upon binding the substrate polypeptide. The separation of the centers of masses of the two dPJ9 molecules in the complex is approximately 125 ˚A, determined from the location of the peak in IdPJ9(Q), using D = 2π/Qpeak.
176 S. Krueger et al.
A similar analysis for the srGroEL/dPJ9 contrast variation series of data revealed that the Rg value for dPJ9 bound in the srGroEL/dPJ9 complex is 19.0 ˚A. However, its maximum extent is 55 ˚A, as determined from the P (r) function, suggesting that the molecule is very asymmetric. Modeling was accomplished by a Monte Carlo method (LORES) in which a large number of models (>10,000, and >100,000 in some cases) are generated within the constraints of the SANS data and the minimum volume possible for dPJ9, as calculated from its known molecular weight and assuming a partial specific volume of 0.73 cm3 g−1. The models were then tested to determine how well the calculated scattered intensities and P (r) functions fit the data. After initially testing simpler ellipsoidal and cylindrical models, and finding them to be a poor fit to the data, mushroom models for the dPJ9 were explored. Such a model lends itself well to the geometry of the srGroEL molecule and is also suggested for rhodanese in [49].
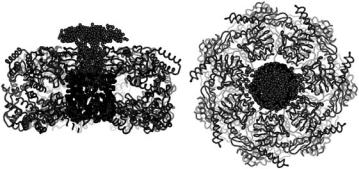
Fig. 9.8 presents two views of a complete model for the srGroEL/dPJ9 complex. The significant result is that the dPJ9 component has an asymmetric shape and that part of the polypeptide must beyond the cavity inside the srGroEL ring and up into the space above the GroEL. Note that the bottom portion of the dPJ9 mushroom penetrates the srGroEL cavity and the top portion sits above the cavity. The srGroEL portion was obtained from the crystal structure with the added SANS-derived model for the disordered C- terminal domain, which is seen at the bottom the complex in the side view.
Single-ring GroEL/GroES Complex with Substrate
Because physiological protein folding is thought to depend on both GroEL and GroES, it was of interest to investigate the conformational changes in a
Side view |
Top view |
Fig. 9.8. Top and side view of the best-fit mushroom model for dPJ9 bound in the srGroEL/dPJ9 complex, constructed from SANS contrast variation and crystallography data. The srGroEL is represented by the ribbon structure, the dPJ9 is represented by the light spheres and the disordered C-terminal residues are represented by the dark spheres
9 SANS from Proteins, Nucleic Acids, and Viruses |
177 |
polypeptide substrate within an active chaperonin complex. In this way, it would be possible to detect any changes in the conformation of the substrate under conditions that either promote, or do not promote, protein folding. However, because chaperonin complexes are in a dynamic equilibrium linked to the ATPase activity of GroEL, a simpler model of these components was needed for the relatively long times needed to collect adequate neutron scattering data. Thus, the single-ring GroEL variant was used to trap dPJ9 within GroEL by GroES upon the addition of ADP (adenosine diphosphate) or ATP (adenosine triphosphate).
Unlike ATP, ADP does not cause dissociation of dPJ9 from GroEL. If dPJ9 is no longer covalently bonded to GroEL, would its location in the GroEL/GroES complex change? To answer this question, two contrast variation series of measurements were performed on the srGroEL/GroES/dPJ9 complex [54]. One set of measurements was obtained with ADP present and the other with ATP present. Measurements were made in 0%, 20%, 70%, 85%, and 100% D2O bu ers in each case. The scattering from each of the components in the complex were then separated into IELES(Q) and IdPJ9(Q), for the srGroEL/GroES component and the dPJ9 component of the GroEL/GroES/dPJ9 complex, respectively, using Eq. 9.3.
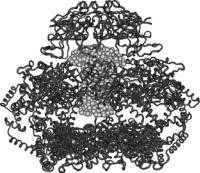
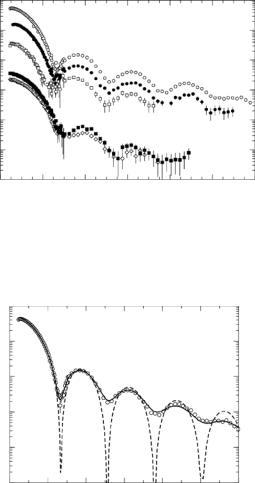
Using this method, the location and approximate shape of dPJ9 in the srGroEL/GroES/PJ9 + ADP complex was determined as modeled in Fig. 9.9. The significant result is that the dPJ9 component retains its asymmetric shape and, again, part of the polypeptide must extend beyond the cavity inside the srGroEL ring and up into the space surrounded by GroES. The significant di erence in the srGroEL/GroES/dPJ9 complex formed from ATP is that the shape of the bound dPJ9 molecule changes from an asymmetric shape such as that shown in Fig. 9.9 to a more symmetric shape. Figure 9.10 shows the distance distribution functions for bound dPJ9 in both the
Fig. 9.9. Side view of a model for the srGroEL/GroES/dPJ9+ADP complex constructed from SANS contrast variation and crystallography data. The srGroEL/GroES complex is represented by the ribbon structure and the dPJ9 is represented by the light spheres. The disordered C-terminal residues are not shown
178 S. Krueger et al.
|
1 |
(a) |
|
0.1 |
|
(Q) |
0.01 |
|
I |
|
|
0.001 |
|
|
0.0001 |
(x0.1) |
|
(x0.1) |
||
|
0.00 0.05 0.10 0.15 0.20 0.00
(b)
(x0.1)
(x0.1)
0.05 0.10 0.15 0.20 0.25
Q (Å−1)
Fig. 9.10. Normalized distance distribution functions, P (r) vs. r, for dPJ9 bound to srGroEL (solid line), srGroEL/GroES + ADP (dotted line) and srGroEL/GroES + ATP (dashed line)
srGroEL/GroES/dPJ9 + ADP and srGroEL/GroES/dPJ9 + ATP complexes. The most probable distance increases from approximately 22 to 30 ˚A , with a similar increase in the radius of gyration, Rg, from 19.0±0.5 ˚A to 21.0±0.5 ˚A. The shape in the presence of ATP is clearly more symmetric, as indicated by the greater symmetry of the distance distribution function. This suggests that dPJ9 is transformed into a more expanded form in the ATP complex. This conformational change either was not supported by the complex formed from ADP or was insu cient to generate a lasting change in shape in that case, and dPJ9 instead relaxed back to a form close to its original conformation. This important observation reflects the relative ability of ATP to promote refolding of protein substrates relative to ADP.
9.3.2 Spatial Distribution and Molecular Weight of the Protein and RNA Components of Bacteriophage MS2
The MS2 bacteriophage is a model organism for a number of important areas of research including viral replication, infection, and assembly [56]. Recently, noninfectious, genetically modified forms of the MS2 phage that contain varying amounts of RNA (compared to the wild-type phage) have been developed for use as biological standards [57, 58]. These commercially available recombinant particles, Armored RNAs, are used as reference material in research assays for the HIV, Ebola, Borna, Hepatitis A, C, and G, Dengue, Enterovirus, West Nile, and Norwalk viruses, among others [59].
The clinical use of these particles as biological standards in public health screening of humans and livestock has been hampered by the lack of rapid quantitative methods to analyze the physical properties of this family of particles. As these particles are not found in nature, they cannot be scientifically
9 SANS from Proteins, Nucleic Acids, and Viruses |
179 |
characterized by traditional methods. Specifically, these MS2-like biomarkers, because of their small size and the necessity that they be noninfectious, cannot be rapidly or reliably counted. As a result, this new generation of biological reference material cannot be cheaply characterized for general use in public health laboratories. This is solely due to the fact that their physical properties in solution cannot be quantified or confirmed. Thus, there is a need for instrumentation that can count biological particles, about which nothing is known, and that also can provide structural information about their properties in solution.
The creation of these new forms of MS2 has made it increasingly important to both understand the relationship of the indigenous MS2 RNA to its protein shell and to measure the molecular weight (Mw) of the wild-type RNA molecule in vivo under biological conditions. For practical purposes, the analysis of biological materials by SANS is almost exclusively used for structural analysis of molecules in combination with a variety of other techniques and not for the characterization of unknown viruses [3]. This is due in part because of the technical challenges associated with accurately determining particle concentration. Typically, particle number is measured by optical density (OD) in milligrams per milliliter using conventional spectrophotometry. Optical density measurements are possible only if the molar absorption coe cient of the sample is known. The molar absorption coe cient is a constant unique to the sample under study and assumes that the molecular weight of the sample is known [60]. Thus, characterization of an unknown virus or phage can only be accomplished by combining SANS with a novel virus counting instrument, the Integrated Virus Detection System (IVDS). The use of the IVDS instrument for virus counting is required because there is no other method to rapidly count small (<100 nm) biological particles with unknown properties in solution in the absence of viral infectivity or information about the particle Mw.
Purified MS2 phage was isolated by cesium chloride equilibrium gradient using a protocol similar to that described by Sambrook and Russell [61]. The measured density of the MS2 particles was 1.38 ± 0.01 g cm−3, which is the same density value reported by [62]. Samples for SANS measurements were made in bu ers containing 0%, 10%, 65%, 85%, and 100% D2O. The purity of the samples was confirmed by SDS polyacrylamide gel electrophoresis. The samples were dialyzed in the appropriate bu ers for 2 h at room temperature, with two changes of bu er, then transferred to sample holders.
Since MS2 can be approximated very well by a spherical shell at the resolution level of the SANS measurements, the data were also fit to a coreshell sphere model [4] in order to obtain the radius of the protein shell and RNA core. The neutron scattering length density of the RNA core was an additional fitting parameter that allowed the amount of water, versus RNA, in the core to be calculated. The scattered intensities from the MS2 protein/RNA complex were decomposed into the scattering from their components, IPROT(Q) and IRNA(Q) using Eq. 9.3. The Mw values of the
180 S. Krueger et al.
protein and RNA components of MS2 were calculated in a similar manner as described in [63]. It is important to note that I(0) must be on an absolute scale, usually in cm−1, in order to obtain accurate Mw values.
Number density determinations were made using two methods: (1) the concentration was measured by optical density (OD) using a conventional spectrophotometer and then the number density was estimated using this information and (2) the number density was obtained directly using the Integrated Virus Detection System (IVDS) which is a particle counting method [64].
Molecular Weight of the Protein and RNA Components
To obtain the Mw of the protein and RNA components of MS2, the number density, n, must be known. Both OD and IVDS methods were used to obtain this information, and the resultant number densities agreed very well. IVDS analysis thus makes possible a novel use of SANS as a tool for the identification and physical characterization of unknown viruses or phage. The Mw of the MS2 RNA and coat protein components, calculated from the number density information [63], are 1.0 × 10⁶ ± 0.2 × 10⁶ g mol−1 and 2.5 × 10⁶ ± 0.3 × 10⁶ g mol−1, respectively. MwPROT agrees well with expected value from the 2.8 ˚A resolution crystal structure [65]. The total Mw of the MS2 bacteriophage is 3.5×10⁶ ±0.5×10⁶ g mol−1, in good agreement with total Mw measurements using other techniques [63, and references therein]. These results show that the use of SANS in combination with IVDS makes possible quantitative physical characterization of viruses and phage.
Spatial Distribution of the Protein and RNA Components
The SANS data for a typical contrast variation series of measurements are shown, on an absolute scale, in Fig 9.11. At the resolution of the SANS measurements, the shape of an MS2 particle can be approximated very well by a spherical shell, with inner radius, R1, outer radius, R2, and shell thickness, t = R2 − R1. A sample model fit, made with and without correcting the model for instrumental resolution e ects, is shown for the 100% D2O data in Fig. 9.12. In all cases, the outer radius of the shell, R2, consistently falls between the values of 134 and 144 ˚A. The (core) inner radius, R1, falls between 110 ˚A and 118 ˚A, except for the 10% D2O bu er sample, which consistently shows a much smaller R1 value for both experiments. The RNA in the core scatters strongly in comparison with the protein shell under these solvent conditions. Thus, at this contrast, the lower value for R1 could be an indication that the RNA is actually packed compactly and does not completely fill the core region, with the remainder of the core being mostly solvent. The amount of water in the core was calculated from the fitted scattering length density of the core region for the data at each contrast [63]. The average fraction of water in the core region was found to be 0.81 ±0.04. If the values obtained in
10% D2O are excluded, the average parameters obtained from the core-shell model fit are R1 = 115 ± 1 ˚A, R2 = 136 ± 1 ˚A, t = 21 ± 1 ˚A.
9 SANS from Proteins, Nucleic Acids, and Viruses |
181 |
I (Q)
10 |
|
|
|
|
|
|
1 |
|
|
|
|
|
|
0.1 |
|
|
|
|
|
|
0.01 |
|
|
|
|
|
|
0.001 |
|
|
|
|
|
|
0.0001 |
|
|
|
|
(X 0.01) |
|
|
|
|
|
|
|
|
1e-05 |
|
|
|
|
|
|
0.00 |
0.02 |
0.04 |
0.06 |
0.08 |
0.10 |
0.12 |
|
|
|
Q (Å−1) |
|
|
|
Fig. 9.11. MS2 contrast variation series of scattered intensity curves from samples in 100% (circle) 85% (filled circle), 65% (square), 10% (diamond), and 0% D2O (filled square). The scattered intensity curves for 10 % D2O and 0% D2O have been multiplied by 0.01, for clarity
|
10 |
|
|
|
|
|
|
|
1 |
|
|
|
|
|
|
−1 |
0.1 |
|
|
|
|
|
|
I(Q)cm |
|
|
|
|
|
|
|
0.01 |
|
|
|
|
|
|
|
|
0.001 |
|
|
|
|
|
|
0.0001 |
0.02 |
0.04 |
0.06 |
0.08 |
0.10 |
0.12 |
|
|
0.00 |
||||||
Q (Å−1)
Fig. 9.12. A sample core-shell model fit for MS2, with (solid line) and without (dashed line) correcting the model for instrumental resolution e ects, for the 100% D2O data (circle)
Distance distribution functions, P (r), were obtained from the data and are plotted in Fig. 9.13. The P (r) functions are normalized so that the peak value is equal to 1.0 in each case. The maximum distance, Dmax, in all cases was found to be 300 ˚A, which is larger than 2 ×R2. By definition, Dmax is the distance at which P (r) goes to zero. Thus, Dmax suggests a sharp boundary between the particle and its surroundings. Since the shape of the MS2 coat protein region is actually icosahedral, this boundary is not sharp and the