

Neutron Scattering in Biology - Fitter Gutberlet and Katsaras
.pdf162 S. Krueger et al.
I(Q) = 4πVo 0 |
Dmax |
sin(Qr) |
dr, |
(9.2) |
|
P (r) |
|||||
|
|||||
Qr |
where Vo is the volume of the scatterer. The integral is carried out to a value Dmax, defined as the maximum distance beyond which there is no significant scattering mass of the biological sample. A number of indirect Fourier transformation methods exist [5–7] for calculating P (r) from I(Q). Typically, data are analyzed by first using Eq. 9.1 on the low-Q portions of the data to obtain initial values for Rg and I(0). An indirect Fourier transformation method, which makes use of all of the data, rather than a limited data set at small Q values, is then used to determine P (r), Rg, I(0), and Dmax. Dmax is chosen to obtain the best fit to the I(Q) vs. Q data with a Rg value that agrees well with that found using Eq. 9.1. While P (r) can help reveal the shape of the scatterer, further structural analysis requires comparison to model structures.
9.1.1 Modeling SANS Data
High Resolution Starting Structure is Available
When the X-ray crystal or NMR structure of the biological macromolecule is known, it is possible to calculate a model SANS intensity and Rg which allows for a direct comparison with the experimental data. One widely used program, cryson, calculates SANS intensities using spherical harmonics [8]. Because SANS is a low-resolution technique, atomic resolution is lost. However, if each residue in the protein were to be treated as a sphere of appropriate scattering length density and size, related to the particular amino acid sequence, then it is possible to gain back some structural resolution. Appropriate size beads are simply strung along the backbone to represent the protein. Then a scattering curve is calculated by using a Monte Carlo simulation [9]. Currently, such a program, XTAL2SAS, is being developed in collaboration with NIST and UMBC. XTAL2SAS is based on the original work of Glenn Olah, which relied on the method reported by Heidorn and Trewhella [10] to calculate a scattering profile from protein crystal structures. In the original program, a protein crystal structure (PDB file) is read into the program and each Cα carbon is taken as the center of a scattering sphere. The radius, molecular weight, volume, and neutron scattering length density (SLD) of each scattering sphere is dependent on the residue type [11]. In order to simulate the scattering profile, I(Q) vs. Q, the calculation of the distance distribution function, P (r), is first performed. This is generated by a Monte Carlo simulation of the scattering experiment whereby the spheres are randomly filled with points of known SLD dependent upon the residue type. P (r) is then calculated by summing all possible distances between all possible pairs of points in the total structure, weighted according to the neutron SLD for each point. Rg and I(Q) are then calculated from an integration of the P (r) function as shown in Eq. 9.2.
However, if the solution structure deviates from the crystal structure, then the calculation of a reasonable model to fit the experimental scattering data is
9 SANS from Proteins, Nucleic Acids, and Viruses |
163 |
extremely di cult, as was illustrated for the case of the conformational change in cAMP Receptor Protein (CRP). Recent studies found that when CRP is complexed with cAMP and DNA, it undergoes a rather drastic conformational change, as evident by the large increase in the protein radius of gyration and a shift in the neutron scattering curve [12]. To model this conformational change, a method of a constrained walk along well-defined conformational coordinates was developed. This was the first application of such a procedure to SANS and it enabled the calculation of a best fit structural model to the experimental data [12].
A solvent accessible surface area (SASA) like approach to treat the e ects of protein hydration, as determined by SANS, has also been developed as part of the XTAL2SAS program. A sphere of radius 6.5 ˚A is traced along the protein surface. A determination is made as to whether each surface residue is polar or nonpolar. For each polar surface residue, up to 5.0 ˚A of bound water is fit into the volume of the corresponding probe sphere. The scattering length density inside this hydration layer is that of bound water [13]. The scattering profile, I(Q) vs. Q, is then calculated as above by first determining the distance distribution function, P (r), by a Monte Carlo simulation of the scattering experiment. The scattered intensity is then calculated by Eq. 9.2.
High Resolution Starting Structure is Not Available
When a high resolution structure is not available, a low resolution structure can be built from one or more simple geometric shapes. The solid geometric structure is then randomly filled with points of uniform neutron SLD, each representing the average SLD of the molecule of interest. When more than one geometric shape is used to build a model structure, each can contain points of a di erent, uniform, SLD. By optimizing the geometric parameters of the structure to best fit experimental scattering data, a low resolution model is obtained. This is the basis behind the LORES program [14]. The first part of the program, involving the generation of a geometric model, relies on the same procedure as described in [9] for the generation of a set of scattering points within a given sub-volume. However, this original work has been extended to include many di erent shapes and to include an optimization procedure to determine the best fit geometric shape to inputted experimental data. The scattering points are generated, via a Monte Carlo method, to fall within a given volume (e.g., sphere, ellipsoid, cylinder, etc.). To simulate a uniform SLD within the given sub-volume, the total number of points is proportional to that volume. This method will ensure a uniform distribution of random points within a structure. It was found in the original work that the number of Monte Carlo points must be at least 1,000 in order to obtain a distribution that is indeed uniform [9].
Once a candidate structure is selected, the starting parameters and a given range for each parameter must also be input. During the course of the geometry optimization new parameters are generated randomly, subject to this
164 S. Krueger et al.
chosen range. The scattered intensity, I(Q) vs. Q, is calculated and compared with the experimental scattering profile. This is accomplished by calculating the distance distribution function, P (r), by making a histogram representation of all possible distances between all possible pairs of scattering points within the given structure, weighted according to the neutron SLD for each point. A radius of gyration, Rg is also calculated. The Monte Carlo optimization algorithm strives to minimize the χ2 distribution, in a least squares manner. For each model, a regression coe cient, R2, is also calculated. The Monte Carlo optimization will minimize the χ2 value and maximize the R2 value simultaneously. Values of Rg and volume can be input as additional optimization parameters. The program output consists of a family of possible models (in PDB format) as well as scattering profiles to best fit the data.
Last, an on-line, user friendly web based software package is being developed for the molecular modeling of small angle scattering data of biological macromolecules. This interface is composed of a front end with html-like documents. The back-end interfaces to XTAL2SAS, LORES, and other useful programs via a series of PERL wrappers, one for each program of interest. A prototype website is also available at [15].
9.1.2 Contrast Variation
Often advanced modeling techniques will be used in addition to the contrast variation technique, in which the isotopic substitution of D for H is routinely used to change the scattering length density of the macromolecule or solvent, in order to separate the scattering from the individual components in a multicomponent complex and model them independently [16]. Thus, the conformation of a particular component bound in the complex can be directly compared to that of its counterpart free in solution. For a two-component system, the scattering from the two components can be written as:
I(Q) = ∆ρ2I |
(Q) + ∆ρ ∆ρ I |
12 |
(Q) + ∆ρ2I |
(Q), |
(9.3) |
|||
1 |
1 |
1 |
2 |
2 |
2 |
|
|
|
where I(Q) is the measured scattered intensity of the complex and the contrast, ∆ρ = (ρ − ρs), is the di erence between the mean scattering length density of the molecule, ρ, and that of the solvent, ρs. I1(Q) and I2(Q) are the scattered intensities of components 1 and 2, bound in the complex. I12(Q) is the cross term between the two components. The Q value at which the cross term first reaches zero can be used to approximate the separation of the centers of masses of the two components, D = 2π/Q. If scattered intensities of the complex are measured in solvents with di erent H2O/D2O ratios, then a set of simultaneous equations can be solved in order to determine the unknowns, I1(Q), I2(Q) and I12(Q). Here, the measured scattered intensities, I(Q), as well as the contrasts, ∆ρ1 and ∆ρ2 are the known quantities. Specific examples of the use of contrast variation to obtain unique information will be presented on SANS structural studies of protein/protein and protein/RNA complexes.
9 SANS from Proteins, Nucleic Acids, and Viruses |
165 |
9.1.3 Experimental Examples
Three specific examples of using SANS to study the structure of biological systems are presented here. The systems are quite diverse, RNA, to protein/protein and protein/RNA complexes. In each case, di erent tools are used to model the structures measured by SANS. Although the RNA system is seemingly the simplest, its measured I(Q) curves cannot be fit to simple model shapes. Rather, a high resolution model structure is compared to the data using the CRYSON program [8]. For the protein/protein complex and protein/RNA complex, or phage, the contrast variation technique was used to separate the scattering from the two components. Then, the components and the complexes were modeled separately using both the LORES and XTAL2SAS programs.
All SANS measurements shown in the following examples were performed on the 30-m SANS instruments at the NIST Center for Neutron Research in Gaithersburg, MD [17]. Typical neutron wavelengths, (λ), were 5 or 6 ˚A, with a wavelength spread, ∆λ/λ of 0.15. Raw counts were normalized to a common monitor count and corrected for empty cell counts, ambient room background counts and nonuniform detector response. Data were placed on an absolute scale by normalizing the scattered intensity to the incident beam flux. The two-dimensional data were then radially averaged to produce I(Q) vs. Q curves. The one-dimensional scattered intensities from the samples were then corrected for bu er scattering and incoherent scattering from hydrogen in the samples. Guinier radii were found using Eq. 9.1 and the GNOM program [6] was used to calculate P (r).
9.2 Nucleic Acids: RNA Folding
9.2.1 Compaction of a Bacterial Group I Ribozyme
Like proteins, certain RNA molecules fold into unique three-dimensional structures that are essential for their biological activity. Ribozymes, RNA fragments that have enzymatic activity, are an example of this class of molecule. Typically, a precursor RNA (pre-RNA) fragment contains two coding exons separated by a noncoding intron (the ribozyme). The ribozyme must fold into a unique conformation in order to join the two exons together that form a full coding sequence, and then remove itself by self-splicing. The mechanism by which the folded structures form from the unfolded or denatured, state has become the subject of intense investigation, [32–34, for example]. In contrast to proteins, where hydrophobic interactions drive the collapse of the polypeptide chain, RNA folding requires counterions to neutralize the electrostatic repulsion between phosphate groups. The collapse of RNA chains to intermediate (non-native) structures in the presence of counterions is of fundamental importance because this determines the probability of forming biologically active structures in a short time.
166 S. Krueger et al.
Theoretical and experimental studies of DNA and RNA show that counterion condensation around nucleic acids reduces the e ective phosphate charge by 75–90% [35, and references therein]. Theoretical models of polyelectrolytes suggest that counterion condensation initially produces an ensemble of compact forms that contain both native and non-native interactions that slowly di use to the native state [33].
The presence of collapsed intermediates in RNA folding has been detected by biochemical [36, 37] and small angle X-ray scattering (SAXS) experiments [38, 39] and has demonstrated that counterions induce compact structures at concentrations below what is required to stabilize the native structure. Furthermore, in accordance with theoretical predictions [33], structural studies have shown that the initial collapse can occur in 1–10 ms [40][and references therein], which is a much shorter time than required to form the native RNA.
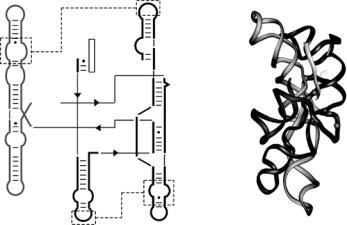
An important question is the extent to which the native interactions stabilize these compact folding intermediates. To address this question, SANS was used to measure changes in the global dimensions of a 195-nucleotide ribozyme of the Azoarcus bacterium [41] (Fig. 9.1) that is responsible for forming the RNA sequence that matches to the amino acid isoleucine (tRNAile). The collapse transition detected by SANS was compared with two conformational phase transitions previously defined by biochemical probes of RNA structure [41]: a transition from unfolded (U) RNA to a more ordered intermediate (IC) at low counterion concentrations that involve the assembly of helices in the core of the ribozyme, and a second transition from IC to the native tertiary structure (N) in higher Mg2+ concentrations that coincides with the
P9
5'
P5
|
|
5' |
P4 |
triple |
P7 |
|
helix
P6
P3
P6a
P2
P8
Fig. 9.1. The model structure of the Azoarcus group I ribozyme. The secondary and tertiary structure [41, and references therein] was modeled from comparative sequence analysis. Base-paired (P) regions in the ribozyme are indicated
9 SANS from Proteins, Nucleic Acids, and Viruses |
167 |
appearance of catalytic activity [37]. A variation of the latter is a transition from IC to IF in higher Na+ concentrations where the resulting structure is folded but inactive [42].
The Azoarcus ribozyme was transcribed in vitro, gel separated and purified following standard protocols [41, 42, and references therein]. RNA solution (2 mg/ml) was made in H2O bu er containing 0–20 mM MgCl2 or 0–2 M NaCl and maintained at 32◦C during the SANS measurements [43]. This was the highest RNA concentration attainable for which the scattering profile showed no evidence of particle–particle interactions, particularly when in bu er alone. The distance distribution functions, P (r), for the Azoarcus ribozyme in solution were compared to two standard analytic P (r) models: the Gaussian polymer chain and the sphere [43]. In addition, the P (r) corresponding to the sample with highest Mg2+ concentration (20 mM) was compared to the P (r) computed from the 3D atomic model of the Azoarcus ribozyme [8], as shown in Fig. 9.1.
Change in RNA Conformation
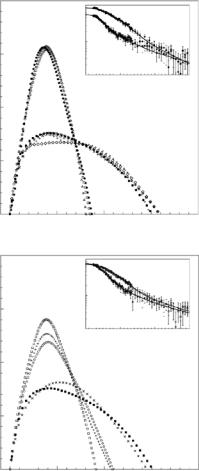
SANS curves for the ribozyme in increasing concentration of MgCl2 (0– 20 mM)and NaCl (0–2 M) are shown in Fig. 9.2a, b respectively. In both panels, the scattering curves are observed to fall into two distinct classes. The change in the scattering at low Q suggests that, for the lower counterion concentrations, the particles have a relatively larger Rg than for the higher counterion concentrations. Comparing Fig. 9.2a, b it is clear that for the Mg2+ titration series the transition between the two types of scattering curves occurs abruptly between 1.6 and 1.7 mM MgCl2, whereas the transition for the Na+ titration series is more gradual as the salt concentration varies between 0 and 450 mM NaCl. The fact that higher concentrations of Na+ are required to condense the RNA is consistent with the monovalent counterions being less e cient at charge neutralization [37, 42].
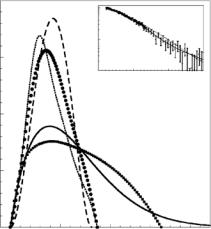
P (r) functions, determined from the scattering curves shown in Fig. 9.2 are shown in Fig. 9.3. It is evident from Fig. 9.3 that the two classes of P (r) functions relate to two distinct particle shapes: an extended shape at low counterion concentrations and a significantly more compact state at higher counterion concentrations. The variation in the maximum extension of the particles, Dmax, for both the extended and the compact shapes was approximately 7%. Rg, which can be computed from P (r) [43], decreased from
˚ |
below 1.6 mM MgCl2 |
˚ |
above 1.7 mM |
|
an average of 53 ± 1 A |
to 31.5 ± 0.5 A |
|||
|
˚ |
in 2 M NaCl. |
|
|
MgCl2 and to 33.4 ± 0.2 A |
|
|
||
To evaluate the nature of the unfolded state, the P (r) functions at low counterion concentrations were compared to a standard Gaussian chain model (random coil) with an equivalent Rg. This is shown in Fig. 9.4, where it is clear that the mass of the RNA measured in H2O bu er with no added salts is distributed over shorter distances than predicted by the random coil model. The experimental data also show that the value of P (r) is greater over distances of 90–130 ˚A than what would be expected for a random coil model. This

168 S. Krueger et al.
(a)
I (Q)
(b)
I (Q)
0.1
0.01
0.001
0
0.1
0.01
0.001
0
0.05 |
0.1 |
0.15 |
|
Q [ Å−1] |
|
0.05 |
0.1 |
0.15 |
Q [ Å−1]
Fig. 9.2. (a) Mg2+ concentration dependence for RNA in H2O bu er with no added salts (filled square), 1 mM Mg2+ (diamond), 1.3 mM Mg2+ (x), 1.5 mM Mg2+ (circle), 1.6 mM Mg2+ (+), 1.7 mM Mg2+ (square), 4 mM Mg2+ (triangle), 20 mM
Mg2+ (filled circle). (b) Na+ concentration dependence for RNA in H2O bu er with no added salts (filled square), 100 mM Na+ (x), 450 mM Na+ (circle), 750 mM Na+ (+), 2 M Na+ (square)
suggests that RNA is more rigid than a Gaussian chain and this local sti ness is presumably due to double helical segments in the unfolded RNA.
Comparing the corresponding P (r) curve for the 20 mM Mg2+ sample, where the ribozyme is in its native conformation, to the predicted real space density correlation function for the 3D model of the ribozyme shown in Fig. 9.1, P (r)3D, and to the real space density correlation function for a sphere, P (r)sphere, it is clear that the experimental P (r) curve for the 20 mM Mg2+ sample has a greater resemblance to P (r)3D than to P (r)sphere, especially for r < Rg. This is reinforced by the fact that the computed scattering curve from the 3D model of the ribozyme, I(Q)3D, is similar to the SANS data for
9 SANS from Proteins, Nucleic Acids, and Viruses |
169 |
P (r ) / I (0)
P (r ) / I (0)
0.002
|
|
0.1 |
|
|
|
|
(Q) |
0.01 |
|
|
|
0.0015 |
I |
|
|
|
|
|
|
|
|
|
|
|
|
0.001 |
0.05 |
0.1 |
0.15 |
|
|
0 |
|||
|
|
|
Q [ Å−1] |
|
|
0.001 |
|
|
|
|
|
0.0005 |
|
|
|
|
|
0 |
50 |
|
100 |
150 |
200 |
0 |
|
||||
|
|
r |
[ Å ] |
|
|
0.002 |
|
0.1 |
|
|
|
|
|
|
|
|
|
|
(Q) |
0.01 |
|
|
|
0.0015 |
I |
|
|
|
|
|
|
|
|
|
|
|
|
0.001 |
0.05 |
0.1 |
0.15 |
|
|
0 |
|||
|
|
|
Q [ Å−1] |
|
|
0.001 |
|
|
|
|
|
0.0005 |
|
|
|
|
|
0
0 |
50 |
100 |
150 |
200 |
|
r |
[ Å ] |
|
|
Fig. 9.3. P (r) distributions were obtained from the SANS data in Fig. 9.2 according to Eq. 9.2 and scaled by Icalc(0)−1. Symbols are as in Fig. 9.2. (a) Mg2+ titration. (b) Na+ titration. Insets: Scattering curves computed from P (r) distribution functions are compared with neutron scattering data from samples containing 0 and 20 mM MgCl2 or 0 and 2 M NaCl, respectively
the 20 mM Mg2+ sample (inset in Fig. 9.4), except that the 3D model yields a smaller Rg of 30 ˚A compared to the experimental Rg of 31.5 ±0.5 ˚A. This difference cannot be attributed to experimental error. The di erence in the most probable value of r between the P (r) curve for the 20 mM Mg2+ sample and P (r)3D could be due to either conformational fluctuations in the native state or errors in the model, which is based on comparative sequence analysis [41] .
170 S. Krueger et al.
P (r ) / I (0)
0.002
|
0.1 |
|
|
|
(Q) |
0.01 |
|
|
|
I |
|
|
|
|
0.0015 |
|
|
|
|
0.001 |
0.05 |
0.1 |
0.15 |
|
|
0 |
|||
Q [ Å−1]
0.001
0.0005
0
0 |
50 |
100 |
150 |
200 |
|
r |
(Å) |
|
|
Fig. 9.4. P (r) functions obtained from SANS data for RNA in H2O bu er with no added salt (filled squares); 20 mM Mg2+ (filled circles). The curves represent Prandomcoil(r) for a random coil (solid line), Rg = 53 ˚A; Psphere(r) for a uniform sphere (long dashed line), Rg = 31.5 ˚A; P3D(r) for the 3D atomic model (dashed line), Rg = 30 ˚A. Inset: SANS data for RNA in H2O bu er plus 20 mM Mg2+. The continuous curves correspond to Icalc(Q) computed from the experimental P (r) (solid line) and I3D(Q), computed from the 3D model (dotted line)
Di erences in the size of the compact states formed in Mg2+ and Na+ are small, with a deviation in Rg at the largest salt concentrations of about
˚ |
(Fig. 9.3). A slightly less compact shape is attained in 2 M NaCl (Rg = |
|
2 A |
||
|
˚ |
˚ |
33.4 ± 0.2 A) than in 20 mM MgCl2 |
(Rg = 31.5 ± 0.5 A). If saturation was |
|
not reached even at 2 M NaCl, it is possible that at higher concentrations the di erence in Rg becomes smaller. The similarity of Rg values obtained in Mg2+ and Na+ is consistent with biochemical results showing that the ribozyme forms many tertiary interactions in monovalent salts, lacking only a few within the active site [42].
9.2.2 RNA Compaction and Helical Assembly
Counterion-mediated Collapse
Multivalent cations drive the compaction of RNA chains more e ciently than monovalent cations [37, and references therein]. In the case of the Azoarcus ribozyme, a 100-fold lower concentration of Mg2+ than Na+ is required to induce compaction. Because electrostatic repulsion of the phosphates is a major force opposing RNA folding, the Rg of an approximately spherical folded RNA is expected to correlate with its residual net charge after counterion condensation. The Azoarcus ribozyme forms a compact structure in the presence of
9 SANS from Proteins, Nucleic Acids, and Viruses |
171 |
counterions when approximately 90% of the phosphate charge is neutralized, which is qualitatively consistent with previous work [44, 45]. The idea that the collapse transition of the RNA is not driven by site-specific coordination of metal ions is supported by the fact that the net charge per phosphate is roughly equal in Na+ and Mg2+.
Collapse Correlates with Helix Assembly
Because of nearly complete neutralization of the backbone charges due to nonspecific counterion condensation, an important question is whether the metal ion induced decrease in Rg of the ribozyme correlates with the degree of native structure. Two macroscopic conformational transitions in the Azoarcus ribozyme occur with increasing Mg2+ concentration [41]. Under conditions with no added salts, only the P2, P4, P5, and P6a stem-loops are detected by protection of guanine nucleotides from RNase T1 digestion, and the RNA appears largely unfolded (U). At moderate concentrations of monovalent or divalent salts, the double helices in the core of the ribozyme (IC) are stabilized, including the P3/P7 pseudoknot and a triple helix that mediates interactions between the P4–P6 and P3–P9 domains (Fig. 9.1). Higher Mg2+ concentrations are required to form the native tertiary structure (N) and for catalytic activity [41]. Similar transitions are observed with other monovalent and divalent counterions, except that the resulting structure is folded but inactive (IF) [42].
To determine which of these transitions (U → IC or, correspondingly, IC → N in Mg2+ or IC → IF in Na+) correlate with compaction of the RNA, the secondary structure of the ribozyme was probed by partial digestion with RNase T1 and splicing assays under the conditions of the SANS experiments. In partial RNase T1 digestion assays, RNase T1 reacts with solvent accessible guanine (G) residues of 5 -32P-labeled ribozyme. Separation of the products, done through a standard sequencing gel, maps the specific G nucleotides along the RNA sequence a ected by RNase T1 digestion [41, 42, and references therein]. Self-splicing assays indicate that the amount of catalytic activity in 32P-labeled pre-tRNA. Using a standard size exclusion gel, catalytic activity is quantified by the amount of spliced product [41, 43, and references therein].
Addition of counterions resulted in the protection of G nucleotides in the core of the ribozyme. The midpoint of base pairing in the core is close to the counterion concentration at which the collapse of the RNA was observed (1.7 mM Mg2+ and 450 mM Na+, respectively). By contrast, a splicing assay showed that fivefold higher Mg2+ concentrations were required for self-splicing activity under these conditions, the midpoint of the transition to the native structure being 4.5 mM Mg2+, with maximal activity above 20 mM Mg2+. That the assembly of helices in the ribozyme core occurs at low Mg2+ concentrations and precedes tertiary folding is suggested in previous and recent experiments [43, and references therein]. Even after this fivefold increase in Mg2+ concentration, no further compaction of the ribozyme is observed by